Download to read offline


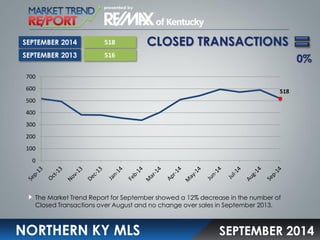


The median home sales price in September 2014 was $131,000, down 6% from August and 4% lower than September 2013. The number of closed home sales transactions decreased 12% compared to August and remained unchanged from September 2013 at 518 homes. The average days on the market for homes sold was 82 days, up 6 days from August and 3 days more than September 2013. The months supply of home inventory was 5.5 months at the end of September, a 12% increase from August and 13% lower than September 2013.


