Download to read offline


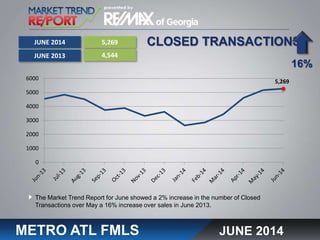
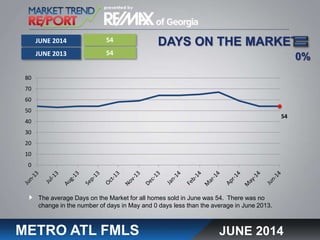
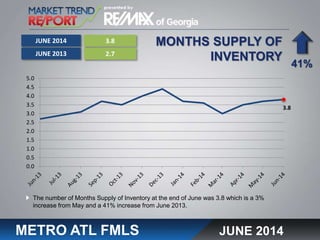

The median home sales price in the Metro Atlanta area increased 3% in June 2014 compared to May 2014 and was up 8% from June 2013. The number of closed home sales transactions rose 2% over May 2014 and increased 16% compared to June 2013. The average number of days homes spent on the market was 54 days in June 2014, unchanged from May 2014 and down 0 days from June 2013. The months supply of home inventory increased 3% from May 2014 and was up 41% from June 2013.


