Download to read offline


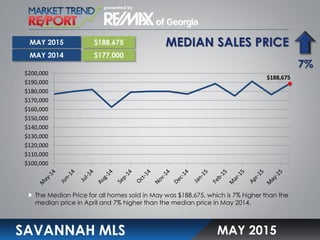
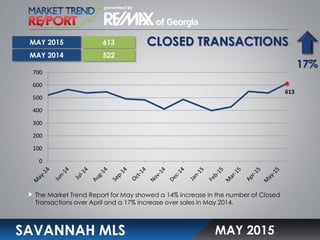


The median home sales price in Savannah for May 2015 was $188,675, a 7% increase from April 2015 and May 2014. The number of closed home sales transactions in May 2015 saw a 14% rise compared to April 2015 and a 17% jump versus May 2014. The average days on the market for homes sold in May 2015 was 115 days, unchanged from April 2015 but two days more than May 2014. The months supply of home inventory at the end of May 2015 was 5.0 months, a 19% rise from April 2015 but a 2% drop from May 2014.


