Download to read offline


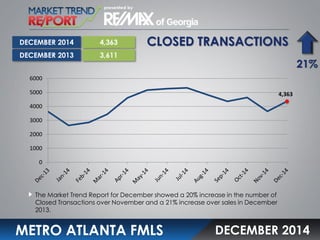
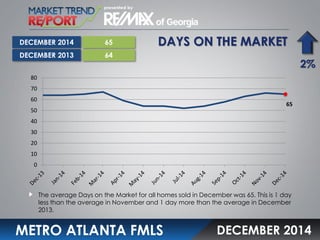
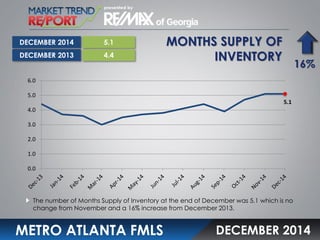

The median home sales price in the Metro Atlanta area increased 3% in December 2014 compared to November 2014 and was up 4% from December 2013. There was also a 21% rise in the number of closed home sale transactions in December 2014 over the previous year. The average days on the market for homes sold was 65 days in December 2014, which was 1 day less than November 2014 and 1 day more than December 2013. The number of months of inventory remained at 5.1 months at the end of December 2014, representing a 16% rise from December 2013.


