Download to read offline


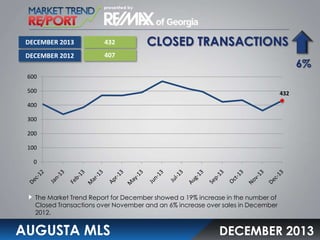
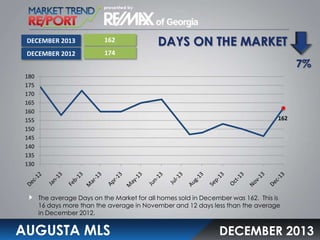


The document summarizes real estate data for Augusta, GA in December 2013 from the Augusta MLS Market Trend Report. It shows that in December 2013: - The median home sales price was $151,725, unchanged from November but 1% lower than December 2012. - Closed home sales transactions increased 6% compared to December 2012, totaling 432 sales. - The average days on the market for homes sold was 162 days, 7% less than December 2012. - The months supply of inventory was 9.9 months, an 8% decrease from December 2012.


