Download to read offline


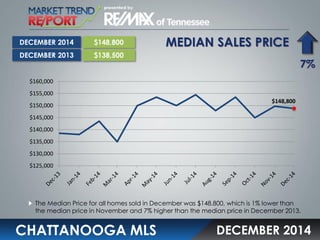
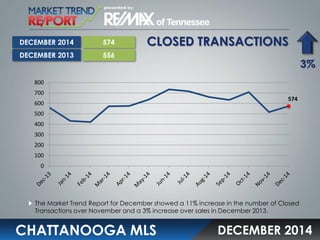
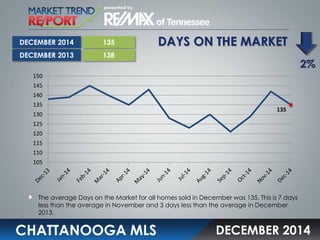
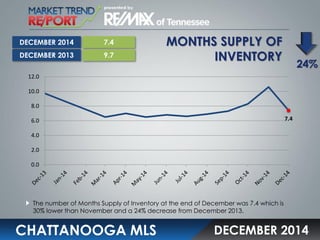

The median home sales price in Chattanooga in December 2014 was $148,800, 1% lower than November but 7% higher than December 2013. The number of closed home sales transactions increased 11% compared to November and 3% compared to the previous December. The average days on the market for homes sold was 135 days, down 7 days from November and 3 days from December 2013. The months supply of inventory was 7.4 months at the end of December, a 30% decrease from November and 24% lower than December 2013.


