Download to read offline


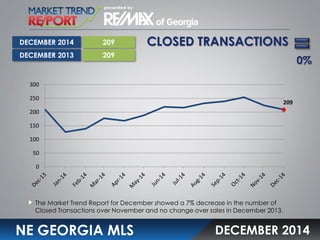
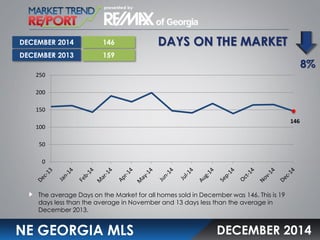


The median home sales price in December 2014 was $152,000, which was 1% higher than December 2013 but 5% lower than November 2014. The number of closed home sales transactions decreased 7% from November 2014 and remained unchanged from December 2013. The average days on the market for homes sold was 146 days in December 2014, which was 13 days less than in December 2013 and 19 days less than in November 2014. The months supply of inventory was 17.3 months in December 2014, down 15% from December 2013 but up 5% from November 2014.


