Download to read offline

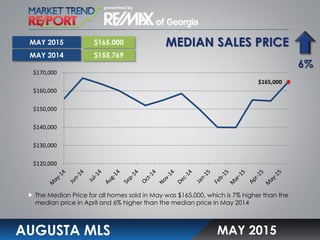
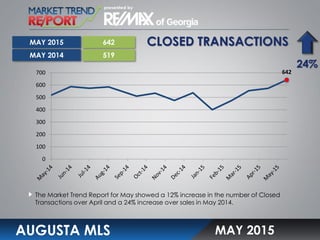
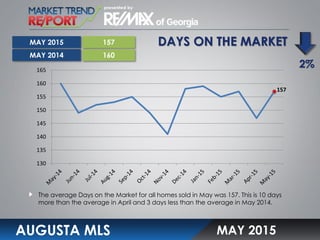
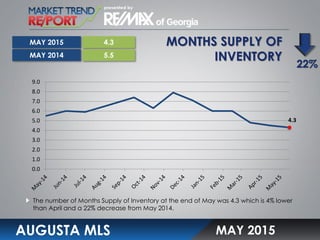

The median home sales price in Augusta MLS for May 2015 was $165,000, a 7% increase from April 2015 and a 6% increase from May 2014. There was also a 12% increase in the number of closed home sale transactions in May 2015 compared to April 2015 and a 24% increase compared to May 2014. The average days on the market for homes sold in May 2015 was 157 days, which was 10 days more than April 2015 but 3 days less than May 2014. The number of months of inventory available at the end of May 2015 was 4.3, which was 4% lower than April 2015 and 22% lower than May 2014.


