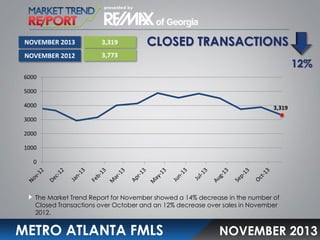
METRO ATLANTA FMLS

NOVEMBER 2013
NOVEMBER 2013

$171,000

NOVEMBER 2012

MEDIAN SALES PRICE

$143,000

20%

$250,000

$200,000

$171,000

$150,000
$100,000
$50,000
$0

The Median Price for all homes sold in November was $171,000, which was 6%
lower than the median price in October and 20% higher than the price in
November 2012.

METRO ATLANTA FMLS

NOVEMBER 2013
NOVEMBER 2013

3,319

NOVEMBER 2012

CLOSED TRANSACTIONS

3,773

12%

6000

5000
4000

3,319

3000
2000
1000

0

The Market Trend Report for November showed a 14% decrease in the number of
Closed Transactions over October and an 12% decrease over sales in November
2012.

METRO ATLANTA FMLS

NOVEMBER 2013
NOVEMBER 2013

59

NOVEMBER 2012

DAYS ON THE MARKET

74

20%

80
70
60
50

59

40
30
20
10
0

The average Days on the Market for all homes sold in November was 59. This is 1
day more than the average in October and 15 days less than the average in
November 2012.

METRO ATLANTA FMLS

NOVEMBER 2013
NOVEMBER 2013

4.0

NOVEMBER 2012

5.2

MONTHS SUPPLY OF
INVENTORY

23%

6.0
5.0
4.0
4
3.0
2.0
1.0

0.0

The number of Months Supply of Inventory at the end of November was 4.0 which is
a 14% increase from October and a 23% decrease from November 2012.

METRO ATLANTA FMLS

NOVEMBER 2013
Description
The Market Trend Report is distributed each month on or about the 15th.
The Report is based on data provided by Terradatum from the local
Metro Atlanta First Multiple Listing Service and is not annualized. While
MLS and Terradatum data are believed to be accurate, it cannot be
guaranteed. MLS data is constantly being updated, making any analysis
a snapshot at a particular time. Data for prior periods is not being
recalculated for this report.

Definitions
Median Sales Price is the median price of all residential properties sold
during the month. Closed Transactions are the number of residential
transactions closed during the given month. Days on the Market is the
number of days that pass from the time a property is listed until the
property goes under contract for all residential properties sold during the
month. Months Supply of Inventory is the total number of residential
properties listed for sale at the end of the month (active inventory)
divided by the number of sales contracts signed (pended) during the
month).

Metroatlmtnovember2013 131118153112-phpapp02

  • 1.
  • 2.
    NOVEMBER 2013 $171,000 NOVEMBER 2012 MEDIANSALES PRICE $143,000 20% $250,000 $200,000 $171,000 $150,000 $100,000 $50,000 $0 The Median Price for all homes sold in November was $171,000, which was 6% lower than the median price in October and 20% higher than the price in November 2012. METRO ATLANTA FMLS NOVEMBER 2013
  • 3.
    NOVEMBER 2013 3,319 NOVEMBER 2012 CLOSEDTRANSACTIONS 3,773 12% 6000 5000 4000 3,319 3000 2000 1000 0 The Market Trend Report for November showed a 14% decrease in the number of Closed Transactions over October and an 12% decrease over sales in November 2012. METRO ATLANTA FMLS NOVEMBER 2013
  • 4.
    NOVEMBER 2013 59 NOVEMBER 2012 DAYSON THE MARKET 74 20% 80 70 60 50 59 40 30 20 10 0 The average Days on the Market for all homes sold in November was 59. This is 1 day more than the average in October and 15 days less than the average in November 2012. METRO ATLANTA FMLS NOVEMBER 2013
  • 5.
    NOVEMBER 2013 4.0 NOVEMBER 2012 5.2 MONTHSSUPPLY OF INVENTORY 23% 6.0 5.0 4.0 4 3.0 2.0 1.0 0.0 The number of Months Supply of Inventory at the end of November was 4.0 which is a 14% increase from October and a 23% decrease from November 2012. METRO ATLANTA FMLS NOVEMBER 2013
  • 6.
    Description The Market TrendReport is distributed each month on or about the 15th. The Report is based on data provided by Terradatum from the local Metro Atlanta First Multiple Listing Service and is not annualized. While MLS and Terradatum data are believed to be accurate, it cannot be guaranteed. MLS data is constantly being updated, making any analysis a snapshot at a particular time. Data for prior periods is not being recalculated for this report. Definitions Median Sales Price is the median price of all residential properties sold during the month. Closed Transactions are the number of residential transactions closed during the given month. Days on the Market is the number of days that pass from the time a property is listed until the property goes under contract for all residential properties sold during the month. Months Supply of Inventory is the total number of residential properties listed for sale at the end of the month (active inventory) divided by the number of sales contracts signed (pended) during the month).