Download to read offline

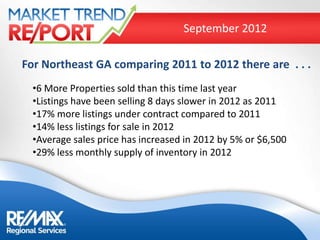
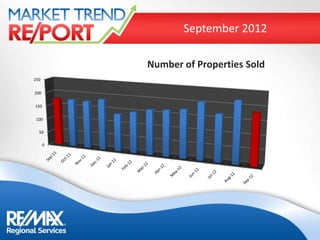
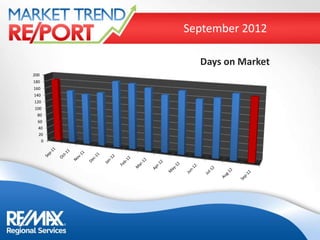
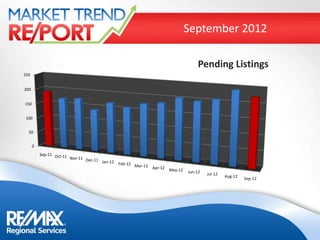
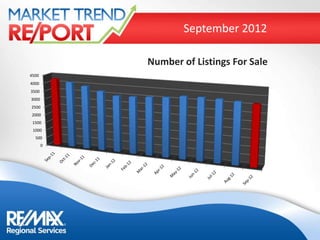
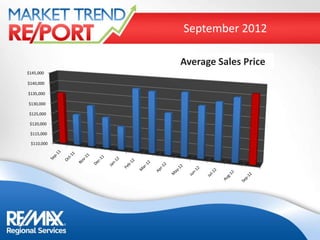
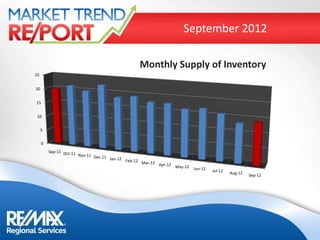


The real estate market in Northeast GA saw improvements in 2012 compared to 2011. There were 6 more properties sold, listings took 8 days longer to sell on average, pending listings were up 15%, active listings were down 17%, the average sales price increased 5% ($6,500), and monthly inventory supply decreased 40%.


