Download to read offline
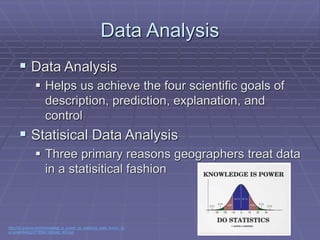
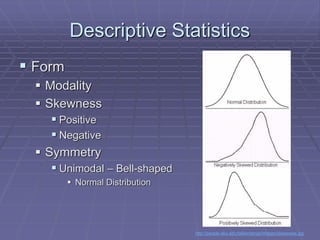
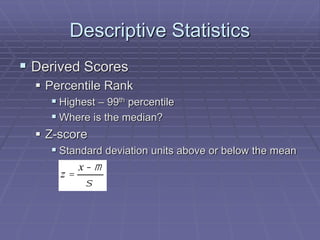
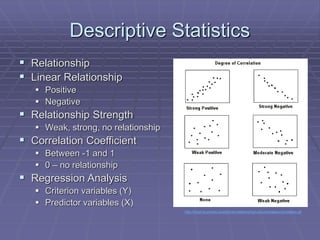
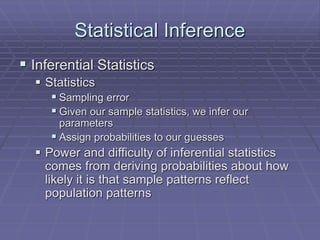

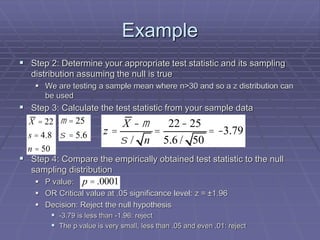
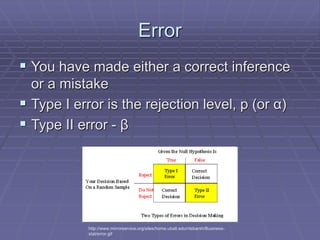
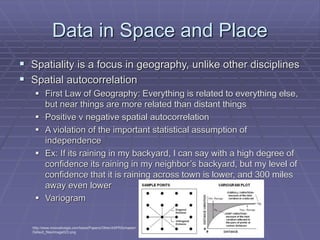
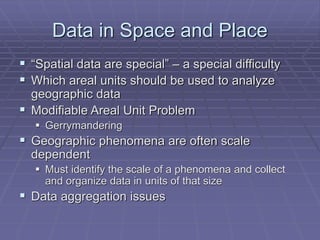

Statistical data analysis helps achieve scientific goals of description, prediction, explanation, and control. There are descriptive statistics like measures of central tendency (mean, median, mode) and variability (range, variance, standard deviation) to describe data. Inferential statistics allow inferences about populations from samples using hypothesis testing, estimation, and considerations of sampling error, assumptions, and spatial autocorrelation. Key challenges include accounting for spatial dependencies in geographic data and issues like the modifiable areal unit problem.