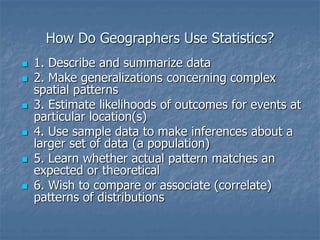
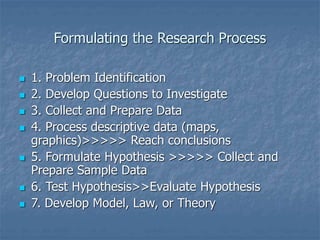
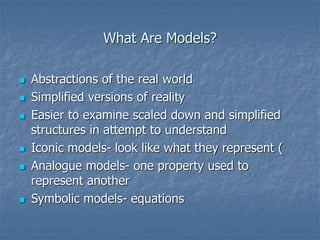
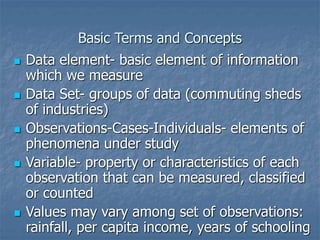
Role of Statistics in Geography
What Is Geography?
 1. Attempt to describe, explain and predict
spatial patterns and activities
 2. How and why do things differ from
place to place?
 3. How do spatial patterns change through
time?
How Do Geographers Approach Discipline
 1. Positivism- objectivity of scientific analysis and
testing hypotheses to build knowledge and
understanding
 2. Humanistic- people create subjective worlds in
their minds- behavior understood only by a
methodology that penetrates the subjectivity
 3. Structuralists- cannot explain observed pattern
by examining pattern itself. But rather establish
theories to explain development of societal
conditions within which people must act
Role of Statistics
 Room in all the above interpretations for
quantitative analysis.
 But increasingly both quantitative and qualitative
analysis are important
 Qualitative analysis involves?
 Statistics and measurement are used commonly in
our lives
 A. Making home purchase decisions
 B. Setting up investments
 C. Weather variations are expressed as
probabilities
How Do Geographers Use Statistics?
 1. Describe and summarize data
 2. Make generalizations concerning complex
spatial patterns
 3. Estimate likelihoods of outcomes for events at
particular location(s)
 4. Use sample data to make inferences about a
larger set of data (a population)
 5. Learn whether actual pattern matches an
expected or theoretical
 6. Wish to compare or associate (correlate)
patterns of distributions
Formulating the Research Process
 1. Problem Identification
 2. Develop Questions to Investigate
 3. Collect and Prepare Data
 4. Process descriptive data (maps,
graphics)>>>>> Reach conclusions
 5. Formulate Hypothesis >>>>> Collect and
Prepare Sample Data
 6. Test Hypothesis>>Evaluate Hypothesis
 7. Develop Model, Law, or Theory
What Are Models?
 Abstractions of the real world
 Simplified versions of reality
 Easier to examine scaled down and simplified
structures in attempt to understand
 Iconic models- look like what they represent (
 Analogue models- one property used to
represent another
 Symbolic models- equations
Basic Terms and Concepts
 Data element- basic element of information
which we measure
 Data Set- groups of data (commuting sheds
of industries)
 Observations-Cases-Individuals- elements of
phenomena under study
 Variable- property or characteristics of each
observation that can be measured, classified
or counted
 Values may vary among set of observations:
rainfall, per capita income, years of schooling
Geographic Data
 1. What sources of data are available?
 2. Which methods of data collections
should be used?
 3. What type of data will be collected and
then analyzed statistically?
Types of Data
 Primary Data- acquired directly from
original source
 1. Information collected in the field
 2. Usually very time consuming
 3. Involves decision about a sample
design so representative data may be
obtained
Types of Data
 Secondary Data (or Archival Data)
 1. Usually collected by some organization
(United Nations, U S Bureau of Census)
 2. Often easily accessible- hardcopy or CD rom
 3. Less time consuming but also more limiting
 4. Often need to inspect historical records and
archives for diaries, oral histories, official reports
in order to develop a picture of problem
Characteristics of Data
 1. Some data are explicitly spatial-
locations are directly analyzed
 2. Other data implicitly spatial- data
represents places but locations themselves
are not analyzed (population sizes of
towns)
Measurement Concepts
 1.Precision- level of exactness associated with
measurement (rain gauge to inches or fractions of
inches)
 2. Accuracy- extent of system wide bias in
measurement process
 3. Validity- if geographical concept is complex
expressing “true” or “appropriate” meaning of the
concept through measurement may be difficult
(levels of poverty, economic well being,
environmental quality)
 4. Reliability- changes in spatial patterns are
analyzed over time must ask about consistency
and stability of data

Types of Statistical Analysis
 Descriptive Statistics- concise numerical or
quantitative summaries of the characteristics of a
variable or data set (e.g. mean, standard
deviation, etc)
 Inferential Statistics- here we wish to make
generalizations about a statistical population
(total set of information or data under
investigation) based on the information from a
sample
 Sample- typical or representative or unbiased
subset of the broader, larger more complete
statistical population

Role_of_Statistics_in_Geography.ppt

  • 1.
    Role of Statisticsin Geography
  • 2.
    What Is Geography? 1. Attempt to describe, explain and predict spatial patterns and activities  2. How and why do things differ from place to place?  3. How do spatial patterns change through time?
  • 3.
    How Do GeographersApproach Discipline  1. Positivism- objectivity of scientific analysis and testing hypotheses to build knowledge and understanding  2. Humanistic- people create subjective worlds in their minds- behavior understood only by a methodology that penetrates the subjectivity  3. Structuralists- cannot explain observed pattern by examining pattern itself. But rather establish theories to explain development of societal conditions within which people must act
  • 4.
    Role of Statistics Room in all the above interpretations for quantitative analysis.  But increasingly both quantitative and qualitative analysis are important  Qualitative analysis involves?  Statistics and measurement are used commonly in our lives  A. Making home purchase decisions  B. Setting up investments  C. Weather variations are expressed as probabilities
  • 5.
    How Do GeographersUse Statistics?  1. Describe and summarize data  2. Make generalizations concerning complex spatial patterns  3. Estimate likelihoods of outcomes for events at particular location(s)  4. Use sample data to make inferences about a larger set of data (a population)  5. Learn whether actual pattern matches an expected or theoretical  6. Wish to compare or associate (correlate) patterns of distributions
  • 6.
    Formulating the ResearchProcess  1. Problem Identification  2. Develop Questions to Investigate  3. Collect and Prepare Data  4. Process descriptive data (maps, graphics)>>>>> Reach conclusions  5. Formulate Hypothesis >>>>> Collect and Prepare Sample Data  6. Test Hypothesis>>Evaluate Hypothesis  7. Develop Model, Law, or Theory
  • 7.
    What Are Models? Abstractions of the real world  Simplified versions of reality  Easier to examine scaled down and simplified structures in attempt to understand  Iconic models- look like what they represent (  Analogue models- one property used to represent another  Symbolic models- equations
  • 8.
    Basic Terms andConcepts  Data element- basic element of information which we measure  Data Set- groups of data (commuting sheds of industries)  Observations-Cases-Individuals- elements of phenomena under study  Variable- property or characteristics of each observation that can be measured, classified or counted  Values may vary among set of observations: rainfall, per capita income, years of schooling
  • 9.
    Geographic Data  1.What sources of data are available?  2. Which methods of data collections should be used?  3. What type of data will be collected and then analyzed statistically?
  • 10.
    Types of Data Primary Data- acquired directly from original source  1. Information collected in the field  2. Usually very time consuming  3. Involves decision about a sample design so representative data may be obtained
  • 11.
    Types of Data Secondary Data (or Archival Data)  1. Usually collected by some organization (United Nations, U S Bureau of Census)  2. Often easily accessible- hardcopy or CD rom  3. Less time consuming but also more limiting  4. Often need to inspect historical records and archives for diaries, oral histories, official reports in order to develop a picture of problem
  • 12.
    Characteristics of Data 1. Some data are explicitly spatial- locations are directly analyzed  2. Other data implicitly spatial- data represents places but locations themselves are not analyzed (population sizes of towns)
  • 13.
    Measurement Concepts  1.Precision-level of exactness associated with measurement (rain gauge to inches or fractions of inches)  2. Accuracy- extent of system wide bias in measurement process  3. Validity- if geographical concept is complex expressing “true” or “appropriate” meaning of the concept through measurement may be difficult (levels of poverty, economic well being, environmental quality)  4. Reliability- changes in spatial patterns are analyzed over time must ask about consistency and stability of data 
  • 14.
    Types of StatisticalAnalysis  Descriptive Statistics- concise numerical or quantitative summaries of the characteristics of a variable or data set (e.g. mean, standard deviation, etc)  Inferential Statistics- here we wish to make generalizations about a statistical population (total set of information or data under investigation) based on the information from a sample  Sample- typical or representative or unbiased subset of the broader, larger more complete statistical population