1. Chapter 5: Quantitatve Methods in Health Care ManagementChapter 5: Quantitatve Methods in Health Care ManagementYasar A. OzcanYasar A. Ozcan 11
Chapter 5.Chapter 5.
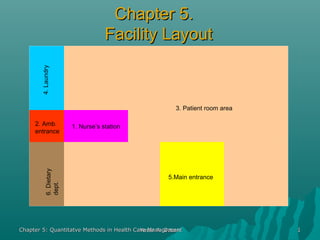
Facility LayoutFacility Layout
1. Nurse’s station
5.Main entrance
3. Patient room area
2. Amb.
entrance
4.Laundry6.Dietary
dept.
2. Chapter 5: Quantitatve Methods in Health Care ManagementYasar A. Ozcan 2
OutlineOutline
Overview of Layout Decisions
Product Layout
Process Layout Methods
– Minimizing Costs & Distances
– Computerized Layouts
Fixed Position Layout
3. Chapter 5: Quantitatve Methods in Health Care ManagementYasar A. Ozcan 3
A General ApproachA General Approach
Whenever an existing facility is renovated or a new facility
designed, the chance exists to develop a layout that will
improve process flow and minimize wasted space.
When a new facility is designed, the facility layout should be
integrated into the architectural design.
Limitations on building lot size and shape, however, may
heavily influence the layout configurations available. In
other situations, a new layout is achieved simply by
renovating an existing area, in which case the size and
shape of the area is set, and the limitations relating to the
funds available.
4. Chapter 5: Quantitatve Methods in Health Care ManagementYasar A. Ozcan 4
A General ApproachA General Approach
The basic goals in developing a facility layout should be
functionality and cost savings.
Functionality includes placing the necessary
departments, such as the operating and recovery rooms,
close together.
Functionality also includes keeping apart those
departments which should not be together.
Overall, functionality includes aspects of a layout which
may not be immediately quantifiable, such as facilitating
communication and improving staffer morale.
5. Chapter 5: Quantitatve Methods in Health Care ManagementYasar A. Ozcan 5
Existing Inefficiencies (e.g.. high costs)
Accidents or Safety Hazards
Changes in Offerings
New Offerings
Volume Changes (patient volume and/or mix- output)
Changes in Methods or Equipment
Changes in Environment or Laws
Morale Problems
Reengineering of Facilities and Services
Summary of Reasons for New Layout
6. Chapter 5: Quantitatve Methods in Health Care ManagementYasar A. Ozcan 6
Two key elements of these goals are saving space, and
reducing the travel distance/time between departments.
The amount of space allocated to a given department often is
set by factors beyond the control of the facility planner,
whose job it then is to make the most of that space.
A poorly designed work-space harms both productivity and
quality.
Another aspect, the travel distance between departments, is a
cost that can reach enormous proportions long-term.
What may seem a short walk to a designer may add up, over
the life of a facility, to days lost to travel. That not only
adds to costs, but also weakens staff morale.
Other AspectsOther Aspects
7. Chapter 5: Quantitatve Methods in Health Care ManagementYasar A. Ozcan 7
Which layout type should we choose?Which layout type should we choose?
Product Layouts
Process Layouts
Fixed-Position Layouts
8. Chapter 5: Quantitatve Methods in Health Care ManagementYasar A. Ozcan 8
The Product Layout
Used for highly standardized (repetitive)
processing operations
Achieves a smooth, rapid, high-volume flow
Examples: Production or Assembly lines
In healthcare/hospitals it is rarely used. It
may be seen in the labs, pharmacy, and
cafeteria.
9. Chapter 5: Quantitatve Methods in Health Care ManagementYasar A. Ozcan 9
The Process Layout
Facilitate processing items or providing services that
present a variety of processing requirements
Features departments or functional groups; examples
of a process layout can be found in physician offices
(group practice), a clinic, or hospitals.
The hospital groups together functions such as
intensive care, surgery, emergency medicine, and
radiology as separate departments.
This arrangement allows one patient entering through
the emergency room to be seen in radiology, possibly
surgery, and then intensive care, and another to be
admitted directly for elective surgery and then to
intensive care.
The variability among patients makes such flexibility
necessary.
10. Chapter 5: Quantitatve Methods in Health Care ManagementYasar A. Ozcan 10
Process Layout Tools
The many tools for designing a process layout generally
weigh both quantitative and qualitative factors in
deciding which departments should be placed closer
together.
The number of trips that employees make between two
departments is a quantitative measure that can
approximate the cost of having the two departments far
apart.
Hazards such as supplemental oxygen and open flame as
(in a kitchen) are qualitative factors to consider.
11. Chapter 5: Quantitatve Methods in Health Care ManagementYasar A. Ozcan 11
Process Layout Tools:
Method of Closeness Rating
Qualitative factors are easily analyzed in a closeness rating
chart, developed by Richard Muther (1962), named
systematic layout planning (SLP).
The closeness rating chart is essentially a grid that
qualitatively assesses the desired closeness between
departments.
For some departments closeness may be undesirable.
SLP codes denote the desired closeness, according to the
relative strength of the closeness:
A-absolutely necessary
E - very important
I – important
O - ordinary importance
U- unimportant, and
X – undesirable.
12. Chapter 5: Quantitatve Methods in Health Care ManagementYasar A. Ozcan 12
Process Layout Tools
Example 5.1:
A long-term care facility will be constructed with total
available area of 200 * 400 ft., as shown in Figure 5.1
The dimensions of each department and the desired
relationships among the departments are depicted in Figure
5.2. A functional layout with the given parameters is desired.
13. Chapter 5: Quantitatve Methods in Health Care ManagementYasar A. Ozcan 13
Figure 5.1 Available Space for Layout of Long-term Facility
400 ft
200ft
14. Chapter 5: Quantitatve Methods in Health Care ManagementYasar A. Ozcan 14
1. Nurse’s station
2. Ambulance entrance
3. Patient room area
4. Laundry
5. Main entrance
6. Dietary department
A
A
E
Figure 5.2 Closeness Rating Chart for Long-term Care Facility
E
O
E
I
U
U
U
X
X
X
I
I
A absolutely necessary
E very important
I important
O ordinary importance
U unimportant
X undesirable
Area
in feet
Department
40 * 80
80 * 80
40 * 80
40 * 40
40 * 80
Remaining
space
15. Chapter 5: Quantitatve Methods in Health Care ManagementYasar A. Ozcan 15
Process Layout Tools:
A Heuristic Algorithm
A X
1-2 2-5
1-3 4-5
5-6
Identify A and X relationships and determine closeness
based on frequency.
16. Chapter 5: Quantitatve Methods in Health Care ManagementYasar A. Ozcan 16
1. Nurse’s station
2. Ambulance
entrance
3. Patient room area
Figure 5.3 A and X Closeness Representation
40 by 8040 by 40
“A” closeness
“X” undesirable
5. Main
entrance
80 by 80
4. Laundry
6. Dietary department
40 by 40
40 by 40
17. Chapter 5: Quantitatve Methods in Health Care ManagementYasar A. Ozcan 17
1. Nurse’s station
5.Main entrance
3. Patient room area
2. Amb.
entrance
4.Laundry6.Dietary
dept.
Figure 5.4 Layout Solution
18. Chapter 5: Quantitatve Methods in Health Care ManagementYasar A. Ozcan 18
Process Layout Tools:
Method of Minimizing Distances and Costs
If the objective of the layout is to create efficiencies in
functional areas where repetitive processes (nurses
walking on hallways to fetch supplies or delivering care
for patients) occur, then minimizing the costs or
repetitive distances traveled becomes a goal.
Data representing such traffic can be summarized in a
from-to chart.
A from-to chart is generally a table listing the
departments to be considered and the number of trips
(or flow) between them in a given period.
19. Chapter 5: Quantitatve Methods in Health Care ManagementYasar A. Ozcan 19
Exhibit 5.1 From-to-Chart for a Small Hospital
20. Chapter 5: Quantitatve Methods in Health Care ManagementYasar A. Ozcan 20
Process Layout Tools:
Method of Minimizing Distances and Costs
Once flow information is identified, those areas with the most
frequent interaction may be assigned adjacent to each
other, and an initial layout can be generated.
However, there may be many possible assignments. If three
departments are to be assigned three spaces, there are six
possible layouts.
This is calculated by factorial formulation, n!, where n
represents departments. Increasing the number of
departments dramatically increases the number of possible
solutions.
For example, for four departments, 4!, there are 24 possible
assignments.
21. Chapter 5: Quantitatve Methods in Health Care ManagementYasar A. Ozcan 21
Process Layout Tools:
Method of Minimizing Distances and Costs
The objective of the layout is to minimize total cost (TC)
function, and the problem can be specified as:
∑=
ij
TCMinimize jiijij C*W*D
22. Chapter 5: Quantitatve Methods in Health Care ManagementYasar A. Ozcan 22
Process Layout Tools:
Method of Minimizing Distances and Costs
Example 5.2: Consider the departments A, B, and C of a small
hospital. Assume the distance between the locations 1 and
2 to be 100 feet, between 1 and 3 to be 200 feet, and
between 2 and 3 to be 100 feet.
Assign these departments to locations 1, 2 and 3 in a
rectangular space.
23. Chapter 5: Quantitatve Methods in Health Care ManagementYasar A. Ozcan 23
Process Layout Tools:
Method of Minimizing Distances and Costs
Solution:
Assuming that on average a nurse can walk 100 feet in 30
seconds and earns $48.00 per hour including fringe
benefits, what is the total initial cost of initial the layout?
A summary of the information for this problem is shown in
Table 5.1. Since there are 3 departments to be assigned 3
locations, there are 3! = 6 possible assignment
configurations, as shown in table 5.2.
24. Chapter 5: Quantitatve Methods in Health Care ManagementYasar A. Ozcan 24
Process Layout Tools:
Method of Minimizing Distances and Costs
Table 5.1 Distance and Flows among Three Hospital Departments
Distance among locations Flow among departments
From/To Location From/To Department
1 2 3 A B C
1 - 100 200 A - 10 3
2 100 - 100 B 23 - 1
3 200 100 - C 11 1 -
25. Chapter 5: Quantitatve Methods in Health Care ManagementYasar A. Ozcan 25
Process Layout Tools:
Method of Minimizing Distances and Costs
Table 5.2 Possible Assignment Configurations of Departments to Three Locations
Locations
Assignment
Configurations
1 2 3
1 A B C
2 A C B
3 B A C
4 B C A
5 C A B
6 C B A
26. Chapter 5: Quantitatve Methods in Health Care ManagementYasar A. Ozcan 26
Process Layout Tools:
Method of Minimizing Distances and Costs
Table 5.2 Possible Assignment Configurations of Departments to Three Locations
Locations
Assignment
Configurations
1 2 3
1 A B C
2 A C B
3 B A C
4 B C A
5 C A B
6 C B A
27. Chapter 5: Quantitatve Methods in Health Care ManagementYasar A. Ozcan 27
Process Layout Tools:
Method of Minimizing Distances and Costs
Table 5.3 Ranking Departments According to Highest Flow
Trips
between
locations
Distance
in feet
Department
pair
Workflow Total
flow
1-2 100 B-A 23 33
2-1 100 A-B 10
2-3 100 C-A 11 14
3-2 100 A-C 3
1-3 200 C-B 1 2
3-1 200 B-C 1
28. Chapter 5: Quantitatve Methods in Health Care ManagementYasar A. Ozcan 28
Process Layout Tools:
Method of Minimizing Distances and Costs
Table 5.4 Total Cost of a Layout
Department To Flows Location Distance
Distance*Flow
Dij
* Wij
Combined
Dij
* Wij
Total Cost
Dij
* Wij
*Cij
A B
C
10
3
1-2
1-3
100
200
10*100=1000
3*200= 600
1600 1600*.4=$640
B A
C
23
1
2-1
2-3
100
100
23*100=2300
1*100= 100
2400 2400*.4=960
C A
B
11
1
3-1
3-2
200
100
11*200=2200
1*100= 100
2300 2300*.4=920
Total 6,300 $9,520
29. Chapter 5: Quantitatve Methods in Health Care ManagementYasar A. Ozcan 29
Computer Based Layout Programs
ALDEP-- based on closeness ratings
CORELAP-- based on closeness ratings
CRAFT-- based on minimization of flow
(WinQSB use this one)
30. Chapter 5: Quantitatve Methods in Health Care ManagementYasar A. Ozcan 30
Computer Based Layout Programs
The most widely used program in this area is Computerized
Relative Allocation of Facilities Technique (CRAFT)
The two most commonly used distance measures between
departments can be straight line, also called Euclidian
distance or Squared Euclidian; and rectilinear distance,
known as Manhattan distance, which emulates the streets of
Manhattan in New York City.
Manhattan distance means that, to go from one place to
another, one has to travel up or down, right or left through
the streets, rather than crossing to the buildings.
Most real life problems have similar conditions: in order to
go from one department to another, one has to walk through
corridors, take elevators, emulating travel in Manhattan.
Hence, the rectilinear distance measure will be used in our
computerized solutions.
31. Chapter 5: Quantitatve Methods in Health Care ManagementYasar A. Ozcan 31
The item remains stationary, and workers,
materials, and equipment are moved as
needed.
Used to some degree in decentralized
nursing systems; for instance, when all
equipment is taken to the patient
The Fixed Position Layout