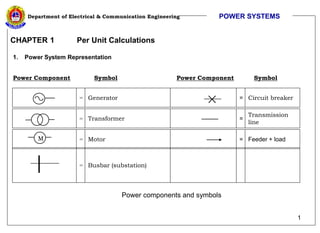
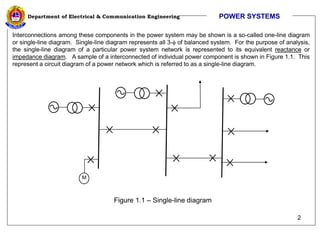
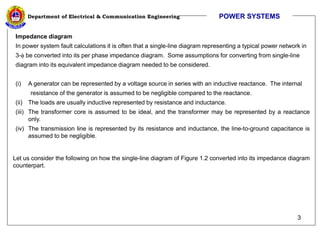
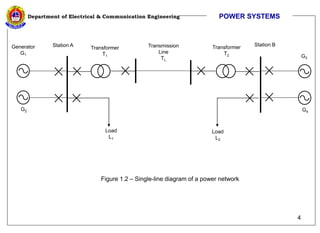
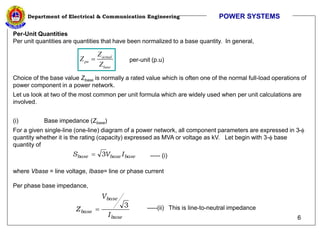
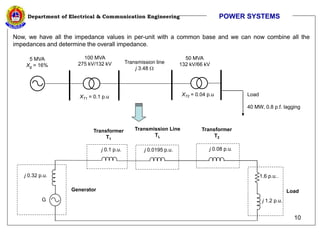
1. 1
Department of Electrical & Communication Engineering
CHAPTER 1 Per Unit Calculations
1. Power System Representation
Power Component Symbol Power Component Symbol
= Generator = Circuit breaker
M
= Transformer =
Transmission
line
= Motor = Feeder + load
= Busbar (substation)
Power components and symbols
POWER SYSTEMS
2. 2
Department of Electrical & Communication Engineering
Interconnections among these components in the power system may be shown is a so-called one-line diagram
or single-line diagram. Single-line diagram represents all 3- of balanced system. For the purpose of analysis,
the single-line diagram of a particular power system network is represented to its equivalent reactance or
impedance diagram. A sample of a interconnected of individual power component is shown in Figure 1.1. This
represent a circuit diagram of a power network which is referred to as a single-line diagram.
M
Figure 1.1 – Single-line diagram
POWER SYSTEMS
3. 3
Department of Electrical & Communication Engineering
Impedance diagram
In power system fault calculations it is often that a single-line diagram representing a typical power network in
3- be converted into its per phase impedance diagram. Some assumptions for converting from single-line
diagram into its equivalent impedance diagram needed to be considered.
(i) A generator can be represented by a voltage source in series with an inductive reactance. The internal
resistance of the generator is assumed to be negligible compared to the reactance.
(ii) The loads are usually inductive represented by resistance and inductance.
(iii) The transformer core is assumed to be ideal, and the transformer may be represented by a reactance
only.
(iv) The transmission line is represented by its resistance and inductance, the line-to-ground capacitance is
assumed to be negligible.
Let us consider the following on how the single-line diagram of Figure 1.2 converted into its impedance diagram
counterpart.
POWER SYSTEMS
4. 4
Department of Electrical & Communication Engineering
Generator
G1
G2
Station A Station B
G3
G4
Load
L1
Load
L2
Transformer
T1
Transmission
Line
TL
Transformer
T2
Figure 1.2 – Single-line diagram of a power network
POWER SYSTEMS
5. 5
Department of Electrical & Communication Engineering
G2
G1
G3 G4
j X1 j X2 j X3 j X4
j XT1 j XT2
RL1
j XL1
RL2
j XL2
RTL
j XTL
Transformer
T1
Transformer
T2
Transmission
Line
TL
Station A Station B
Figure 1.3 – Impedance diagram of Figure 1.2
POWER SYSTEMS
6. 6
Department of Electrical & Communication Engineering
Per-Unit Quantities
Per unit quantities are quantities that have been normalized to a base quantity. In general,
actual
pu
base
Z
Z
Z
per-unit (p.u)
Choice of the base value Zbase is normally a rated value which is often one of the normal full-load operations of
power component in a power network.
Let us look at two of the most common per unit formula which are widely used when per unit calculations are
involved.
(i) Base impedance (Zbase)
For a given single-line (one-line) diagram of a power network, all component parameters are expressed in 3-
quantity whether it is the rating (capacity) expressed as MVA or voltage as kV. Let begin with 3- base
quantity of
base
base
base I
V
S 3
----- (i)
where Vbase = line voltage, Ibase= line or phase current
Per phase base impedance,
base
base
base
I
V
Z
3
-----(ii) This is line-to-neutral impedance
POWER SYSTEMS
7. 7
Department of Electrical & Communication Engineering
Combining (i) and (ii) yields,
base
base
base
base
V
S
V
Z
3
3
base
base
base
MVA
kV
Z
2
where kVbase and MVAbase are 3- qualtities
(ii) Changing base impedance (Znew]
Sometimes the parameters for two elements in the same circuit (network) are quoted in per-unit on a different
base. The changing base impedance is given as,
2
2
base OLD base NEW
NEW OLD
base OLD
base NEW
kV MVA
Z pu Z
MVA
kV
POWER SYSTEMS
8. 8
Department of Electrical & Communication Engineering
Determine the per-unit values of the following single-line diagram and draw the impedance diagram.
Example 1
XT1 = 0.1 p.u
5 MVA
Xg = 16%
100 MVA
275 kV/132 kV
50 MVA
132 kV/66 kV
Transmission line
j 3.48
XT2 = 0.04 p.u Load
40 MW, 0.8 p.f. lagging
Solution:
Chosen base: Always choose the largest rating, therefore Sbase = 100 MVA, V = 66 kV, 132 kV and 275 kV
Per-unit calculations:
Generator G1:
32
.
0
50
100
16
.
0
)
(
pu
X g p.u.
Transformer T1:
1
.
0
)
(
1
pu
XT
p.u.
POWER SYSTEMS
2
2
base OLD base NEW
NEW OLD
base OLD
base NEW
kV MVA
Z pu Z
MVA
kV
9. 9
Department of Electrical & Communication Engineering
Transmission line TL:
0195
.
0
132
100
4
.
3
)
( 2
pu
XTL p.u.
Transformer T2:
08
.
0
50
100
04
.
0
)
(
2
pu
XT p.u.
Inductive load:
o
actual
Z 87
.
36
12
.
87
8
.
0
10
66
3
10
40
3
10
66
3
6
3
p.u.
)
2
.
1
6
.
1
(
87
.
36
2
66
100
87
.
36
12
.
87
)
( 2
j
or
pu
Z o
o
L
POWER SYSTEMS
base
base
base
MVA
kV
Z
2
actual
pu
base
Z
Z
Z
10. 10
Department of Electrical & Communication Engineering
Now, we have all the impedance values in per-unit with a common base and we can now combine all the
impedances and determine the overall impedance.
Load
G
j 0.32 p.u.
j 0.1 p.u. j 0.0195 p.u.
Transformer
T1
Transformer
T2
Transmission Line
TL
j 0.08 p.u.
1.6 p.u..
j 1.2 p.u.
Generator
POWER SYSTEMS
XT1 = 0.1 p.u
5 MVA
Xg = 16%
100 MVA
275 kV/132 kV
50 MVA
132 kV/66 kV
Transmission line
j 3.48
XT2 = 0.04 p.u Load
40 MW, 0.8 p.f. lagging