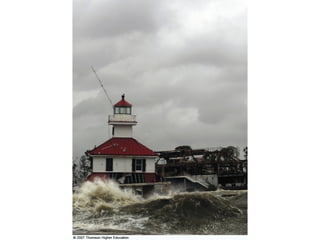
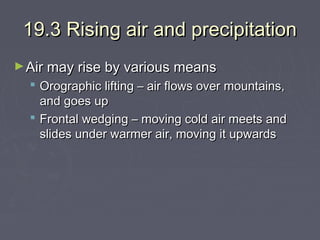
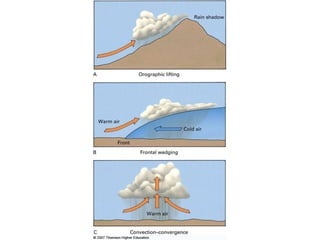
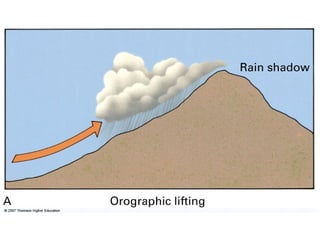
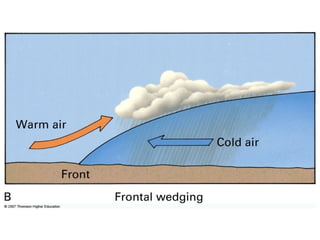
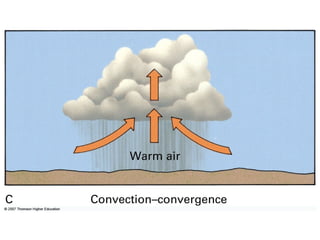
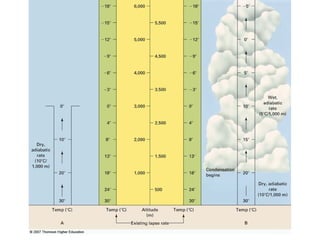
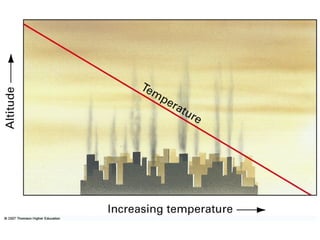
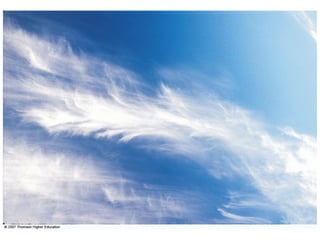
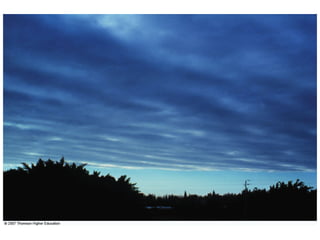
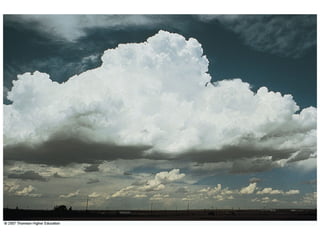
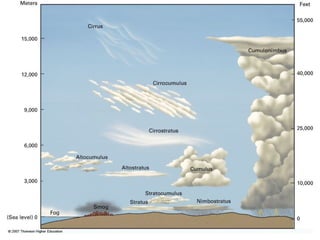
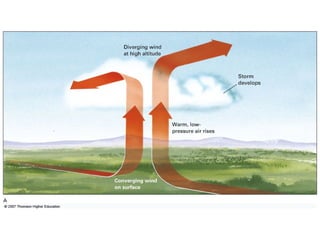
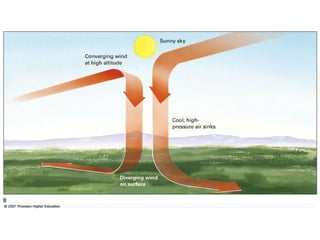
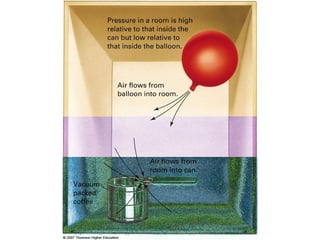
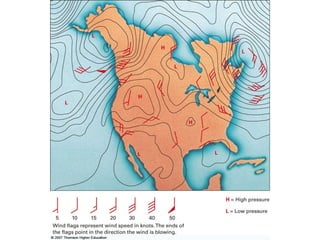
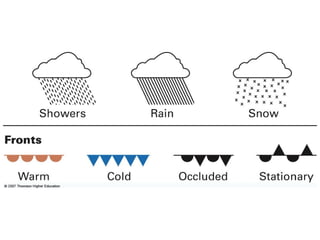
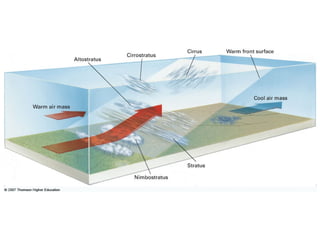
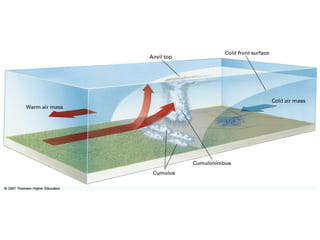
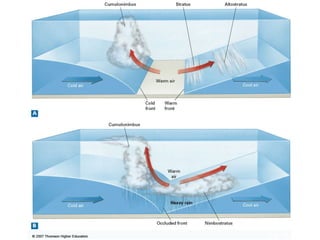
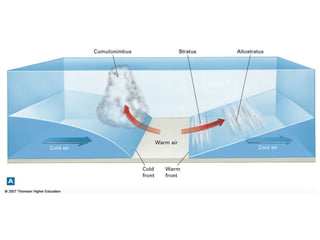
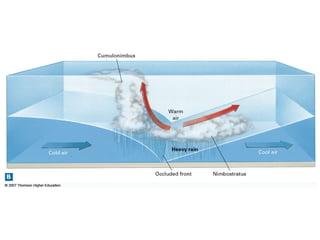
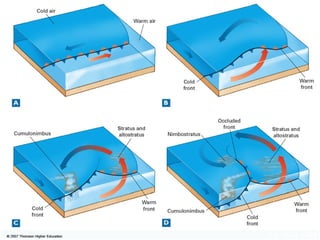
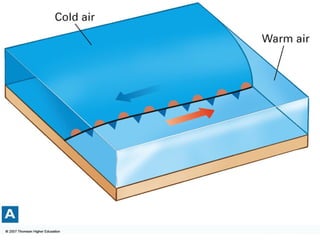
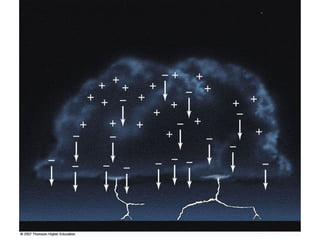
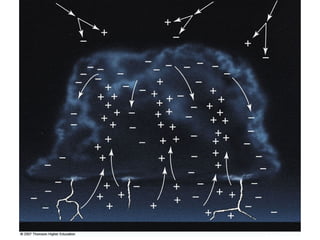
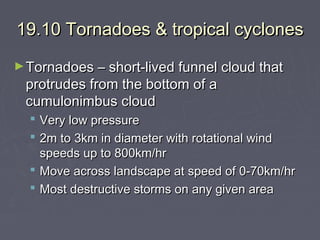
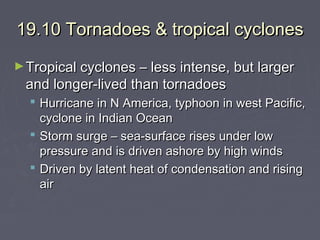
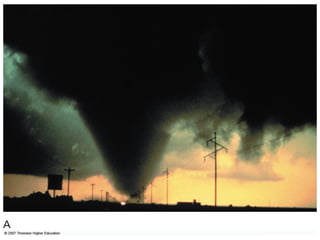
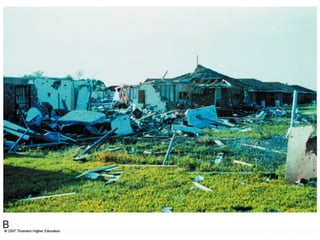
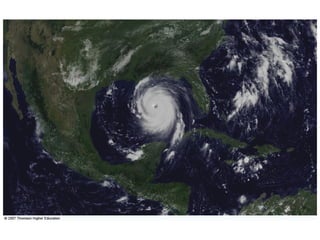
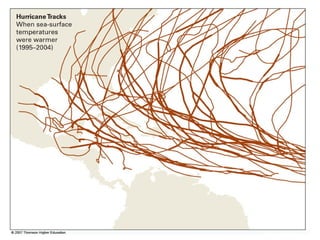
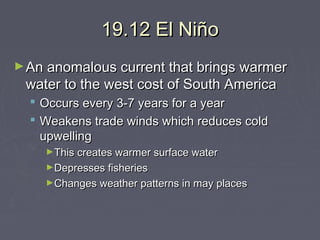
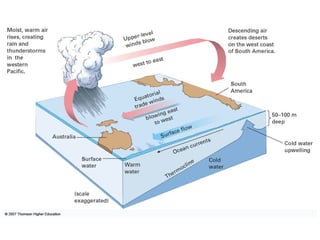
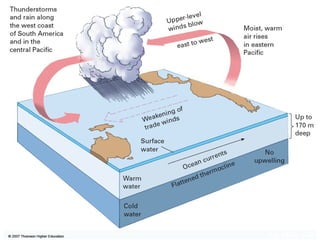
Chapter 19 – Moisture,
Clouds, and Weather
Earth Science and the Environment (4th ed)
Thompson & Turk
19.1 Moisture in air
► Precipitation can only occur when there is

moisture in the air
► Humidity – the amount of water vapor in the
air
 Absolute humidity – mass of water vapor in a
given volume of air
 Relative humidity – amount of water vapor
relative to the amount the air can hold at a given
temperature
19.1 Moisture in air
► Saturation – when the relative humidity

reaches 100%
► Dew point – if saturated air cools below the
point where saturation occurs, moisture will
condense
► Supersaturation – in particulate free air
(high up), the relative humidity can go
above 100%
► Supercooling – water that remains liquid
past its freezing point
19CO, p.470
Fig. 19.1, p.471
19.2 Cooling and condensation
► Radiation cooling – re-emission of heat from

the ground, plants, water, etc.
► Contact cooling – dew and frost

 Dew – condensation cause by moist air
contacting a cooler surface (below its dew point)
 Frost – when that dew point is below freezing,
the condensate is solid ice
19.2 Cooling and condensation
► Cooling of rising air - adiabatic temperature

change

 rising air expands
 expansion requires “work” from the molecules
 Work is a loss of energy – thereby cooling the
air
 Dry adiabatic lapse rate – dry air cools 10oC/km
 Wet adiabatic lapse rate varies, but ranges from
5oC to 9oC/km
19.2 Cooling and condensation
► Sinking air compresses and heats up

 Warm air can hold more moisture, so latent heat
is not released
 The amount of rise being the proper adiabatic
lapse rate
Fig. 19.2, p.472
Fig. 19.3, p.473
Fig. 19.4, p.474
19.3 Rising air and precipitation
► Air may rise by various means

 Orographic lifting – air flows over mountains,
and goes up
 Frontal wedging – moving cold air meets and
slides under warmer air, moving it upwards
19.3 Rising air and precipitation
 Convection/convergence – if a portion of air
becomes warmer it will expand and rise (e.g.: like
over a very warm parch of ground)
 Convection and clouds – air neither rising nor
falling cools at the “normal lapse rate” of 6 oC/km
 Unstable air – warm moist rises quickly, forms
clouds and rains
 Stable air – warm dry air rises, but leads to
neither clouds nor rain
Fig. 19.5, p.474
Fig. 19.5a, p.474
Fig. 19.5b, p.474
Fig. 19.5c, p.474
Fig. 19.6, p.475
p.476a
p.476b
p.477a
p.477b
19.4 Types of clouds
► Different meteorological conditions create

different clouds

 Cirrus – high altitude clouds composed of ice
crystals
 Stratus - low horizontal sheets, often associated
with steady rain
 Cumulus – billowing columns of fluffy white
 Combination names – cumulonimbus,
stratocumulus, nimbostratus (see fig. 19.10)
19.4 Types of clouds
► Types of precipitation

 Rain – forms from coalescence of tiny droplet or
ice crystals
►Most rain starts as ice that melts on the way down

 Snow– if the air temperature is too low, the ice
crystals remain frozen
 Sleet – liquid rain that passes through cold air
 Glaze – very cold rain that strikes freezing
surfaces to form ice in place
 Hail – ice crystals that get several coats
Fig. 19.7, p.477
Fig. 19.8, p.478
Fig. 19.9, p.478
Fig. 19.10, p.478
Fig. 19.11, p.479
Fig. 19.12, p.480
19.5 Fog
► Water droplets forming close to the ground

 Advection fog – warm, moist sea air blows over
cool land
 Radiation fog – air & ground cool at night, as
dew point is reached, fog forms and settles in
low point
 Evaporation fog – air cooling of lake/river vapor
 Upslope fog – air cools as it rises along a land
surface
Fig. 19.13, p.481
19.6 Pressure and wind
► Warm air is less dense than cold air

Warm air exerts a lower pressure than cold air
Wind – movement of air from high to low
pressure areas
 Pressure gradient – the difference between a
high and low pressure area
 Isobars – lines on a weather map that connect
point of equal pressure


19.6 Pressure and wind
► Coriolis effect – deflects both ocean

currents and winds

 Rightward in the northern hemisphere
 Leftward in the southern hemisphere
► Friction – winds due to rising and falling air

at height do not experience surface friction
 Jet stream – the high velocity wind currents
generated at high altitudes
19.6 Pressure and wind
► Cyclone – a low pressure system and its

accompanying surface winds
► Anticyclone – a high pressure system and
its accompanying surface winds
► Pressure change & weather
 Rising air (low pressure) clouds and rain
 Falling air (high pressure) fair and dry
Fig. 19.14, p.482
Fig. 19.14a, p.482
Fig. 19.14b, p.482
Fig. 19.15, p.483
Fig. 19.16, p.483
Fig. 19.17, p.484
Fig. 19.18, p.485
19.7 Fronts and frontal weather
► Front – the boundary between a warm air

mass and a cool one

 Air masses can retain their integrity for days
before mixing
 Fronts may be warm, cold, occluded or
stationary
19.7 Fronts and frontal weather
► Warm front – warm air collides with a

stationary or slow-moving cold air mass
 Warm air rises over the cooler air and cools
adiabatically

► Cold front – fast-moving cold air overtakes

warm air and shoves underneath it, creating
a steep contact
 Warm air rises rapidly making more unstable air
19.7 Fronts and frontal weather
► Occluded front – a faster-moving cold air

mass traps warm air against another cold
air mass
 the two colds meet and lift the warm air up
causing rain

► Stationary front –the boundary of two

stationary air masses

 Often drizzly and foggy
19.7 Fronts and frontal weather
► Mid-latitude cyclones – occur between polar

and tropical air masses

 High temperature difference
 Disturbance in boundary causes a “kink”
 Air twists around the kink falling down large
pressure gradients
 Storm tracks – the generally W to E path of midlatitude cyclones
Fig. 19.19, p.486
Table 19.1, p.486
Fig. 19.20, p.486
Fig. 19.21, p.487
Fig. 19.22, p.487
Fig. 19.23, p.488
Fig. 19.23a, p.488
Fig. 19.23b, p.488
Fig. 19.24, p.489
Fig. 19.24a, p.489
Fig. 19.24b, p.489
Fig. 19.24c, p.489
Fig. 19.24d, p.489
Fig. 19.25, p.489
19.8 How Earths’ surface
affect weather

features

► Mountain ranges and rain-shadow deserts




Orographic winds rain out adiabatically
Falling down the leeward side they heat, but are
dry, causing arid lands

► Sea and land breezes – due to uneven

heating/cooling of land and water
► Monsoons – heavy rains due to uneven
heating of ocean and continents
Fig. 19.26, p.490
Fig. 19.27, p.491
19.9 Thunderstorms
► Caused by rising warm, moist air

 Wind convergence – i.e.: FL where land heating
draws moist air from both ocean sides
 Convection – rising moist air over continental
interiors
 Orographic lifting – warm, moist air lifting over
hills or mountains
 Frontal thunderstorms – along frontal
boundaries, usually cold fronts
19.9 Thunderstorms
► Lightning – discharge of static electricity

built up in clouds, but how and why?

 Static between winds and ice crystals in
cumulonimbus clouds
►Positive high up, negative down low

 Cosmic rays hit cloud tops producing ions
►Other ions occur by wind friction along the ground

 In either case, when charge differential is large
enough – it discharges
Fig. 19.28, p.492
Fig. 19.29, p.492
Fig. 19.30, p.493
Fig. 19.30a, p.493
Fig. 19.30b, p.493
19.10 Tornadoes & tropical cyclones
► Tornadoes – short-lived funnel cloud that

protrudes from the bottom of a
cumulonimbus cloud

 Very low pressure
 2m to 3km in diameter with rotational wind
speeds up to 800km/hr
 Move across landscape at speed of 0-70km/hr
 Most destructive storms on any given area
19.10 Tornadoes & tropical cyclones
► Tropical cyclones – less intense, but larger

and longer-lived than tornadoes

 Hurricane in N America, typhoon in west Pacific,
cyclone in Indian Ocean
 Storm surge – sea-surface rises under low
pressure and is driven ashore by high winds
 Driven by latent heat of condensation and rising
air
Fig. 19.31a, p.493
Fig. 19.31b, p.493
Table 19.2, p.493
Fig. 19.32, p.495
Fig. 19.33, p.495
Table 19.3, p.496
19.11 Hurricane Katrina
► Formed 8/23/2005 – passed over FL as a

Category 1
► Grew to a category 5 in Gulf of Mexico
► Made landfall as a 3-4
► 8.5m storm surge inundated New Orleans
and the MI coast
► Death toll between 1,300 and 4,000
19.11 Hurricane Katrina
► Gulf coast and hurricanes





Long history of tropical storms
10 deadliest storms – before 1955
10 costliest – after 1955, more than half after
1989
►More people live on coasts now – property damage
►Earlier warning – people get out of the way more

efficiently

 So why was Katrina so devastating?
19.11 Hurricane Katrina
► Barrier islands, costal wetlands, delta lands,

all absorb a storm’s energy

 Over the past century, 1/3 of the coastal
wetlands has disappeared
 Human activity has reduced sediment flow to
the delta (chap 11)
 The delta is massive enough to depress the
crust – less sediment leads to net subsidence
 Canals have killed plants with salt water
19.11 Hurricane Katrina
► Levee failure – portions of the levee system

were built atop peat soils

 Peat is weak and transmits water readily
 Lead to catastrophic failure
►Add in that much of the city is below sea level

 2005 had a record number of tropical storms
and hurricanes
►A portent of things to come?
Fig. 19.34a, p.496
Fig. 19.34b, p.496
Table 19.4a, p.497
Table 19.4a, p.497
Fig. 19.35, p.498
Fig. 19.36, p.498
Fig. 19.37, p.499
Fig. 19.38a, p.500
Fig. 19.38b, p.500
19.12 El Niño
► An anomalous current that brings warmer

water to the west cost of South America
 Occurs every 3-7 years for a year
 Weakens trade winds which reduces cold
upwelling
►This creates warmer surface water
►Depresses fisheries
►Changes weather patterns in may places
Fig. 19.39, p.501
Fig. 19.40, p.502
p.503

Chapter19(2)

  • 1.
    Chapter 19 –Moisture, Clouds, and Weather Earth Science and the Environment (4th ed) Thompson & Turk
  • 2.
    19.1 Moisture inair ► Precipitation can only occur when there is moisture in the air ► Humidity – the amount of water vapor in the air  Absolute humidity – mass of water vapor in a given volume of air  Relative humidity – amount of water vapor relative to the amount the air can hold at a given temperature
  • 3.
    19.1 Moisture inair ► Saturation – when the relative humidity reaches 100% ► Dew point – if saturated air cools below the point where saturation occurs, moisture will condense ► Supersaturation – in particulate free air (high up), the relative humidity can go above 100% ► Supercooling – water that remains liquid past its freezing point
  • 4.
  • 5.
  • 6.
    19.2 Cooling andcondensation ► Radiation cooling – re-emission of heat from the ground, plants, water, etc. ► Contact cooling – dew and frost  Dew – condensation cause by moist air contacting a cooler surface (below its dew point)  Frost – when that dew point is below freezing, the condensate is solid ice
  • 7.
    19.2 Cooling andcondensation ► Cooling of rising air - adiabatic temperature change  rising air expands  expansion requires “work” from the molecules  Work is a loss of energy – thereby cooling the air  Dry adiabatic lapse rate – dry air cools 10oC/km  Wet adiabatic lapse rate varies, but ranges from 5oC to 9oC/km
  • 8.
    19.2 Cooling andcondensation ► Sinking air compresses and heats up  Warm air can hold more moisture, so latent heat is not released  The amount of rise being the proper adiabatic lapse rate
  • 9.
  • 10.
  • 11.
  • 12.
    19.3 Rising airand precipitation ► Air may rise by various means  Orographic lifting – air flows over mountains, and goes up  Frontal wedging – moving cold air meets and slides under warmer air, moving it upwards
  • 13.
    19.3 Rising airand precipitation  Convection/convergence – if a portion of air becomes warmer it will expand and rise (e.g.: like over a very warm parch of ground)  Convection and clouds – air neither rising nor falling cools at the “normal lapse rate” of 6 oC/km  Unstable air – warm moist rises quickly, forms clouds and rains  Stable air – warm dry air rises, but leads to neither clouds nor rain
  • 14.
  • 15.
  • 16.
  • 17.
  • 18.
  • 19.
  • 20.
  • 21.
  • 22.
  • 23.
    19.4 Types ofclouds ► Different meteorological conditions create different clouds  Cirrus – high altitude clouds composed of ice crystals  Stratus - low horizontal sheets, often associated with steady rain  Cumulus – billowing columns of fluffy white  Combination names – cumulonimbus, stratocumulus, nimbostratus (see fig. 19.10)
  • 24.
    19.4 Types ofclouds ► Types of precipitation  Rain – forms from coalescence of tiny droplet or ice crystals ►Most rain starts as ice that melts on the way down  Snow– if the air temperature is too low, the ice crystals remain frozen  Sleet – liquid rain that passes through cold air  Glaze – very cold rain that strikes freezing surfaces to form ice in place  Hail – ice crystals that get several coats
  • 25.
  • 26.
  • 27.
  • 28.
  • 29.
  • 30.
  • 31.
    19.5 Fog ► Waterdroplets forming close to the ground  Advection fog – warm, moist sea air blows over cool land  Radiation fog – air & ground cool at night, as dew point is reached, fog forms and settles in low point  Evaporation fog – air cooling of lake/river vapor  Upslope fog – air cools as it rises along a land surface
  • 32.
  • 33.
    19.6 Pressure andwind ► Warm air is less dense than cold air Warm air exerts a lower pressure than cold air Wind – movement of air from high to low pressure areas  Pressure gradient – the difference between a high and low pressure area  Isobars – lines on a weather map that connect point of equal pressure  
  • 34.
    19.6 Pressure andwind ► Coriolis effect – deflects both ocean currents and winds  Rightward in the northern hemisphere  Leftward in the southern hemisphere ► Friction – winds due to rising and falling air at height do not experience surface friction  Jet stream – the high velocity wind currents generated at high altitudes
  • 35.
    19.6 Pressure andwind ► Cyclone – a low pressure system and its accompanying surface winds ► Anticyclone – a high pressure system and its accompanying surface winds ► Pressure change & weather  Rising air (low pressure) clouds and rain  Falling air (high pressure) fair and dry
  • 36.
  • 37.
  • 38.
  • 39.
  • 40.
  • 41.
  • 42.
  • 43.
    19.7 Fronts andfrontal weather ► Front – the boundary between a warm air mass and a cool one  Air masses can retain their integrity for days before mixing  Fronts may be warm, cold, occluded or stationary
  • 44.
    19.7 Fronts andfrontal weather ► Warm front – warm air collides with a stationary or slow-moving cold air mass  Warm air rises over the cooler air and cools adiabatically ► Cold front – fast-moving cold air overtakes warm air and shoves underneath it, creating a steep contact  Warm air rises rapidly making more unstable air
  • 45.
    19.7 Fronts andfrontal weather ► Occluded front – a faster-moving cold air mass traps warm air against another cold air mass  the two colds meet and lift the warm air up causing rain ► Stationary front –the boundary of two stationary air masses  Often drizzly and foggy
  • 46.
    19.7 Fronts andfrontal weather ► Mid-latitude cyclones – occur between polar and tropical air masses  High temperature difference  Disturbance in boundary causes a “kink”  Air twists around the kink falling down large pressure gradients  Storm tracks – the generally W to E path of midlatitude cyclones
  • 47.
  • 48.
  • 49.
  • 50.
  • 51.
  • 52.
  • 53.
  • 54.
  • 55.
  • 56.
  • 57.
  • 58.
  • 59.
  • 60.
  • 61.
    19.8 How Earths’surface affect weather features ► Mountain ranges and rain-shadow deserts   Orographic winds rain out adiabatically Falling down the leeward side they heat, but are dry, causing arid lands ► Sea and land breezes – due to uneven heating/cooling of land and water ► Monsoons – heavy rains due to uneven heating of ocean and continents
  • 62.
  • 63.
  • 64.
    19.9 Thunderstorms ► Causedby rising warm, moist air  Wind convergence – i.e.: FL where land heating draws moist air from both ocean sides  Convection – rising moist air over continental interiors  Orographic lifting – warm, moist air lifting over hills or mountains  Frontal thunderstorms – along frontal boundaries, usually cold fronts
  • 65.
    19.9 Thunderstorms ► Lightning– discharge of static electricity built up in clouds, but how and why?  Static between winds and ice crystals in cumulonimbus clouds ►Positive high up, negative down low  Cosmic rays hit cloud tops producing ions ►Other ions occur by wind friction along the ground  In either case, when charge differential is large enough – it discharges
  • 66.
  • 67.
  • 68.
  • 69.
  • 70.
  • 71.
    19.10 Tornadoes &tropical cyclones ► Tornadoes – short-lived funnel cloud that protrudes from the bottom of a cumulonimbus cloud  Very low pressure  2m to 3km in diameter with rotational wind speeds up to 800km/hr  Move across landscape at speed of 0-70km/hr  Most destructive storms on any given area
  • 72.
    19.10 Tornadoes &tropical cyclones ► Tropical cyclones – less intense, but larger and longer-lived than tornadoes  Hurricane in N America, typhoon in west Pacific, cyclone in Indian Ocean  Storm surge – sea-surface rises under low pressure and is driven ashore by high winds  Driven by latent heat of condensation and rising air
  • 73.
  • 74.
  • 75.
  • 76.
  • 77.
  • 78.
  • 79.
    19.11 Hurricane Katrina ►Formed 8/23/2005 – passed over FL as a Category 1 ► Grew to a category 5 in Gulf of Mexico ► Made landfall as a 3-4 ► 8.5m storm surge inundated New Orleans and the MI coast ► Death toll between 1,300 and 4,000
  • 80.
    19.11 Hurricane Katrina ►Gulf coast and hurricanes    Long history of tropical storms 10 deadliest storms – before 1955 10 costliest – after 1955, more than half after 1989 ►More people live on coasts now – property damage ►Earlier warning – people get out of the way more efficiently  So why was Katrina so devastating?
  • 81.
    19.11 Hurricane Katrina ►Barrier islands, costal wetlands, delta lands, all absorb a storm’s energy  Over the past century, 1/3 of the coastal wetlands has disappeared  Human activity has reduced sediment flow to the delta (chap 11)  The delta is massive enough to depress the crust – less sediment leads to net subsidence  Canals have killed plants with salt water
  • 82.
    19.11 Hurricane Katrina ►Levee failure – portions of the levee system were built atop peat soils  Peat is weak and transmits water readily  Lead to catastrophic failure ►Add in that much of the city is below sea level  2005 had a record number of tropical storms and hurricanes ►A portent of things to come?
  • 83.
  • 84.
  • 85.
  • 86.
  • 87.
  • 88.
  • 89.
  • 90.
  • 91.
  • 92.
    19.12 El Niño ►An anomalous current that brings warmer water to the west cost of South America  Occurs every 3-7 years for a year  Weakens trade winds which reduces cold upwelling ►This creates warmer surface water ►Depresses fisheries ►Changes weather patterns in may places
  • 93.
  • 94.
  • 95.

Editor's Notes

  • #5 This lighthouse on the shore of Lake Pontchartrain, Louisiana, was heavily damaged by Hurricane Katrina. Shortly thereafter, in this photo, it is threatened by the rising tide and storm surge of Hurricane Rita, Friday, Sept. 23, 2005.
  • #6 ACTIVE FIGURE 19.1 Warm air can hold more water vapor than cold air can.
  • #10 FIGURE 19.2 Ice crystals condense on a window on a frosty morning.
  • #11 FIGURE 19.3 Most clouds form as rising air cools.The cooling causes invisible water vapor to condense as visible water droplets, or ice crystals, which we see as a cloud.
  • #12 FIGURE 19.4 A rising air mass initially cools rapidly at the dry adiabatic lapse rate.Then, after condensation begins, it cools more slowly at the wet adiabatic lapse rate.
  • #15 FIGURE 19.5 Three mechanisms cause air to rise and cool: (A) orographic lifting, (B) frontal wedging, and (C) Convection–convergence.
  • #16 FIGURE 19.5 Three mechanisms cause air to rise and cool: (A) orographic lifting,
  • #17 FIGURE 19.5 Three mechanisms cause air to rise and cool: (B) frontal wedging,
  • #18 FIGURE 19.5 Three mechanisms cause air to rise and cool: (C) Convection–convergence.
  • #19 FIGURE 19.6 (A) As dry air rises, it expands and cools at the dry, adiabatic lapse rate.Thus, it soon cools to the temperature of the surrounding air, and it stops rising. (B) As moist air rises, initially it cools at the dry, adiabatic lapse rate. It soon cools to its dew point, and clouds form.Then, it cools more slowly at the wet, adiabatic lapse rate.As a result, it remains warmer than surrounding air and continues to rise for thousands of meters. It stops rising when all moisture has condensed, and the air again cools at its dry, adiabatic rate.
  • #20 FIGURE 1 (A, B) In a normal atmosphere, where the temperature decreases steadily with altitude,warm, polluted air from a smokestack rises to mix with cooler air at higher altitudes.Thus the pollutants disperse.
  • #21 FIGURE 1 (A, B) In a normal atmosphere, where the temperature decreases steadily with altitude,warm, polluted air from a smokestack rises to mix with cooler air at higher altitudes.Thus the pollutants disperse.
  • #22 FIGURE 2 (A, B) During an inversion, when warm air lies on top of cooler air near the ground, warm, polluted air from a smokestack cannot rise above the inversion layer. In this photograph, taken in the Gdansk Shipyards in Poland, an early morning inversion layer concentrates clouds, steam, and pollutants close to the ground.
  • #23 FIGURE 2 (A, B) During an inversion, when warm air lies on top of cooler air near the ground, warm, polluted air from a smokestack cannot rise above the inversion layer. In this photograph, taken in the Gdansk Shipyards in Poland, an early morning inversion layer concentrates clouds, steam, and pollutants close to the ground.
  • #26 FIGURE 19.7 Cirrus clouds are high, wispy clouds composed of ice crystals.
  • #27 FIGURE 19.8 Stratus clouds spread out across the sky in a low, flat layer.
  • #28 FIGURE 19.9 Cumulus clouds are fluffy white clouds with flat bottoms.
  • #29 FIGURE 19.10 Cloud names are based on the shape and altitude of the clouds.
  • #30 FIGURE 19.11 Snow blankets the ground during the winter in temperate regions. Snow and ice cover the ground year-round in the high mountains and at the Poles.
  • #31 FIGURE 19.12 Glaze forms when rain falls on a surface that is colder than the freezing temperature of water.
  • #33 FIGURE 19.13 Radiation fog is seen as a morning mist in this field in Idaho.
  • #37 FIGURE 19.14 (A) Rising, low-pressure air creates clouds and precipitation.Air flows inward toward the low-pressure zone, creating surface winds. (B) Sinking, high-pressure air creates clear skies.Air flows outward from the high-pressure zone and also creates surface winds.
  • #38 FIGURE 19.14 (A) Rising, low-pressure air creates clouds and precipitation.Air flows inward toward the low-pressure zone, creating surface winds.
  • #39 FIGURE 19.14 (B) Sinking, high-pressure air creates clear skies. Air flows outward from the high-pressure zone and also creates surface winds.
  • #40 FIGURE 19.15 Winds blow in response to differences in pressure.
  • #41 FIGURE 19.16 Pressure map and winds at 5,000 feet in North America on February 3, 1992. High-altitude data are shown because the winds are not affected by surface topography and thus the effect of pressure gradient is well illustrated. Note that in the Northeast and Northwest, steep pressure gradients, shown by closely spaced isobars, cause high winds that spiral counterclockwise into the low-pressure zones.Widely spaced isobars around high-pressure zones in the central United States cause weaker winds.
  • #42 FIGURE 19.17 The Coriolis effect deflects winds to the right in the Northern Hemisphere and to the left in the Southern Hemisphere. Only winds blowing due east or west are unaffected.
  • #43 FIGURE 19.18 (A) In the Northern Hemisphere, a cyclone consists of winds spiraling counterclockwise into a low-pressure region. (B) An anticyclone consists of winds spiraling clockwise out from a high-pressure zone.
  • #48 FIGURE 19.19 Air masses are classified by their source regions.
  • #50 FIGURE 19.20 Symbols commonly used in weather maps. Warm and cold are relative terms. Air over the central plains of Montana at a temperature of 0˚C may be warm relative to polar air above northern Canada but cold relative to a 20˚C air mass over the southeastern United States.
  • #51 ACTIVE FIGURE 19.21 In a warm front, moving warm air rises gradually over cold air.
  • #52 ACTIVE FIGURE 19.22 In a cold front, moving cold air slides abruptly beneath warm air, forcing it steeply upward.
  • #53 ACTIVE FIGURE 19.23 An occluded front forms where warm air is trapped and lifted between two, cold air masses.
  • #54 ACTIVE FIGURE 19.23 An occluded front forms where warm air is trapped and lifted between two, cold air masses.
  • #55 ACTIVE FIGURE 19.23 An occluded front forms where warm air is trapped and lifted between two, cold air masses.
  • #56 ACTIVE FIGURE 19.24 A midlatitude cyclone develops along a front between polar air and a tropical air mass. (A) A front develops. (B) Some small disturbance creates a kink in the front. (C) A low-pressure region and cyclonic circulation develop. (D) An occluded front forms.
  • #57 ACTIVE FIGURE 19.24 A midlatitude cyclone develops along a front between polar air and a tropical air mass. (A) A front develops.
  • #58 ACTIVE FIGURE 19.24 A midlatitude cyclone develops along a front between polar air and a tropical air mass. (B) Some small disturbance creates a kink in the front.
  • #59 ACTIVE FIGURE 19.24 A midlatitude cyclone develops along a front between polar air and a tropical air mass. (C) A low-pressure region and cyclonic circulation develop.
  • #60 ACTIVE FIGURE 19.24 (D) An occluded front forms.
  • #61 FIGURE 19.25 Most North American cyclones follow certain paths, called storm tracks, from west to east.
  • #63 ACTIVE FIGURE 19.26 A rain-shadow desert forms where moist air rises over a mountain range and precipitates most of its moisture on the windward side and crest of the range.The dry, descending air on the lee side absorbs moisture, forming a desert.
  • #64 FIGURE 19.27 (A) Sea breezes blow inland during the day, and (B) land breezes blow out to sea at night.
  • #67 ACTIVE FIGURE 19.28 A typical thunderstorm develops in three stages. (A) Air rises, cools, and condenses, creating a cumulus cloud. (B) Latent heat of condensation energizes the storm, forming heavy rain and violent wind. (C) The cloud cools, convection weakens, and the storm wanes.
  • #68 FIGURE 19.29 Time-lapse photo captures multiple ground-to-ground lightning strikes during a nighttime thunderstorm in Norman, Oklahoma, March 1978.
  • #69 ACTIVE FIGURE 19.30 Two hypotheses for the origin of lightning. (A) Friction between intense winds and ice particles generates charge separation. (B) Charged particles are produced from above by cosmic rays and below by interactions with the ground.The particles are then distributed by convection currents.
  • #70 ACTIVE FIGURE 19.30 Two hypotheses for the origin of lightning. (A) Friction between intense winds and ice particles generates charge separation.
  • #71 ACTIVE FIGURE 19.30 Two hypotheses for the origin of lightning. (B) Charged particles are produced from above by cosmic rays and below by interactions with the ground.The particles are then distributed by convection currents.
  • #74 FIGURE 19.31 (A) The dark funnel cloud of a tornado descends on Dimmit,Texas, on June 2, 1995.
  • #75 FIGURE 19.31 (B) Tornadoes that accompanied Hurricane Andrew added to the terror and confusion at La Place, Louisiana, where two people died and many homes were destroyed.
  • #77 FIGURE 19.32 Hurricane Katrina making landfall near New Orleans on August 28, 2005.
  • #78 ACTIVE FIGURE 19.33 Surface air spirals inward toward a hurricane, rises through the towering wall of clouds, and then flows outward above the storm. Falling air near the storm’s center creates the eerie calm in the eye of the hurricane.
  • #84 FIGURE 19.34 (A) A Hurricane Katrina flood victim lies on a road in New Orleans La., Sept. 8, 2005. Katrina was the most costly and one of the deadliest natural disasters in U.S. history, as an 8.5-meter storm surge inundated 233,000 square kilometers of the New Orleans and Mississippi coastlines.
  • #85 FIGURE 19.34 (B) The partly destroyed roof of the Lousiana Superdome in downtown New Orleans is a massive reminder of the tragedies suffered during Hurricane Katrina.
  • #88 FIGURE 19.35 Large parts of New Orleans are protected by levees because they lie below sea level, below Lake Pontchartrain, and below the level of the Mississippi River.When the levees fail, these portions of the city suffer flooding as they did during Hurricane Katrina.
  • #89 FIGURE 19.36 Between 1900 and 2005, about one-third of the wetlands in the Mississippi delta have been lost (lost wetlands are shown in blue) to erosion, subsidence, and dredging of channels.
  • #90 FIGURE 19.37 Many of the levees in New Orleans failed because foundations were faulty and anchored in weak layers of peat.
  • #91 FIGURE 19.38 (A) Storm tracks 1985 to 1994
  • #92 FIGURE 19.38 (B) Storm tracks 1995 to 2004.
  • #94 FIGURE 19.39 In a normal year, trade winds drag warm surface water westward across the Pacific and pile it up in a low mound near Indonesia and Australia, where the warm water causes rain.The surface flow creates upwelling of cold, deep, nutrient-rich waters along the coast of South America.
  • #95 FIGURE 19.40 In an El Niño year, the trade winds slacken and the warm water flows eastward toward South America, causing the storms and rain to move over South America, and diminishing the upwelling currents.