Download as PDF, PPTX
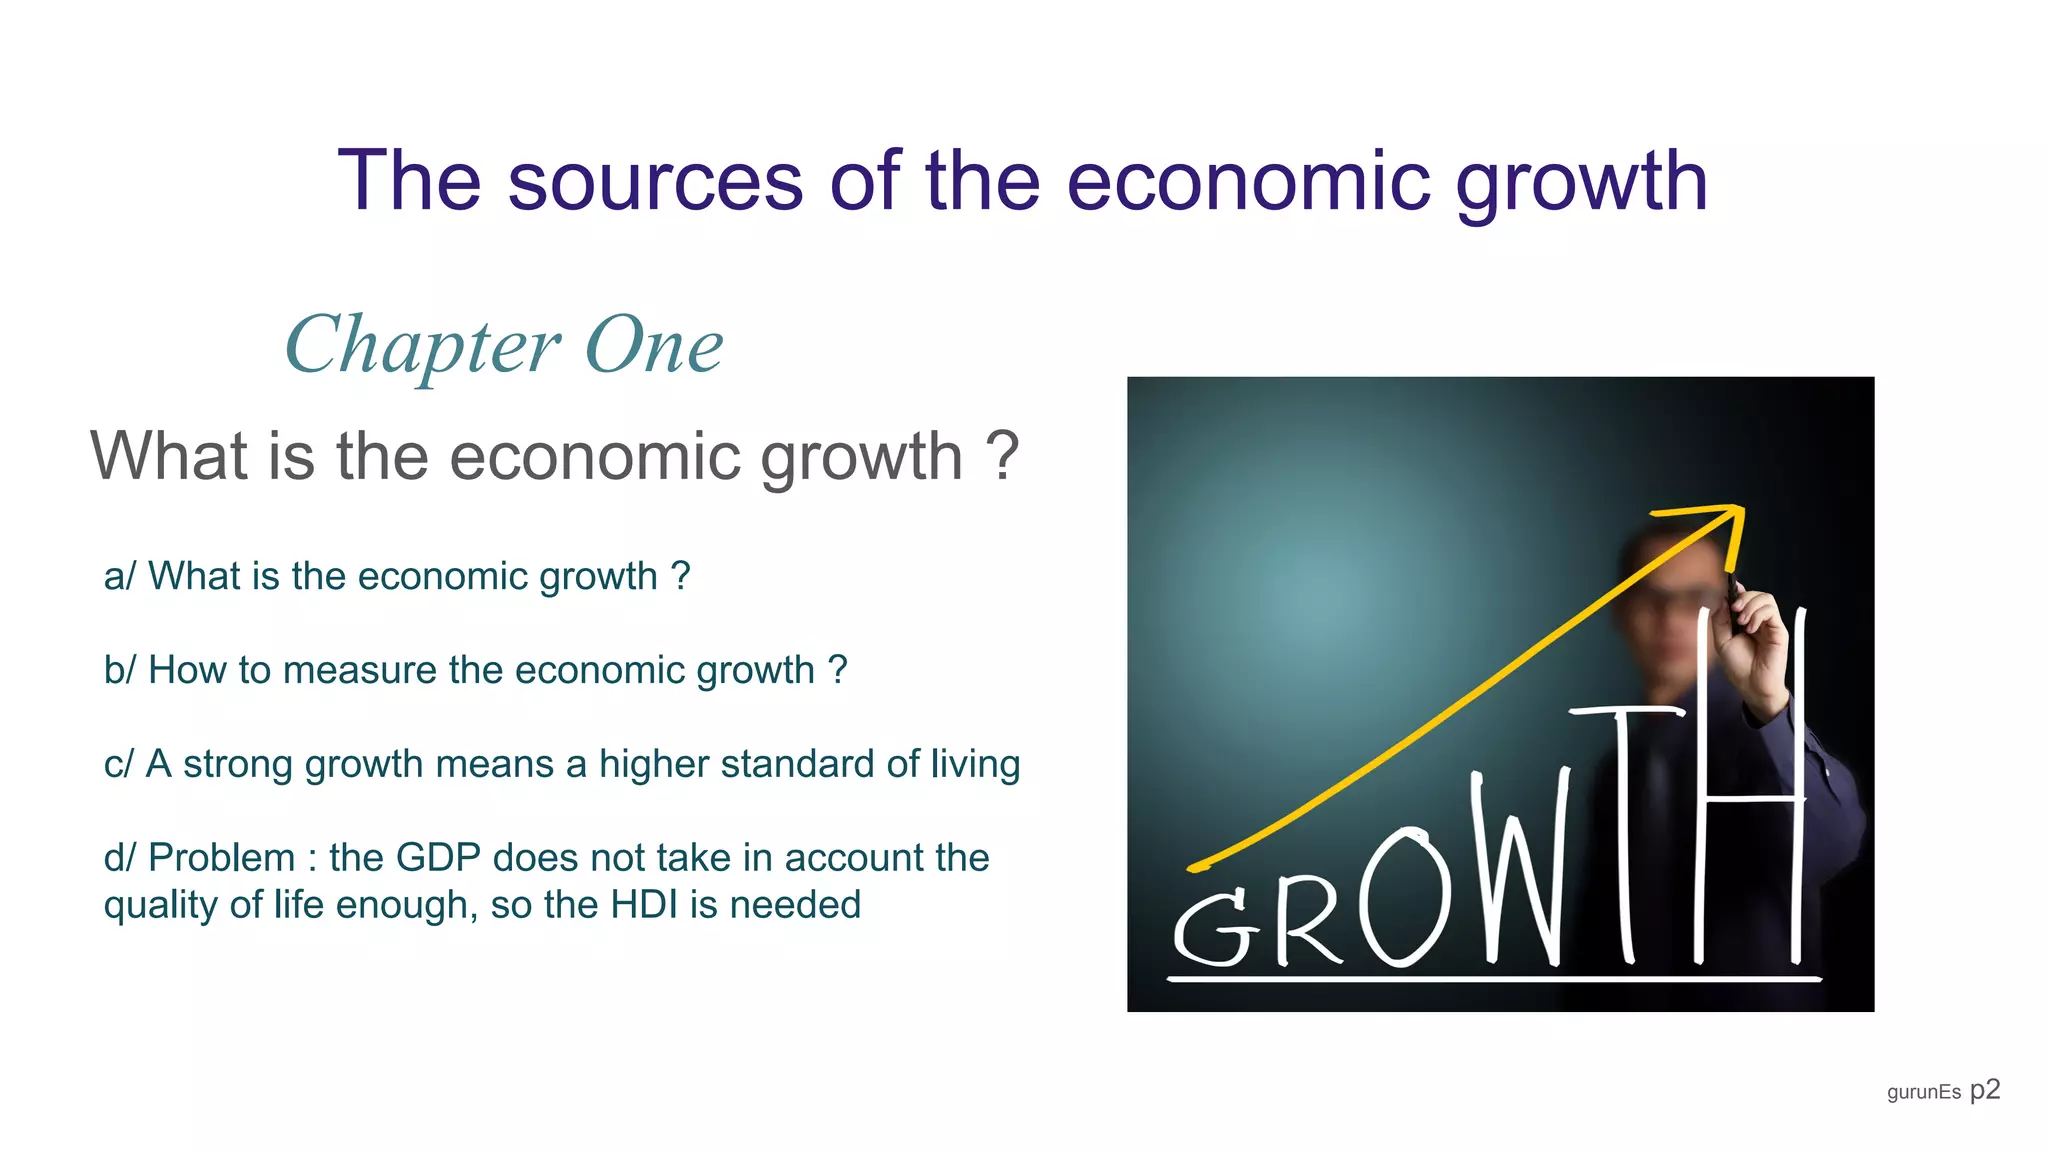
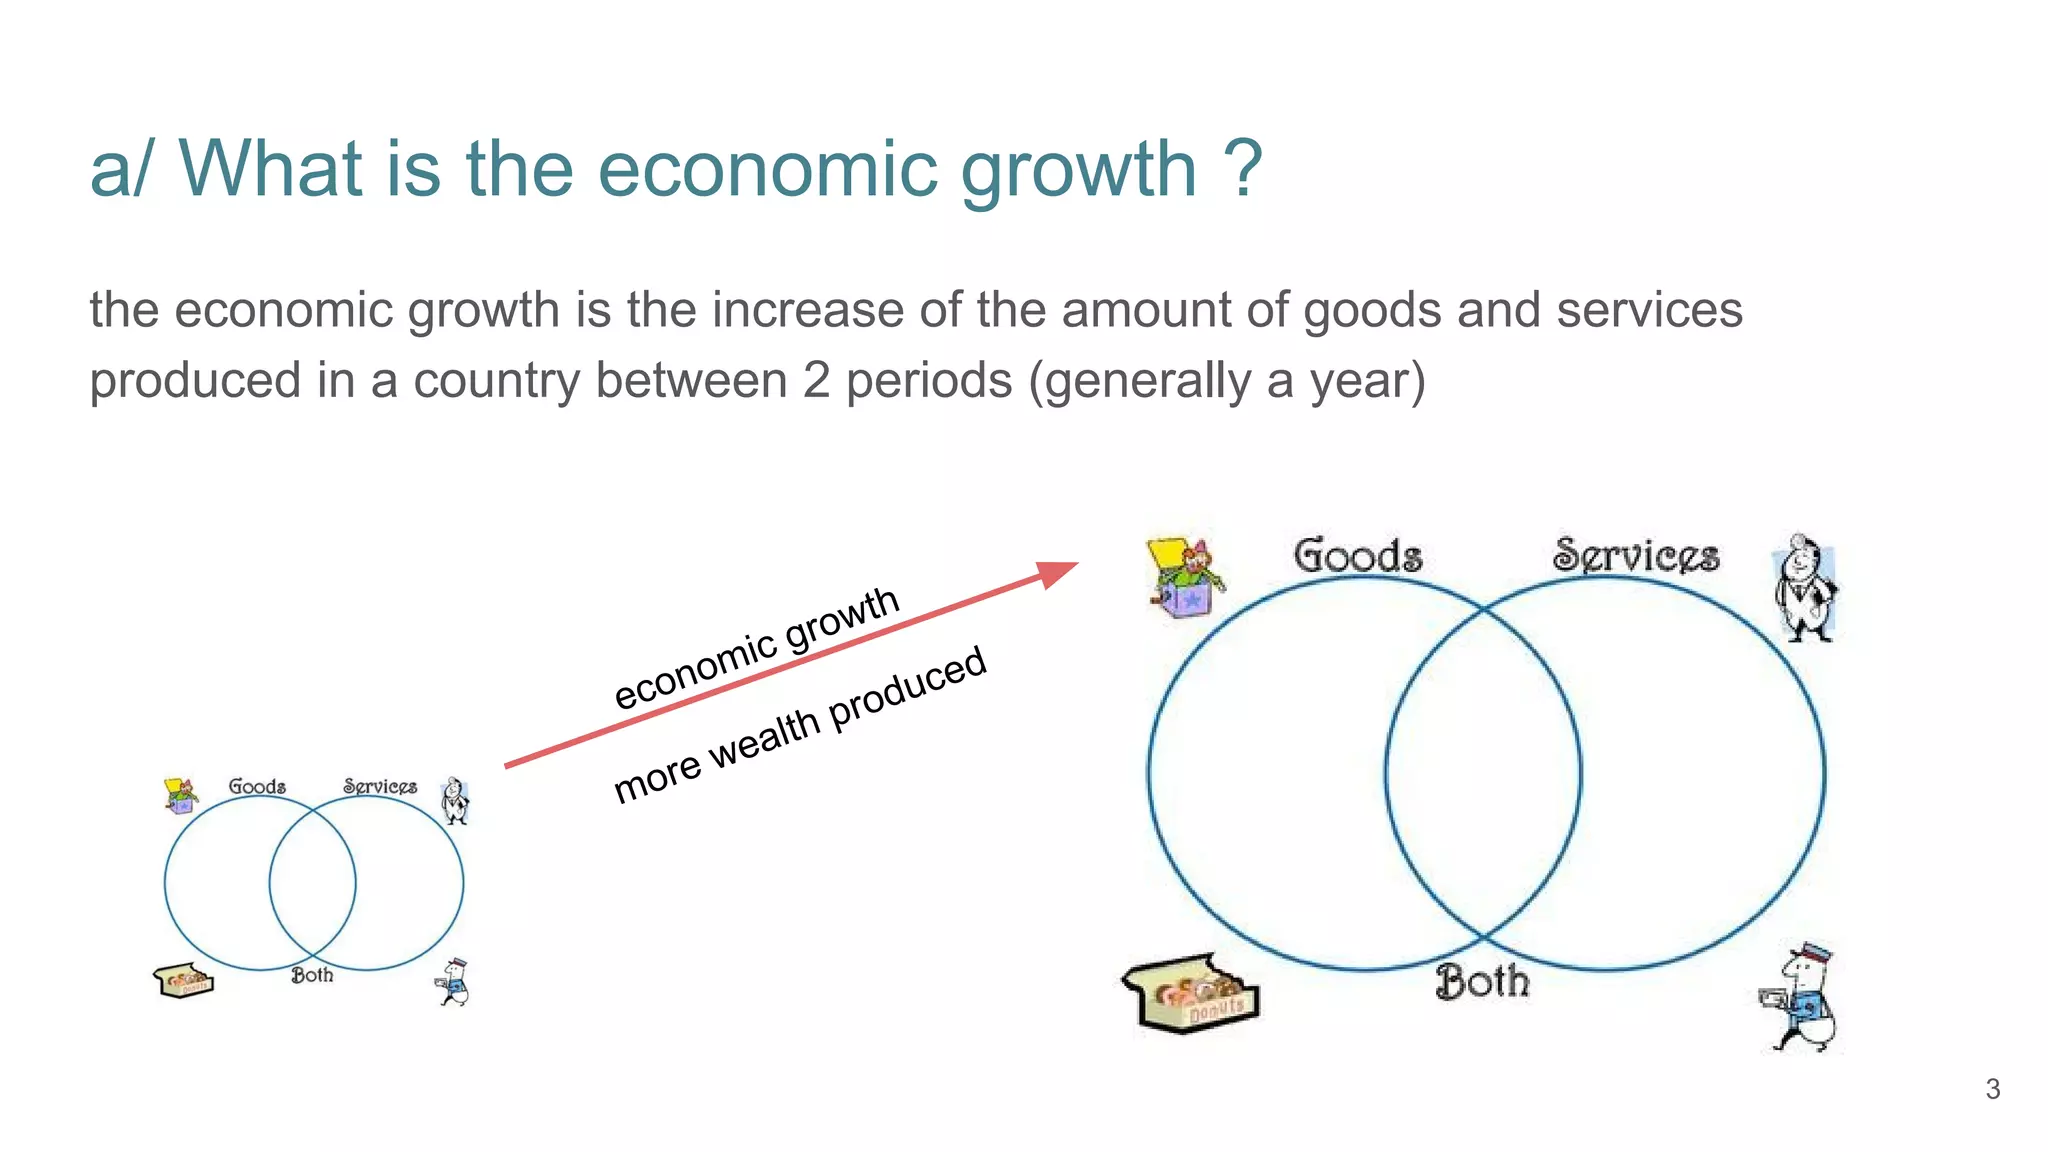
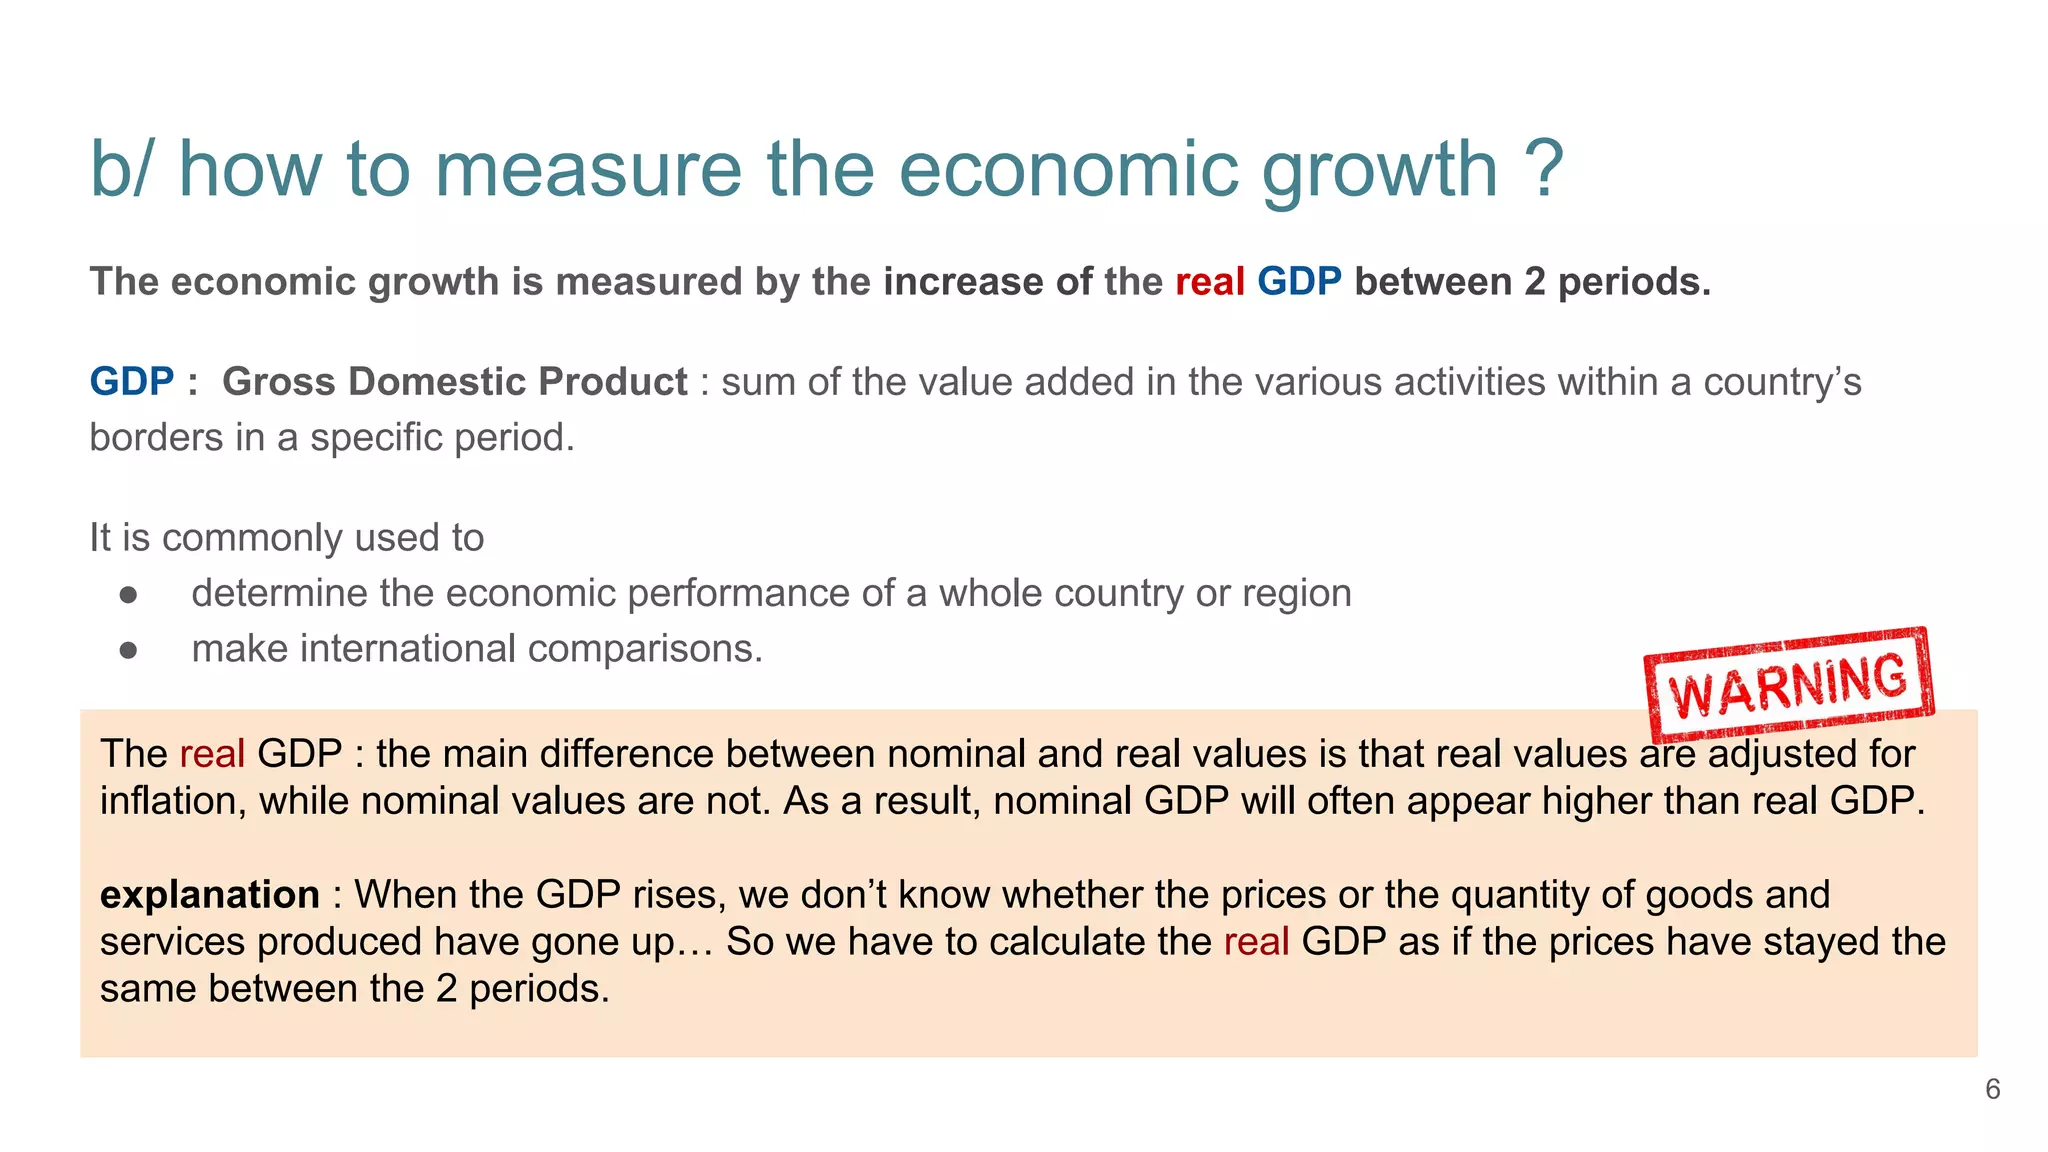
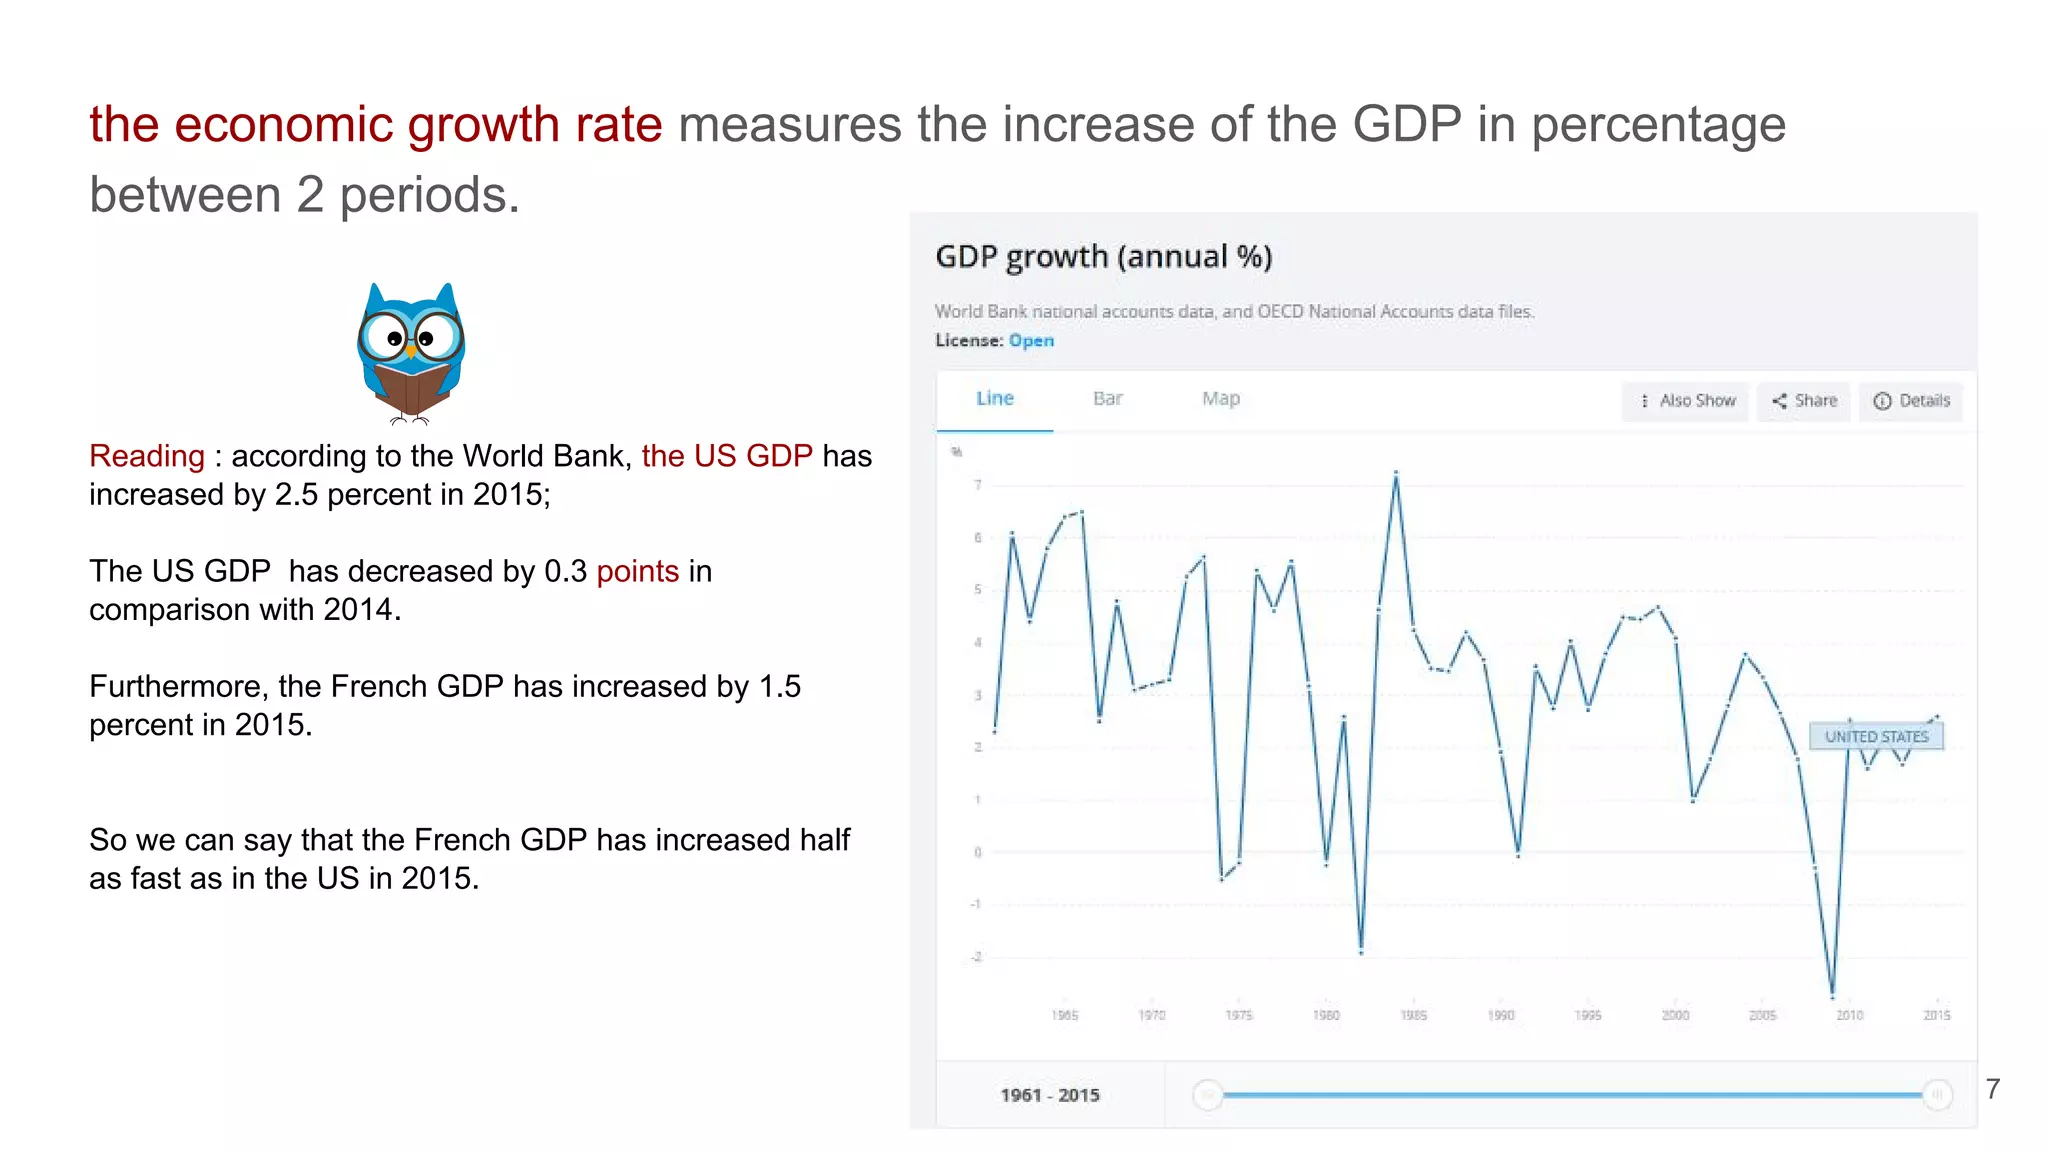
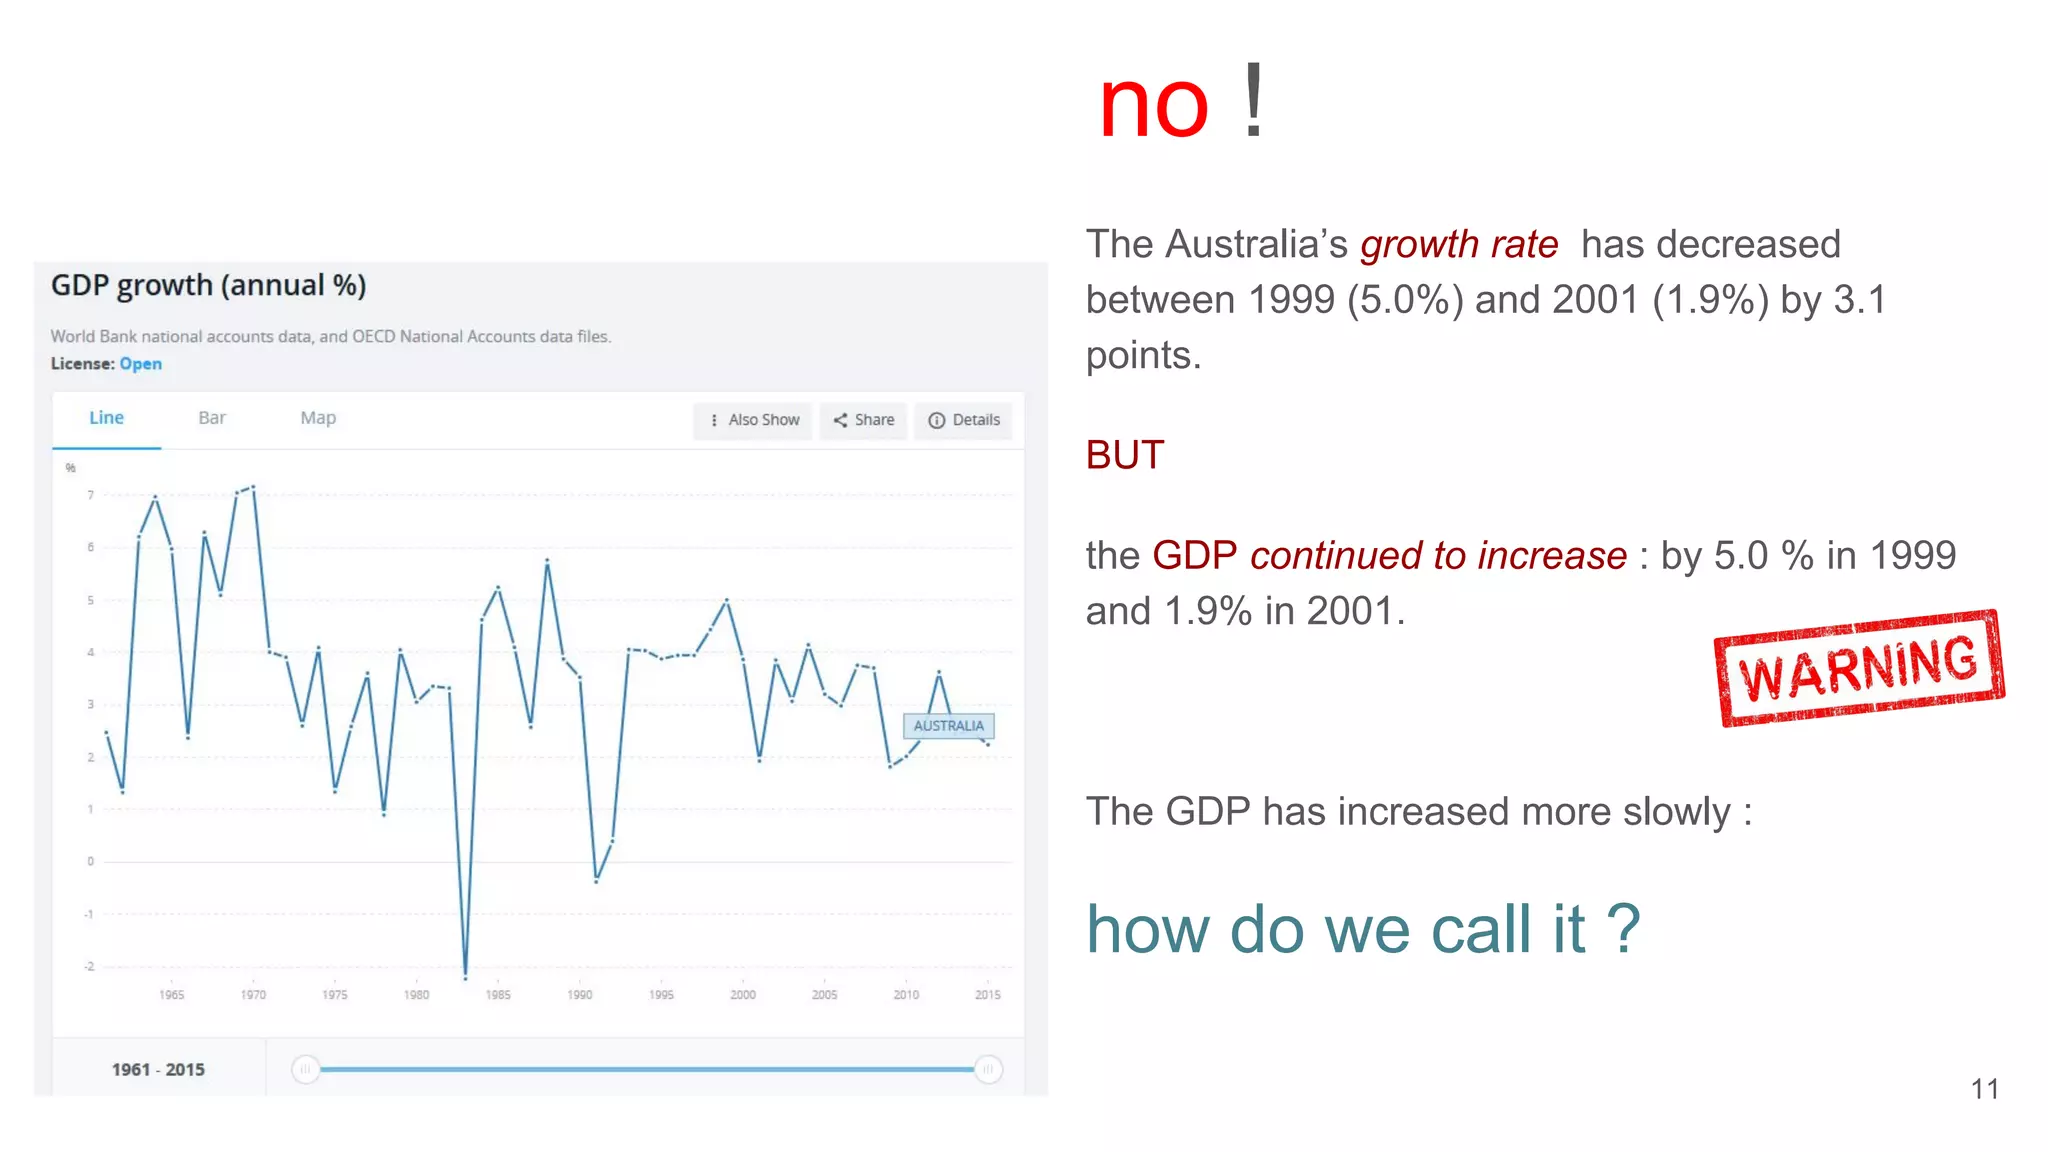
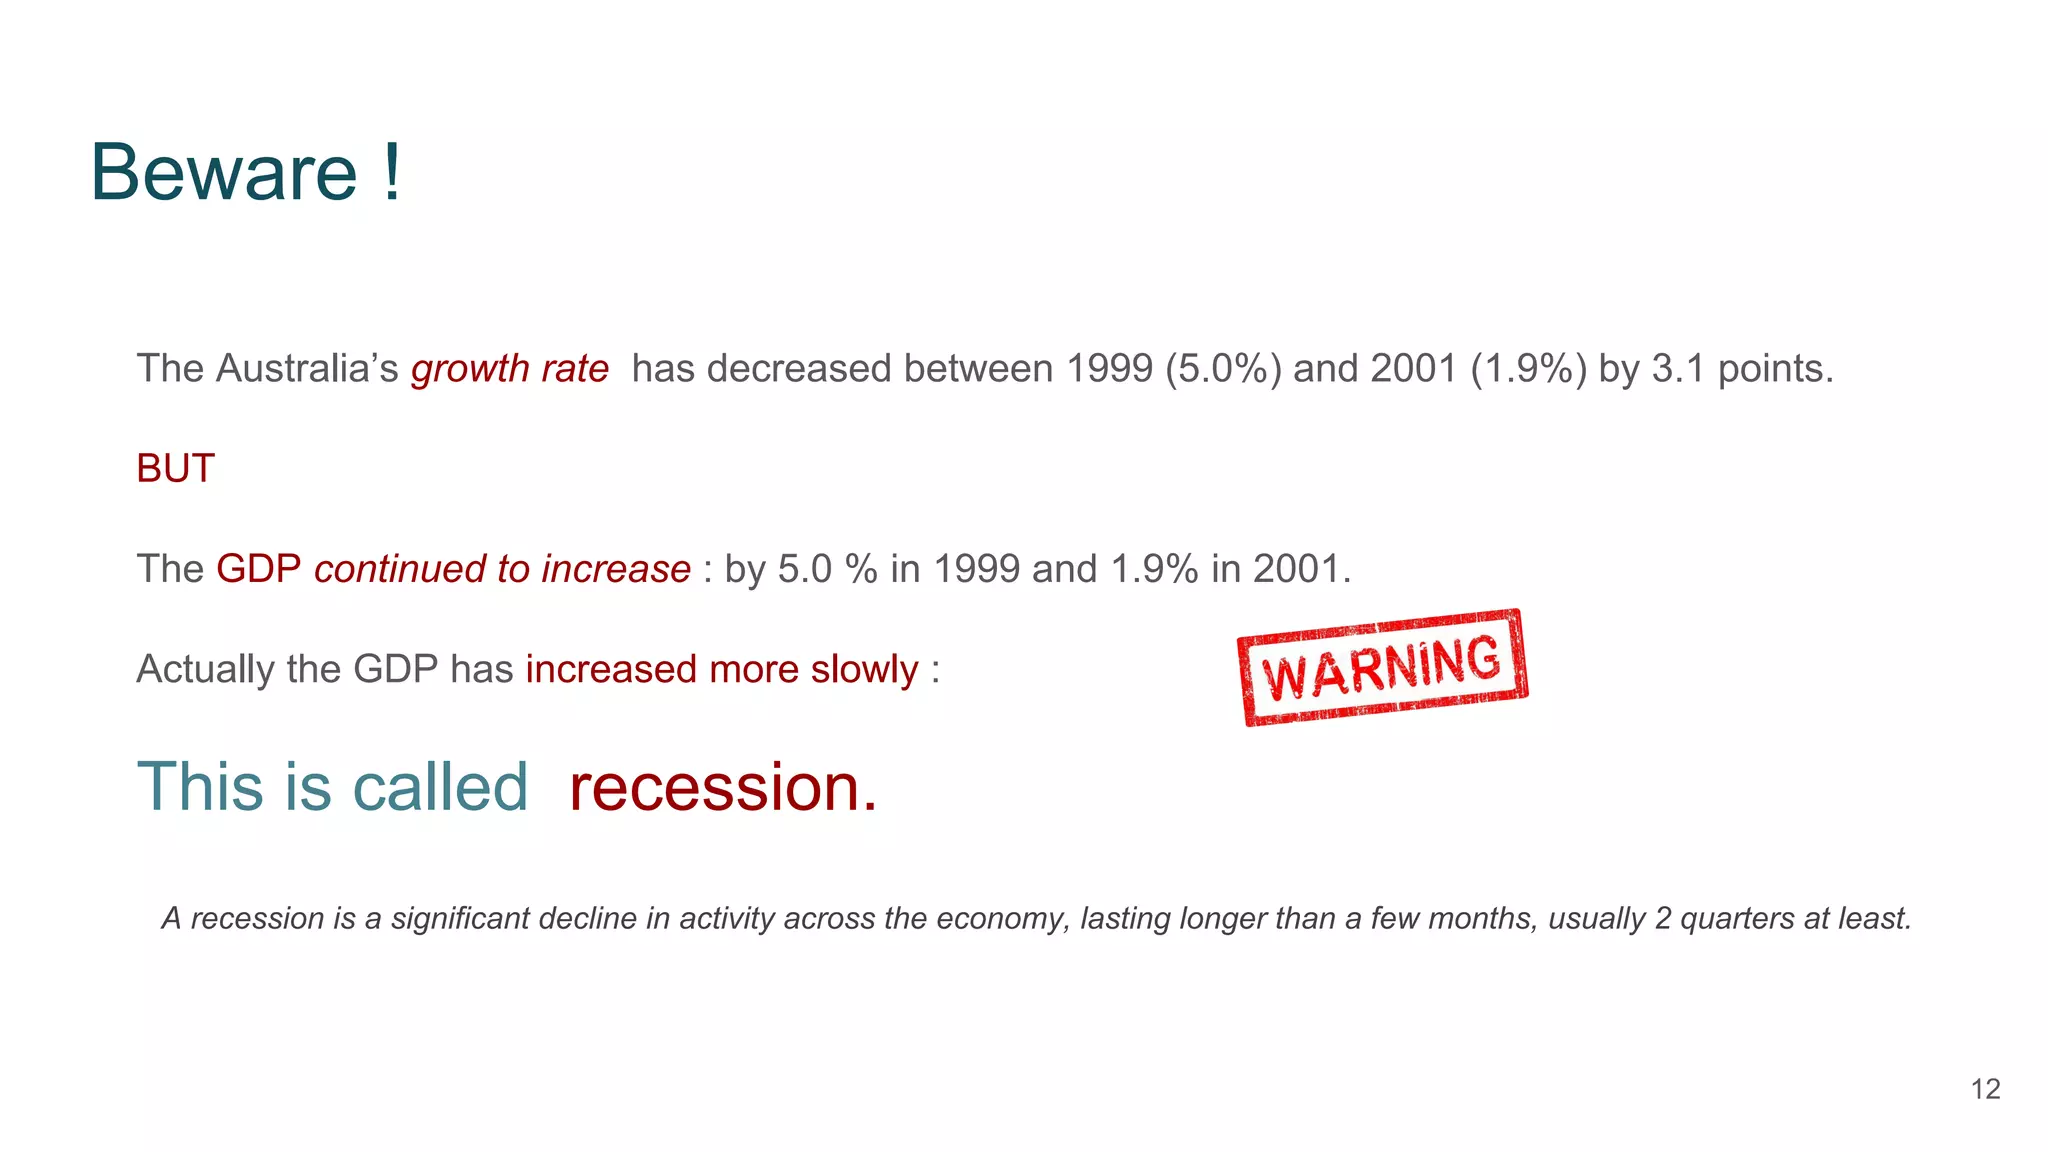
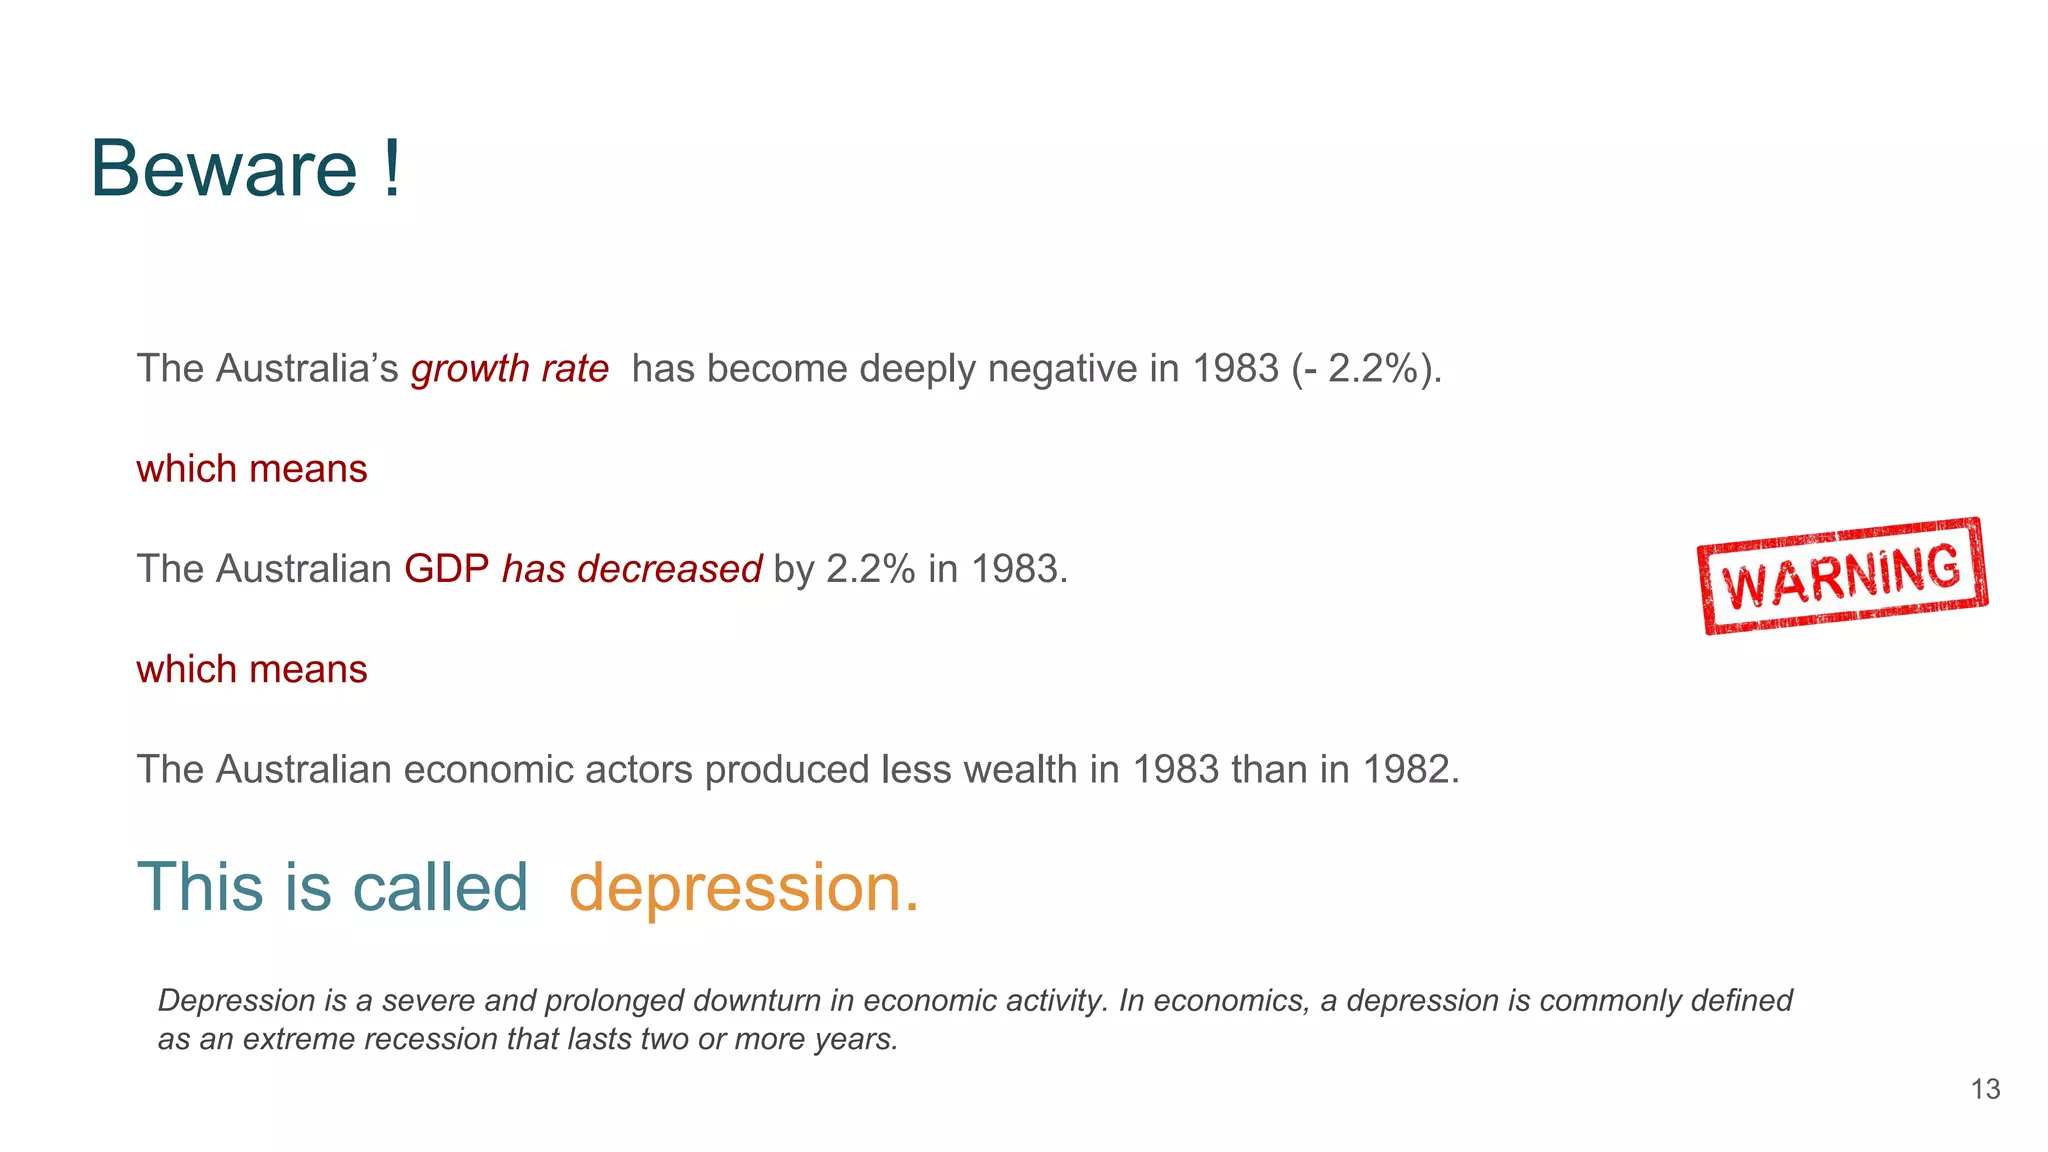
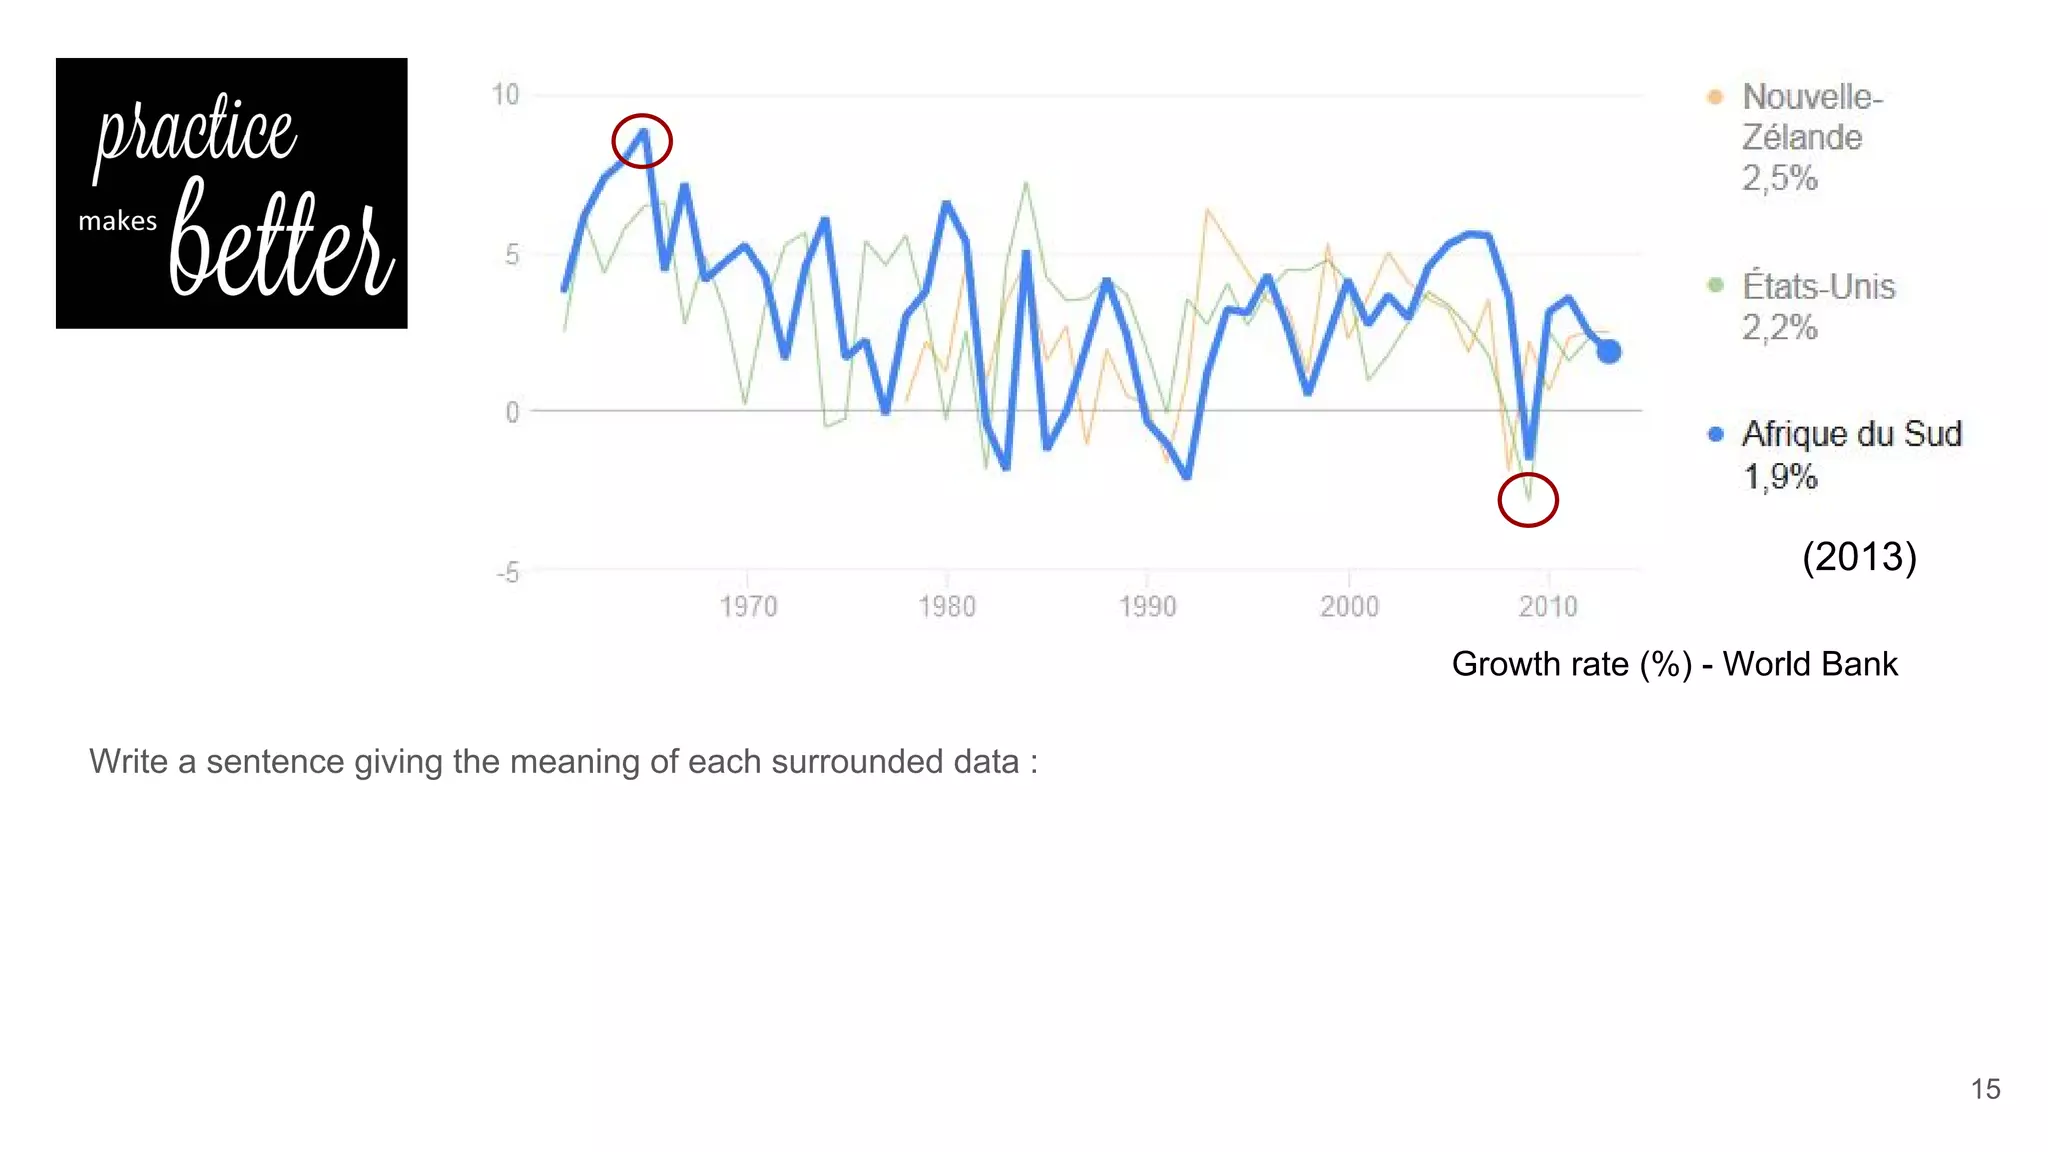
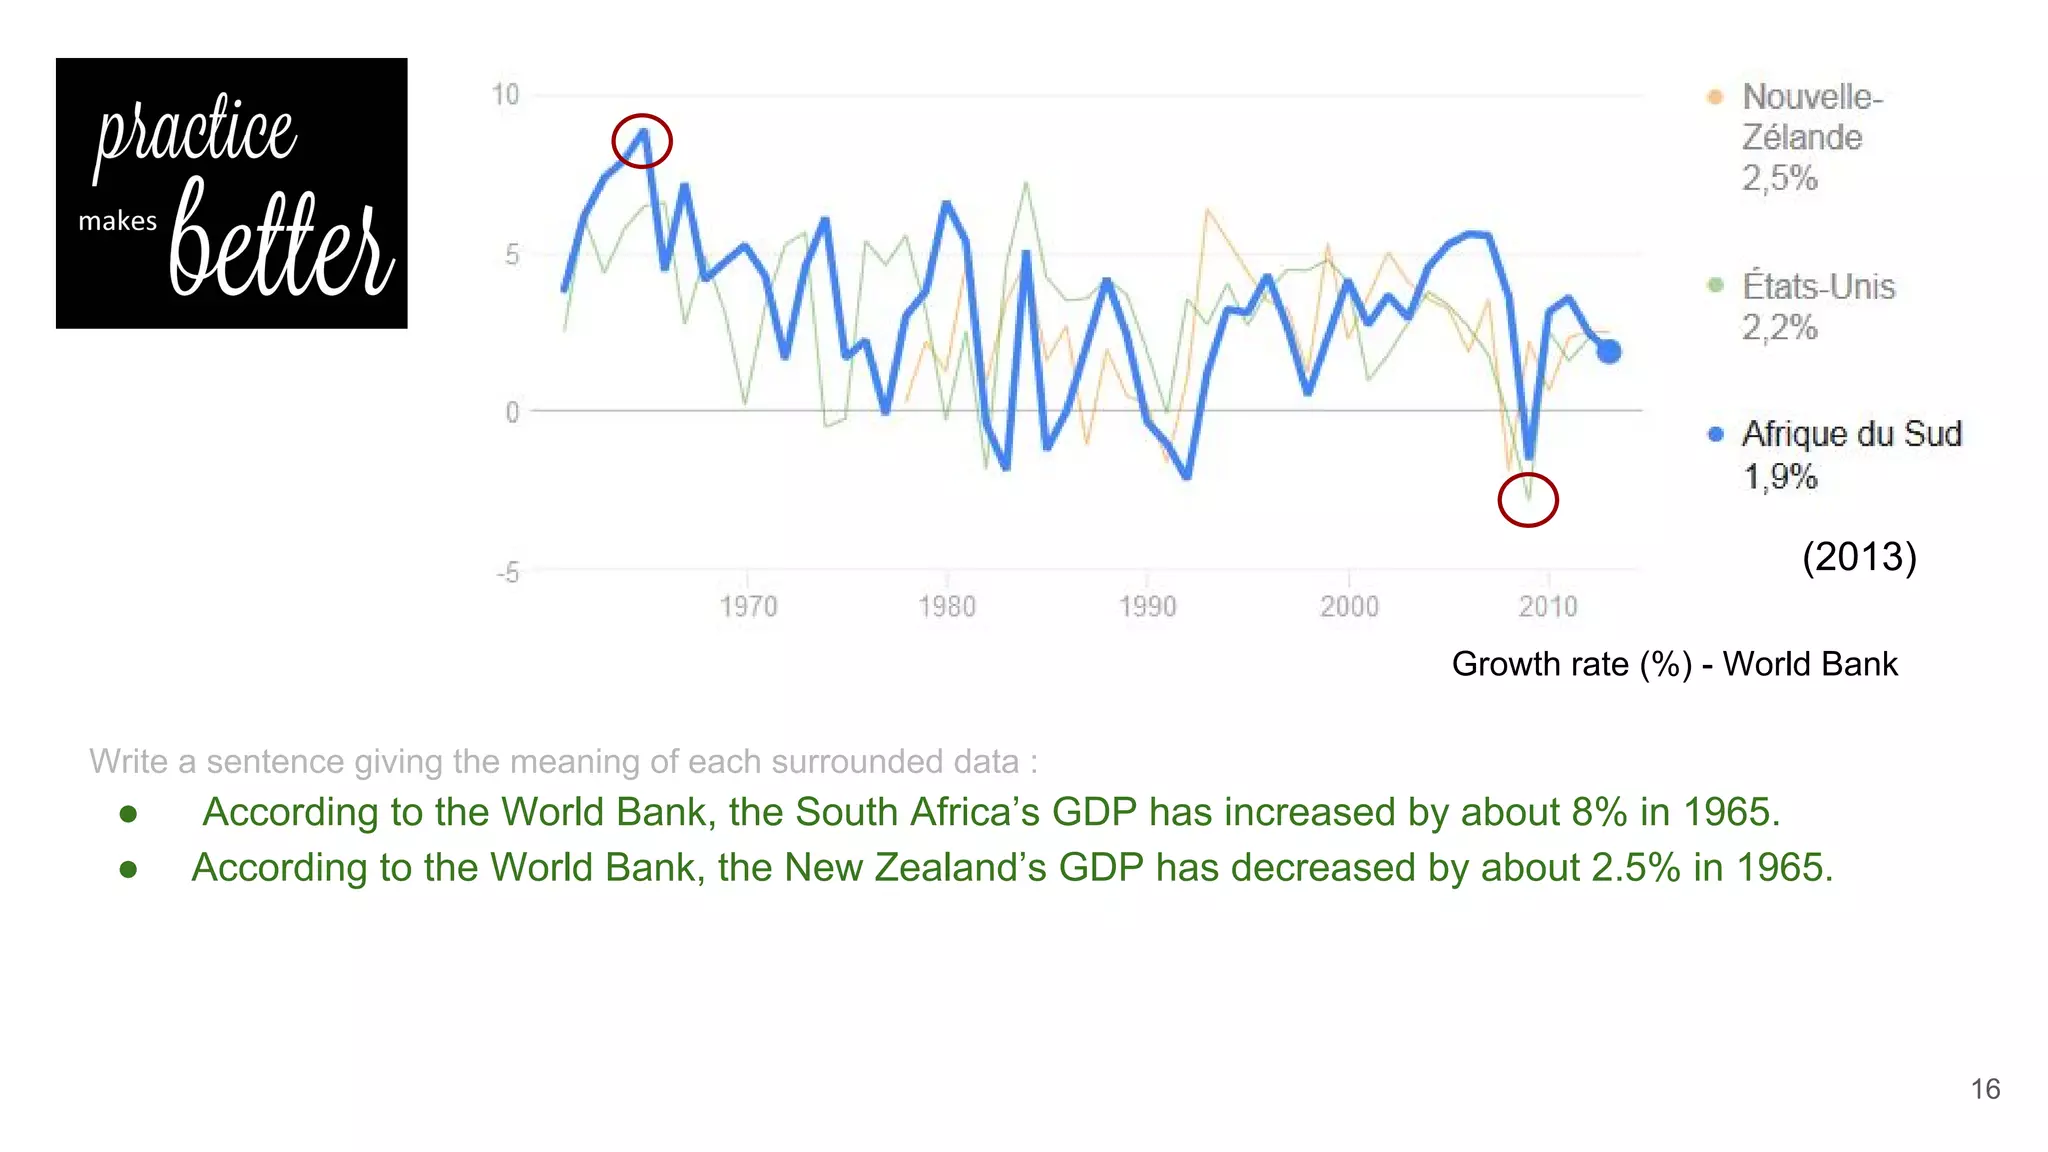
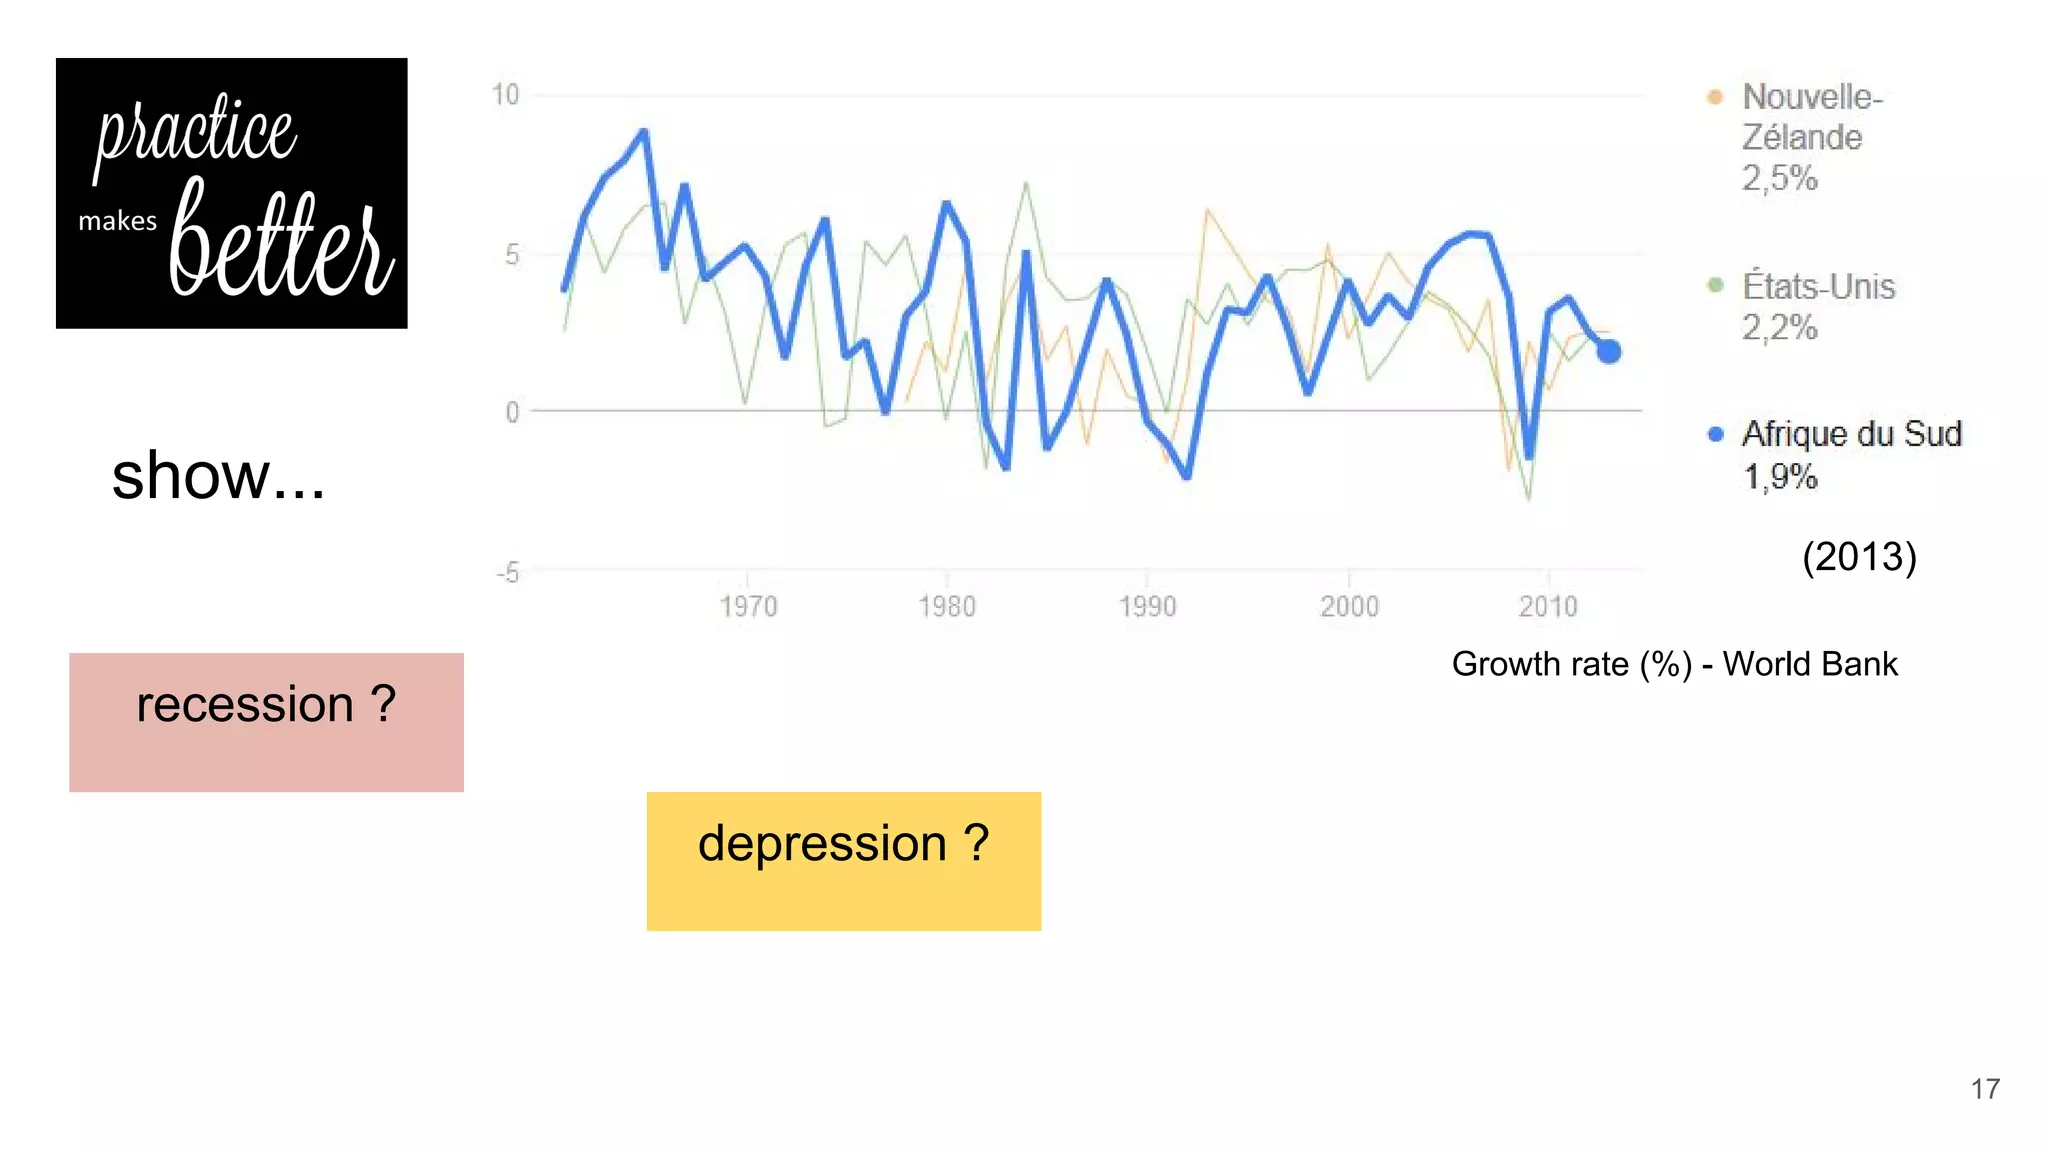

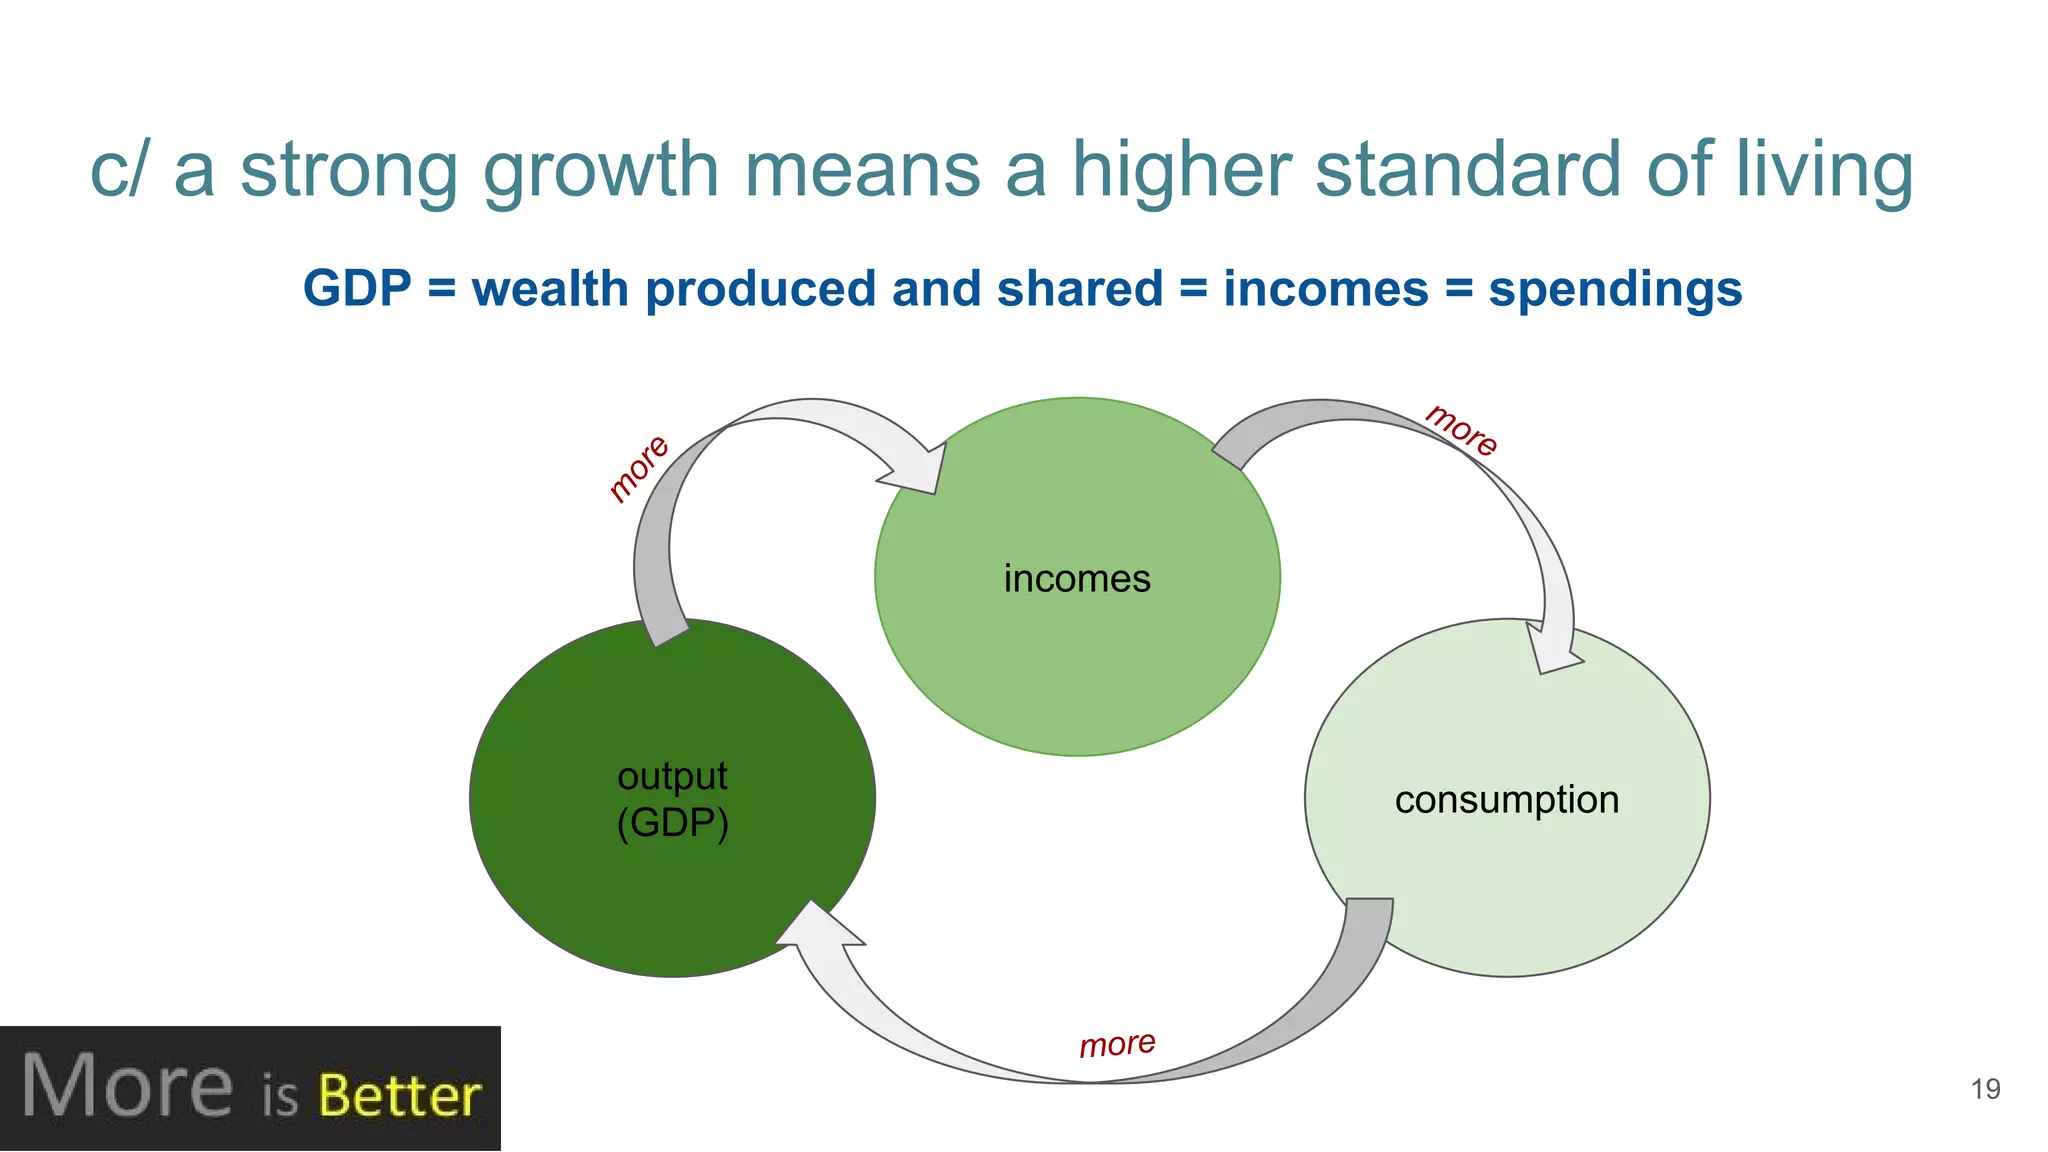
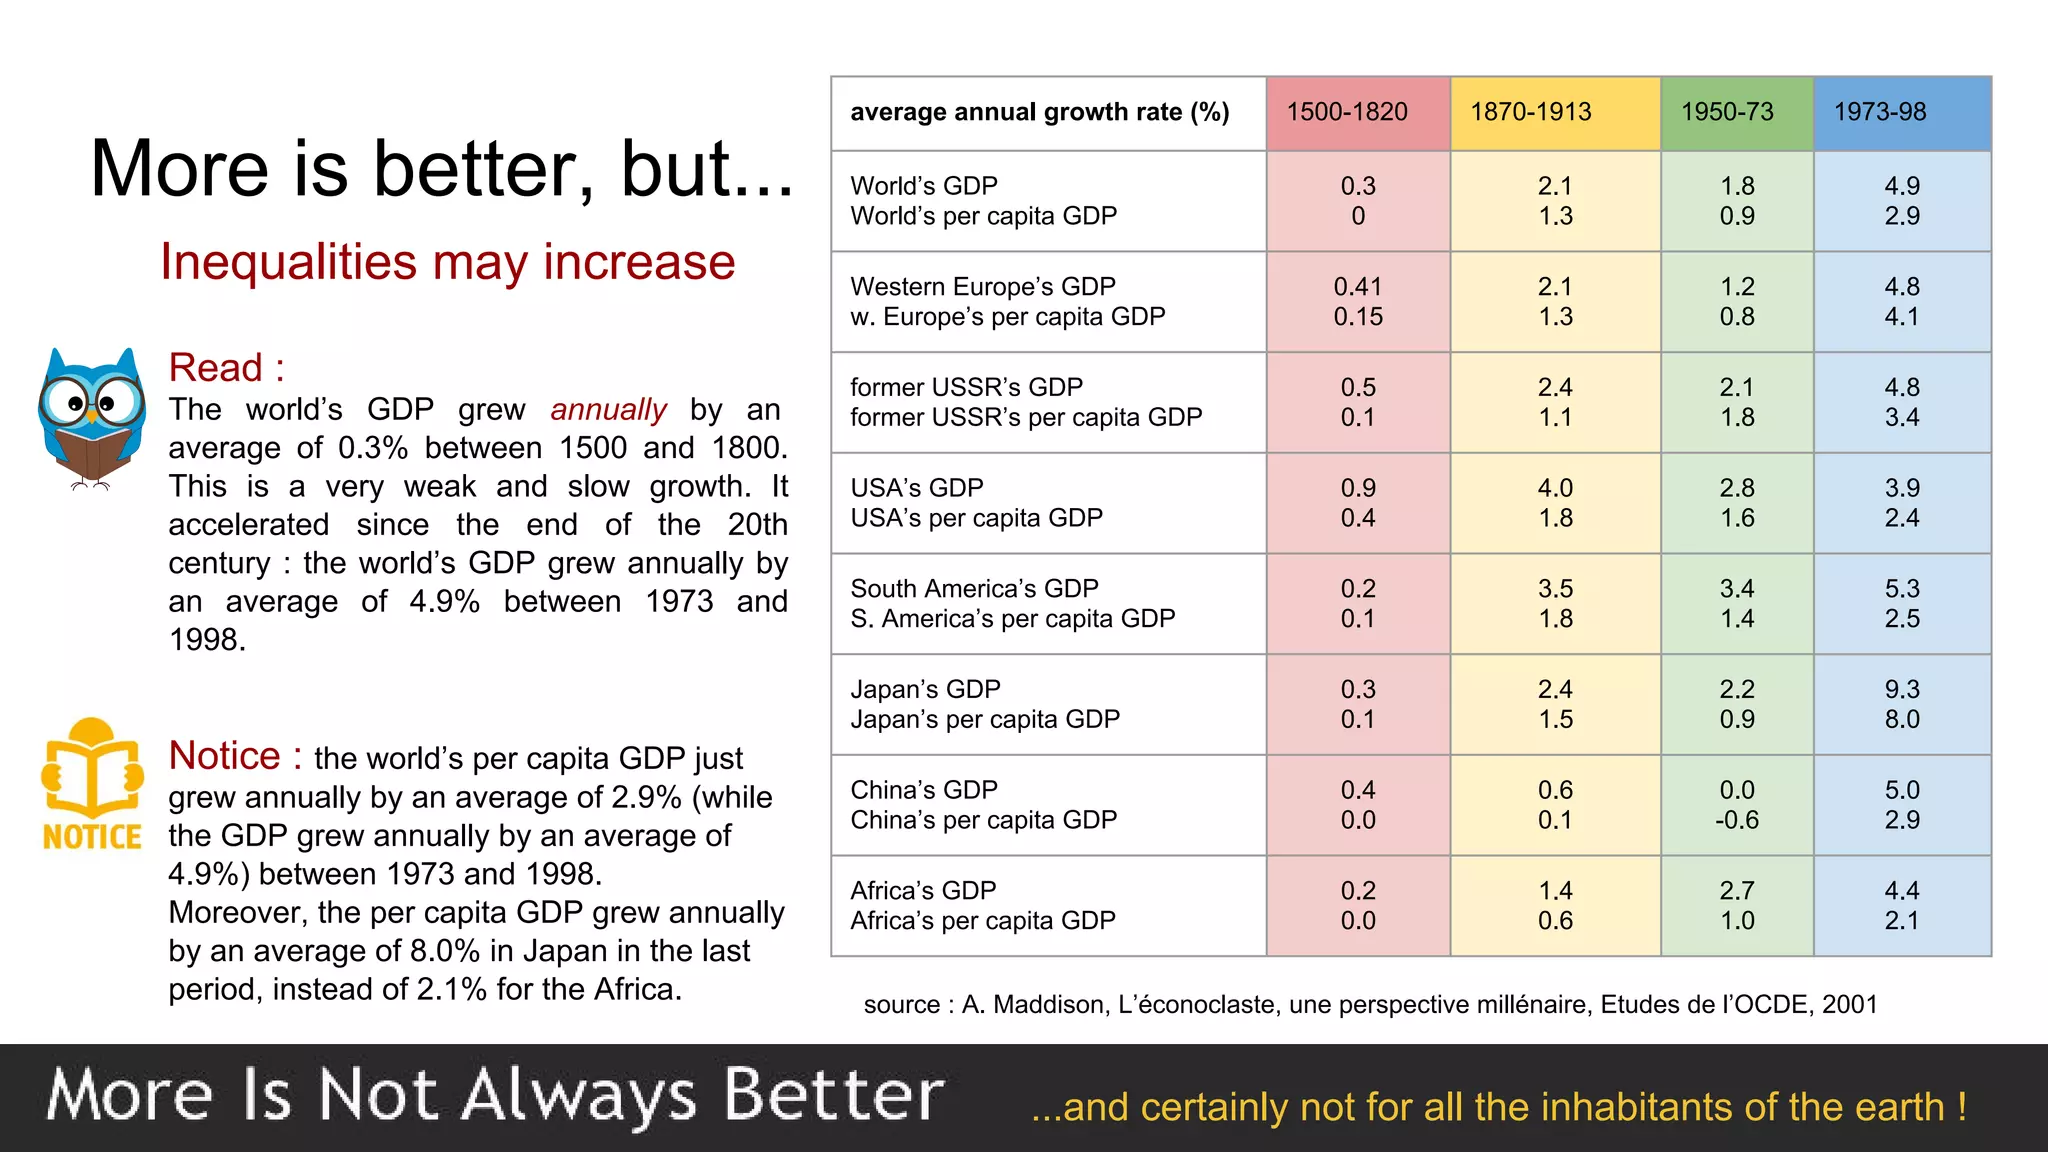
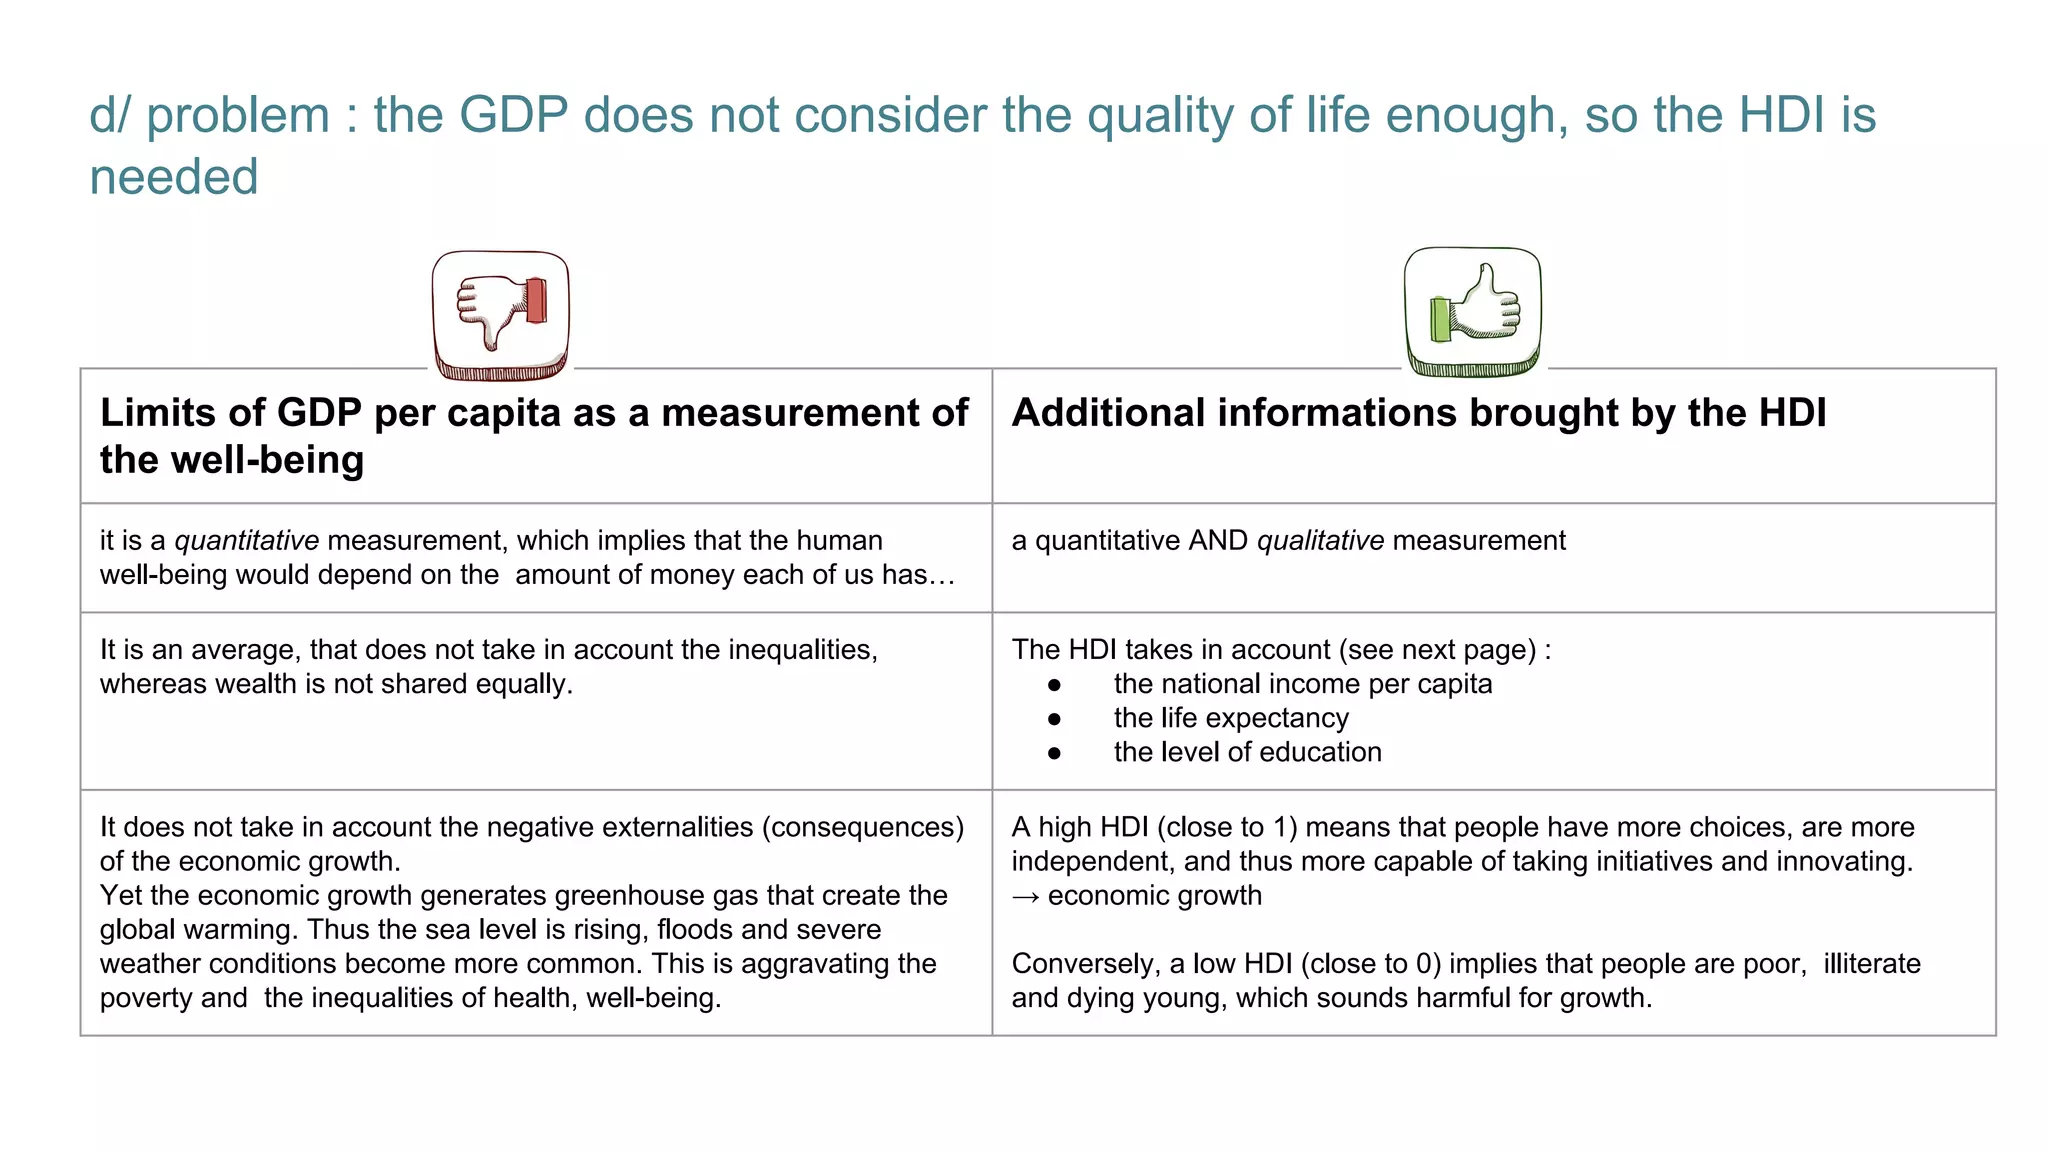
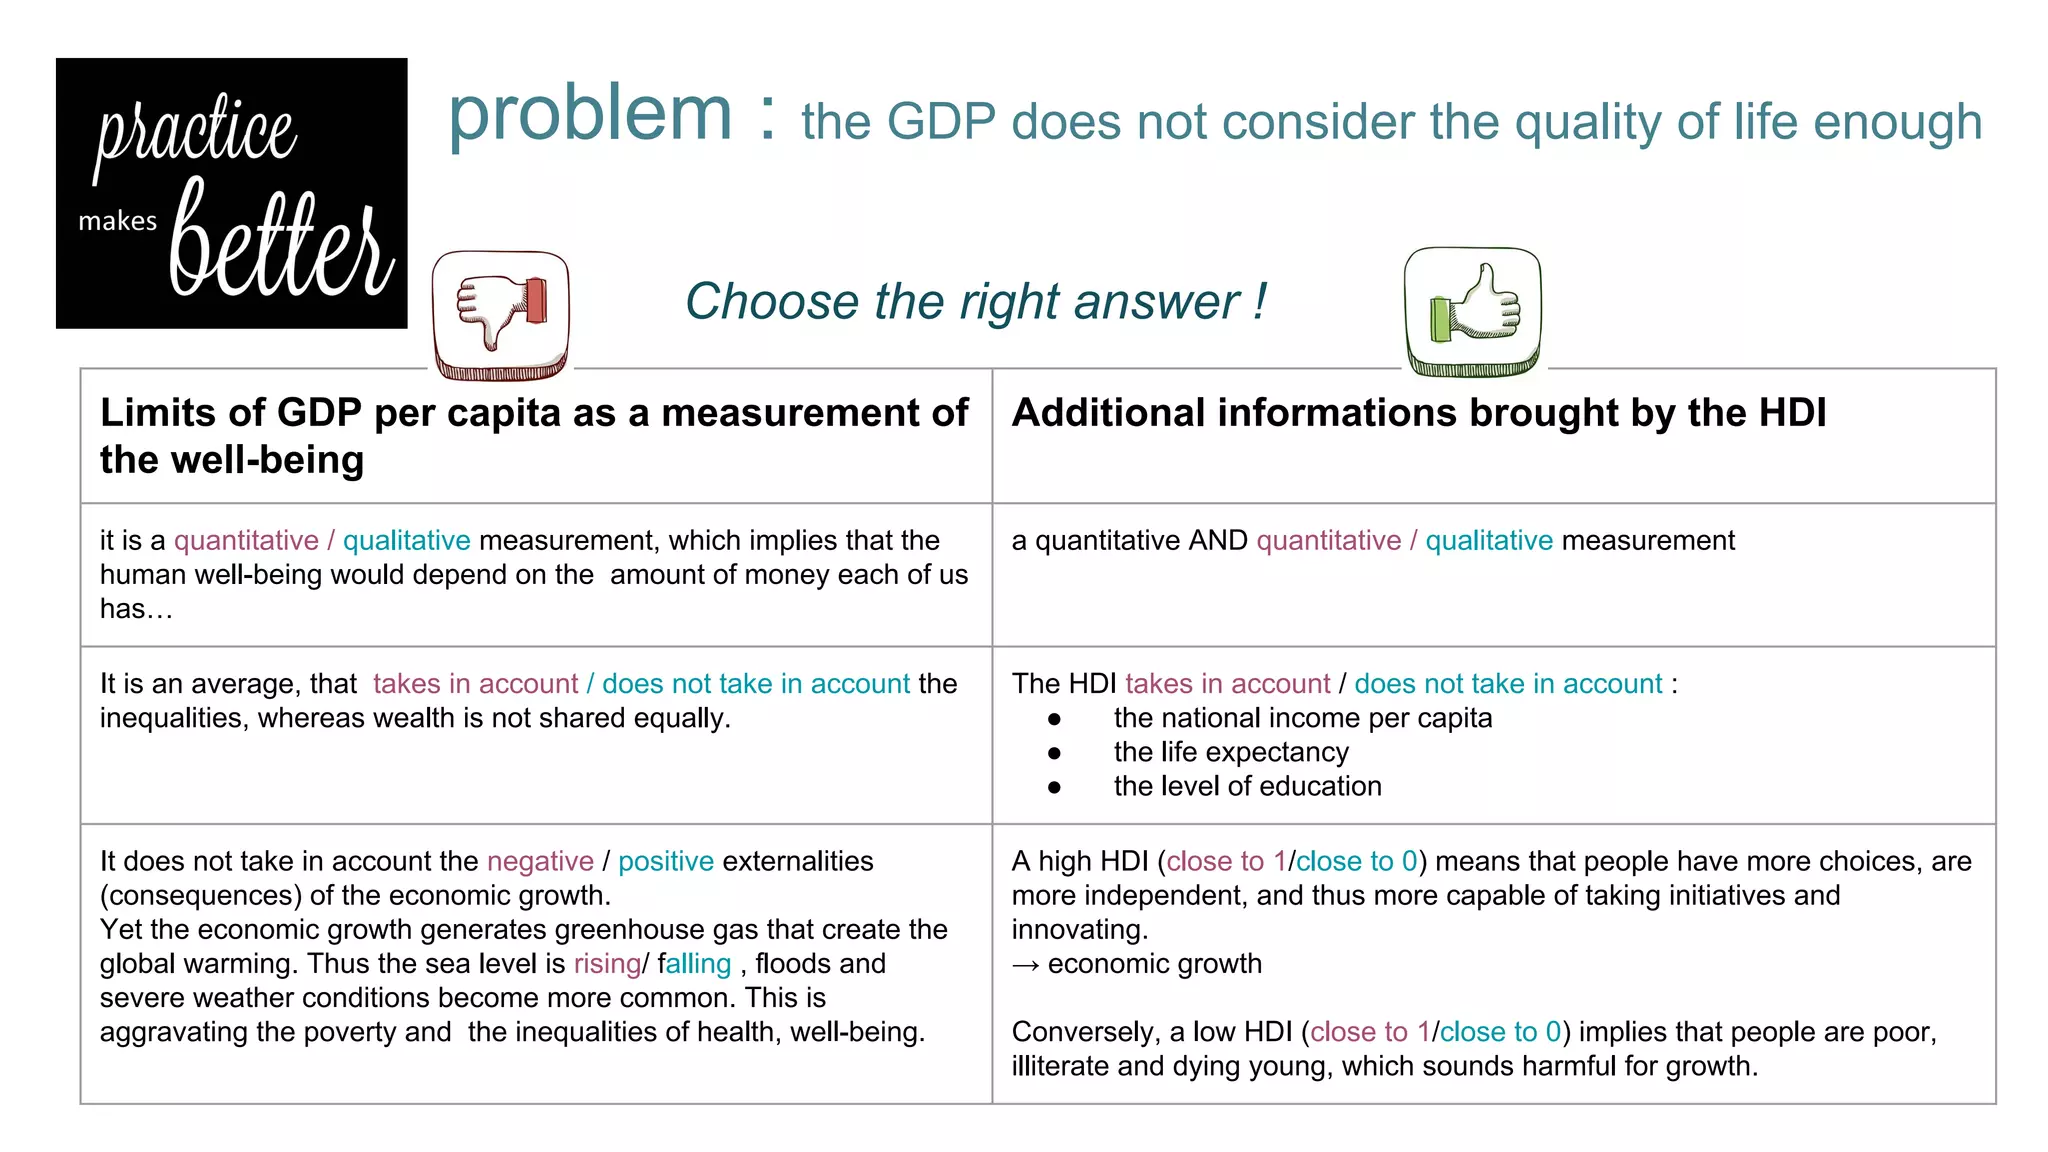
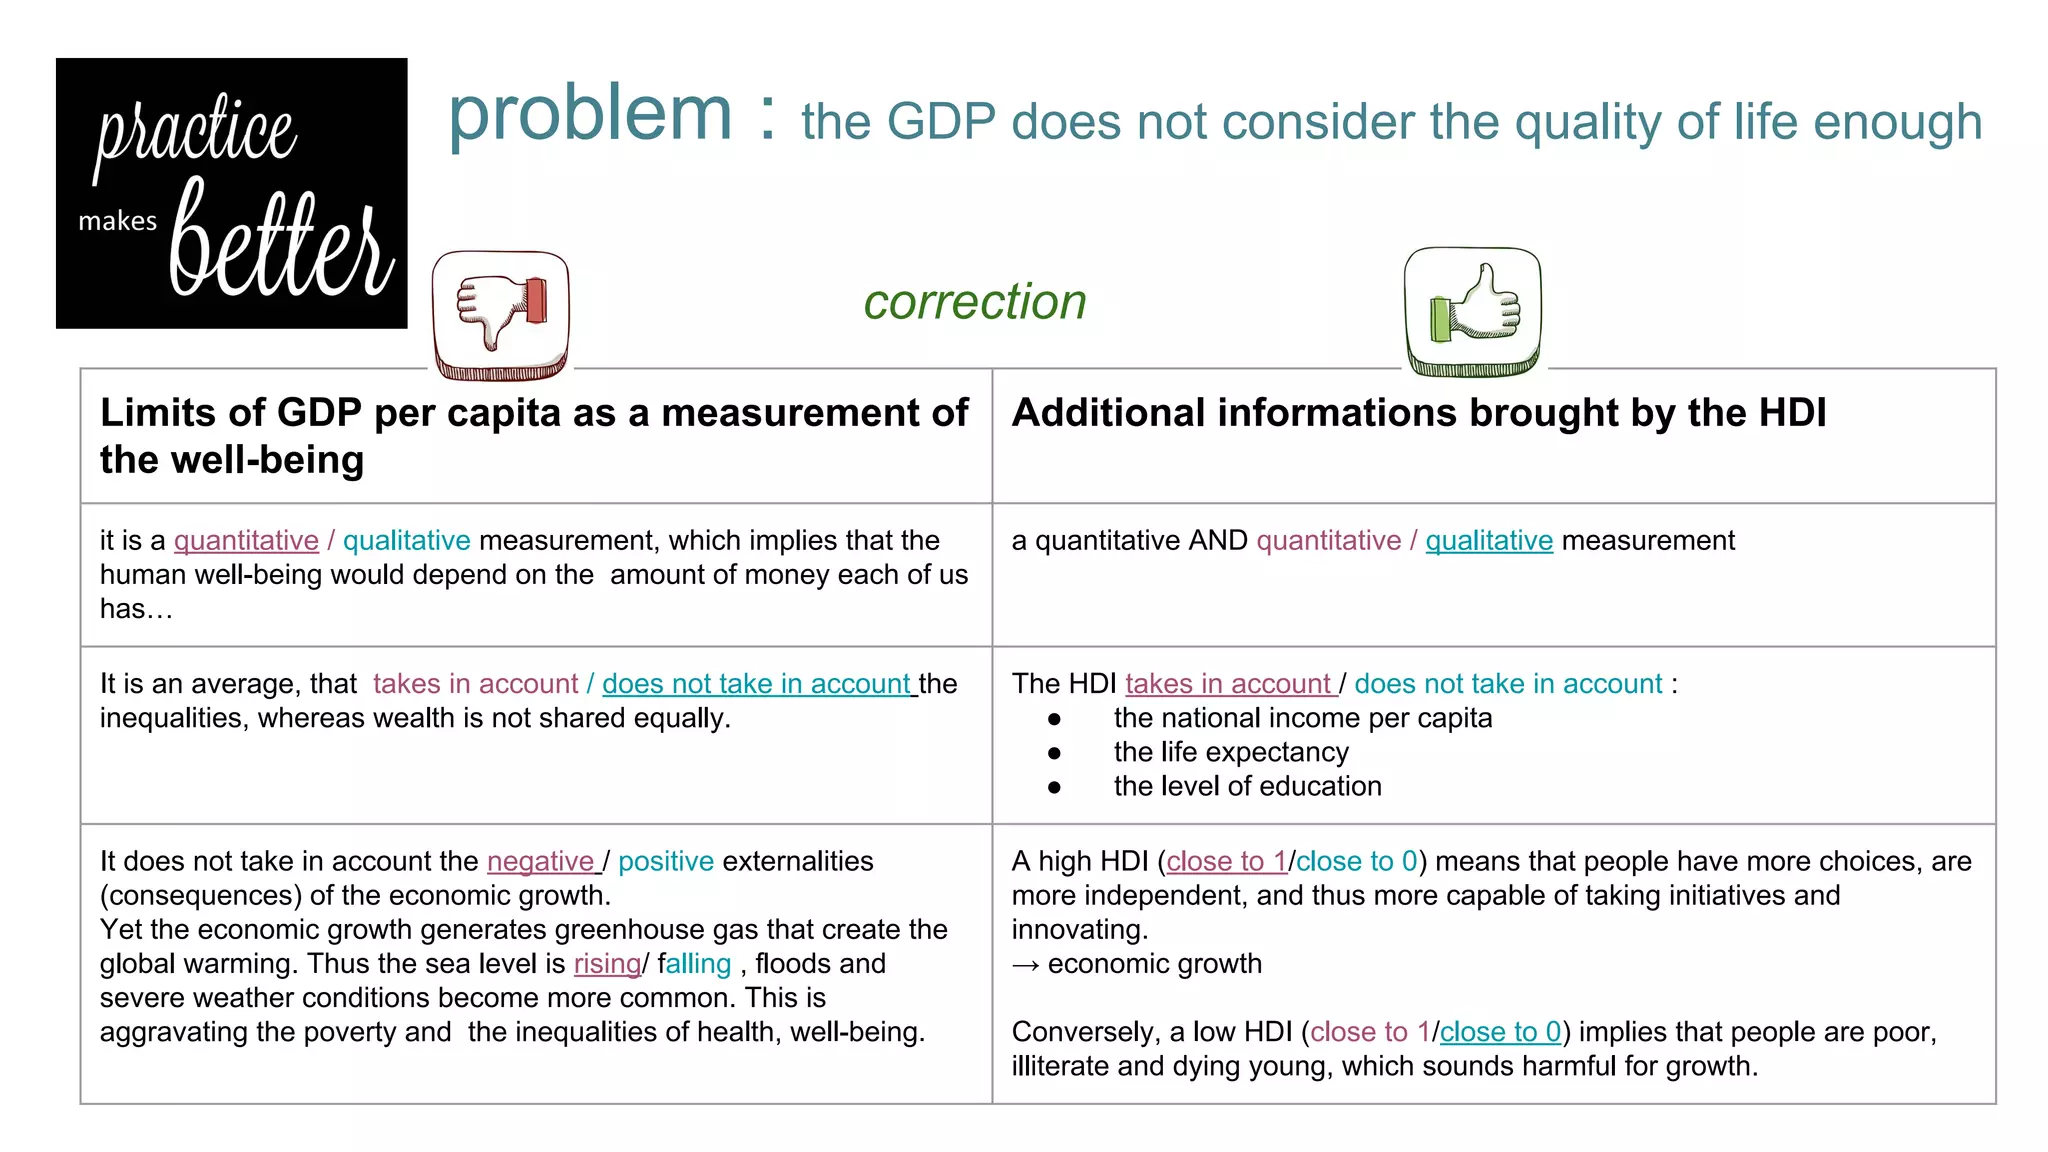
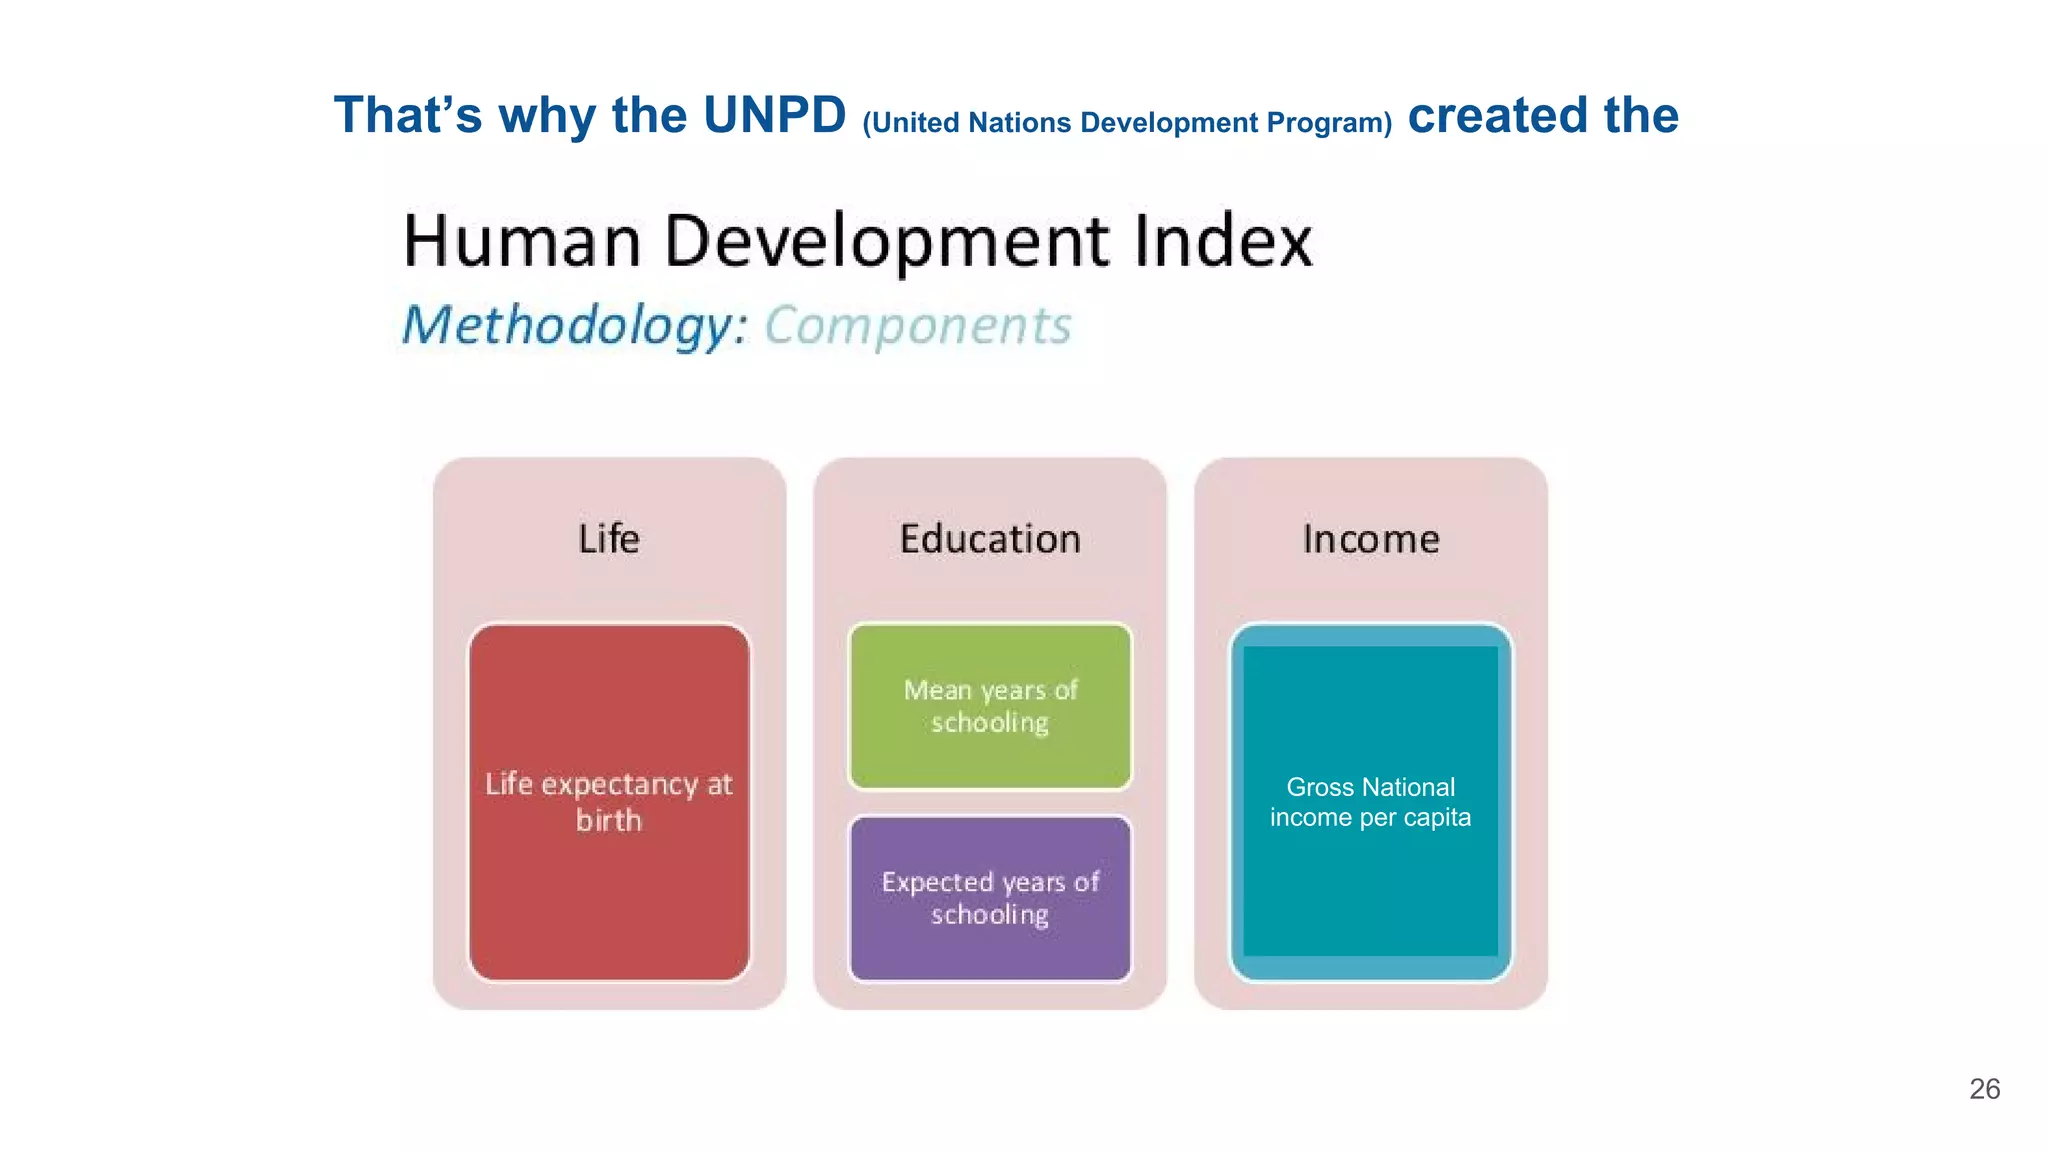
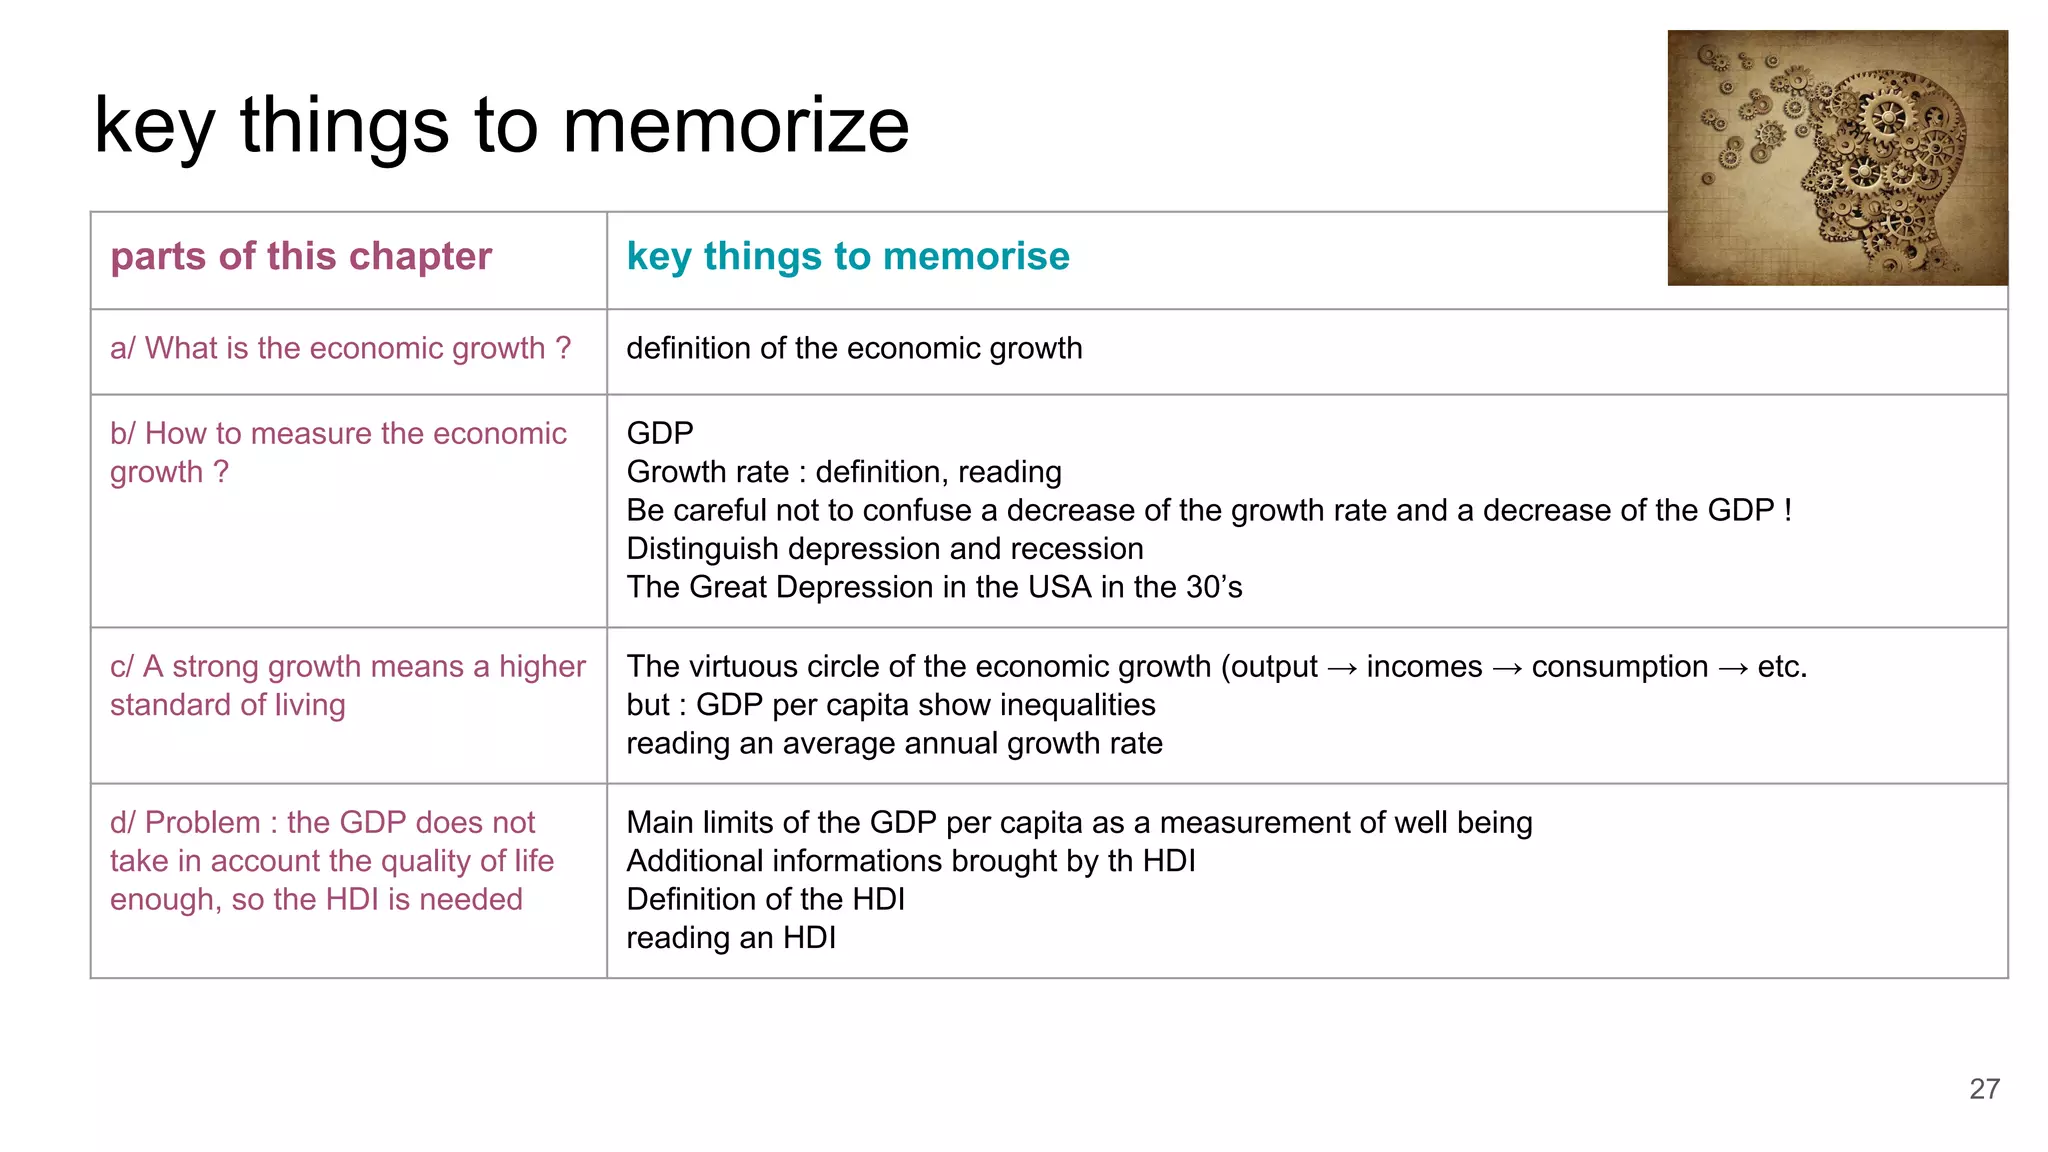

This document defines economic growth and how it is measured. Economic growth is the increase in the amount of goods and services produced in a country over time, usually measured by increases in real GDP. The growth rate measures GDP increase as a percentage. While GDP per capita indicates average income, it does not account for inequality or non-economic factors affecting quality of life. The Human Development Index (HDI) was created to provide a more comprehensive measure of well-being.