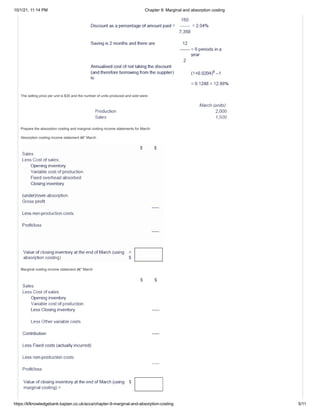
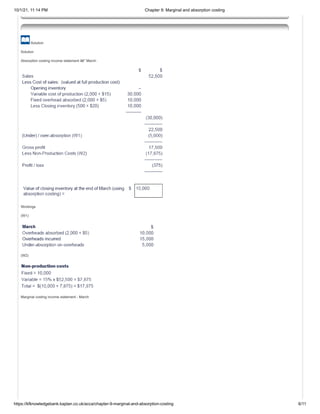
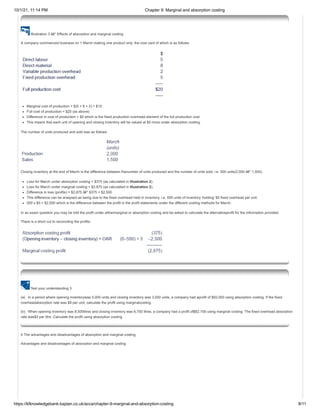
This document provides an overview of marginal and absorption costing concepts. It defines key terms like marginal cost, contribution, fixed costs, and absorption costing. The summary explains that marginal costing values inventory at variable costs while absorption costing uses full production costs, leading to different profit calculations. Examples are provided to illustrate how profits reported under the two methods can reconcile when inventory levels change from period to period.
DCF - An explanation of Discounted Cash FlowChris Garbett
Discounted cash flow (DCF) is a method for analyzing future income and revenue streams by discounting them back to their present value using time value of money principles. It involves subtracting projected expenditures from income for each period to calculate net cash flow, then discounting the net cash flows using a discount rate and summing them to calculate net present value (NPV). The document provides an example of a DCF analysis for a university considering building student residences, listing projected annual income from rent and expenditures on maintenance, repairs, etc. over a 20 year period with a 5% discount rate, calculating the NPV as £584,748. Key challenges noted are accounting for variable future costs and accurately selecting the discount rate.
The document discusses cost-volume-profit (CVP) analysis, which examines how changes in volume, costs, prices, and sales mix affect profits. It outlines assumptions of CVP, describes techniques like break-even analysis, and provides examples of using CVP to determine sales volume needed to achieve a profit target or how profits would change with cost/price increases. The document also includes a case study on a tea company analyzing how much variable costs must decrease to maintain profits as sales drop 40% due to eliminating a middleman.
A guide to functional areas and cost of sales P&L reporting in the SAP® Gener...John Jordan
- The document provides guidance on using functional areas for cost-of-sales accounting in SAP General Ledger, including how to activate cost-of-sales functionality, define functional areas in master records, and create cost-of-sales financial statements by functional area using standard reports.
- It discusses approaches for deriving functional areas from cost objects, G/L accounts, substitutions, and manual entry. Activating the cost-of-sales scenario updates the functional area field for postings.
- The document demonstrates how to generate cost-of-sales reports by functional area using the standard report 0SAPBSPL-01 and drilling down by characteristics for analysis.
Cost centers include production locations, functions, activities, or machines where costs are determined. There are two types of cost centers: production cost centers which are directly involved in manufacturing, and service cost centers which support production indirectly. Cost units are the units of output or service that absorb a cost center's overhead costs, and can be the final products, batches of products, or intermediate parts depending on the complexity of the final product.
1. The document provides financial information about a company including its capital structure, long-term debt instruments, preferred stock, and common stock.
2. Key figures given include annual revenues of $9 billion, a capital structure of 34% long-term debt, 3% preferred stock, and 63% common stock. Details are provided on two long-term debt instruments, the preferred stock, and the common stock.
3. The document poses 10 questions asking the reader to calculate various metrics like yield and required rate of return based on the information provided, and to evaluate whether investments in the company's bonds and stock would be recommended.
Break-even analysis is an accounting tool that calculates the sales volume needed to cover total costs. It determines the point where total revenue equals total costs, resulting in zero profit. Costs are categorized as either variable costs that change with production volume or fixed costs that remain constant. The break-even point formula divides total fixed costs by the price per unit minus the variable cost per unit to calculate the sales volume required to break even. Understanding the break-even point helps companies ensure they have sufficient market demand to be profitable.
The document discusses several costing techniques including throughput accounting, theory of constraints (TOC), target costing, and backflush costing. Throughput accounting focuses on increasing throughput and reducing inventory and expenses. TOC identifies bottlenecks limiting throughput and ways to remove them. Target costing determines the maximum allowable cost for a new product based on the anticipated selling price and desired profit. Backflush costing calculates product costs retrospectively at the end of the accounting period without tracking costs throughout production.
This document outlines topics in managerial accounting including breakeven analysis, cost-volume-profit (CVP) analysis, multiproduct CVP analysis, and pricing decisions. It lists questions about calculating the breakeven point, using CVP to determine sales levels needed for a target operating income, assumptions of CVP analysis, sales mix in multiproduct settings, calculating markup versus gross margin percentage, cost-plus pricing and its flaws, and using target costing. The document provides an overview of key concepts and questions in managerial accounting cost analysis and pricing.
1. Marginal cost is the change in total costs from producing one additional unit of output. It considers only variable costs that change with production volume.
2. Break-even analysis determines the point where total revenue and total costs are equal. The break-even point can be calculated in units or sales value by dividing fixed costs by the contribution margin per unit.
3. Contribution margin is the amount each unit sold contributes to covering fixed costs after variable costs are deducted from selling price.
Target costing is a management technique that works backwards from the desired market price and profit to determine the maximum allowable cost for a product. It establishes a target cost before production begins based on the market share and profit needed. Current costs are then compared to the target cost to identify any cost gaps that management must address through design improvements or other strategies. The key aspects are establishing a target cost upfront based on market factors rather than internal budgets, and driving design and planning changes to meet that target cost.
This document outlines how to prepare flexible budgets that can be used to evaluate performance. It discusses the deficiencies of static budgets and how flexible budgets address them by adjusting for different activity levels. It provides an example of Larry's Lawn Service to demonstrate how to prepare a flexible budget with multiple cost drivers. Key steps include preparing flexible budgets, calculating activity variances between the static and flexible budgets, calculating revenue and spending variances between the flexible budget and actual results, and combining these variances into a single performance report. The document suggests flexible budgets can also be used for non-profits and cost centers.
Here are the allocations using the specified allocation bases:
b. The allocation bases used are reasonable for the costs allocated. Employee benefits and telecommunications are allocated based on headcount, which is a reasonable driver for those costs. Rent is allocated based on square footage occupied, which reasonably drives the rental costs. General and administrative costs are allocated based on sales, which is also reasonable since these costs support sales activities.
P2. a. Cost Pools:
Maintenance $120,000
Utilities $80,000
Security $60,000
b. Allocation Bases:
Maintenance: Machine hours
Utilities: Square footage
Security: Number of employees
c. Department A:
Machine
Combined COPA allows organizations to analyze profit-related transactions (such as the invoicing of a customer or consumption through delivery), both in the form of value fields and also in the form of accounts to which posting takes place in financial accounting.
The document provides information on various types of financial ratios used to analyze the financial performance and position of a company. It discusses liquidity ratios like current ratio and quick ratio, leverage ratios like debt-equity ratio and debt-total fund ratio, activity ratios like inventory turnover ratio and average collection period, profitability ratios like gross profit margin ratio and net profit margin ratio, and valuation ratios like earnings per share. Formulas to calculate these ratios are given along with an example company's ratios. The document emphasizes the importance of ratio analysis for comparing performance over time, between companies, and against industry standards.
ABC is a costing system where indirect costs are assigned to products and services. The system establishes a relationship between overhead costs and production activities by allocating overhead costs to them with high precision. As a result, overhead costs are allocated more accurately based on their relevant activity levels. The system has eliminated the defects of the traditional/absorption costing system. ABC is used both as a planning tool and as a controlling instrument after the production is finished. ABC provides the basis for pricing decisions, inventory valuation, profitability analysis and overhead allocation. The system can effectively be used for both products and services.
Cost accounting tracks and analyzes costs to help businesses control expenses and maximize profits. Target costing determines the cost at which a product must be produced to generate desired profits at its anticipated selling price. It involves defining the product, setting cost targets, achieving targets, and maintaining competitive costs. Kaizen costing maintains present costs for existing products through continuous improvement efforts. Activity-based costing assigns overhead costs based on activities and cost drivers rather than direct labor hours, providing more accurate product costs.
This document discusses cost-volume-profit (CVP) analysis, which examines the effect of different activity levels on an organization's profits. CVP analysis allows managers to forecast break-even points, target profits, and the impact of changes in selling price, costs, or activity levels. Limitations include assumptions that fixed costs and prices remain constant and that production equals sales volumes. The document also covers unit, job, and batch costing methods.
CO-PA allows companies to analyze profitability by market segments defined by characteristics like products, customers, and regions. It uses master data like cost elements, characteristics, and profitability segments. Actual values flow into CO-PA from transactions in modules like SD, FI, and CO-PC. Planning is done using versions, levels, and data transfer from other modules. Reports provide drilldown and detail views of profitability analysis.
This document discusses different costing methods used in management accounting including job costing, process costing, batch costing, contract costing, and service costing. It provides examples and explanations of key concepts in job costing like job cost sheets, predetermined overhead rates, and manufacturing overhead. Process costing is explained as a method used for mass production of nearly identical units where costs are accumulated and assigned to units produced. Batch costing is defined as identifying and assigning costs to a set amount of similar goods produced in a batch. Contract costing applies especially to long-term construction projects performed over multiple periods. Finally, service costing calculates the full costs of services an entity provides using direct and indirect costs.
Cost-volume-profit (CVP) analysis examines how changes in volume, costs, and prices affect profits. It is used for managerial decisions like pricing, order acceptance, product promotion, and feasibility analysis. CVP analysis uses techniques like contribution margin analysis and break-even analysis under assumptions like linear revenues and expenses. Questions address profit levels at different volumes, the volume where costs equal revenues, and the effects of cost/price changes on profits.
Calculating cost of goods sold in manufacturingMRPeasy
Calculating Cost of Goods Sold in Manufacturing
Efficiency is the lifeblood of any manufacturing company and the cost of goods sold (COGS) is among the most important measurement of successful businesses. What is it and how to calculate it?
https://manufacturing-software-blog.mrpeasy.com/2019/03/26/calculating-cost-of-goods-sold-in-manufacturing/
https://www.mrpeasy.com/
Standard costs are developed using formulas, supplier lists, or time studies and compared to actual costs to calculate variances which should be investigated if significant, with variances for direct materials including price, quantity, mix and yield and variances for direct labor including rate, efficiency, mix, yield and idle time.
Managerial Accounting Garrison Noreen Brewer Chapter 03Asif Hasan
The document describes job-order costing. It provides examples of companies that would likely use job-order costing, such as Boeing, Bechtel International, and Walt Disney Studios. It also contrasts job-order costing with process costing. Job-order costing traces and allocates costs to individual jobs/orders, while process costing assigns average costs per unit for a single product. The document includes examples of forms used in job-order costing, such as a materials requisition form, employee time ticket, and job cost sheet.
This document discusses process costing concepts including:
1. Equivalent units is used to calculate average unit costs and represents partially completed units as a percentage of whole units.
2. Conversion costs include direct labor and overhead costs incurred throughout the production process.
3. Cost per equivalent unit is calculated by dividing the total costs (beginning WIP + costs incurred) by the total units (completed + equivalent units in ending WIP).
4. Reconciliation ensures calculations are correct and no units are lost by accounting for the total number of units.
Cost-volume-profit (CVP) analysis is a technique used to analyze the relationship between costs, volume, and profits. It uses linear equations to model how total costs and revenues change with production volume. CVP breaks down costs into fixed and variable components and calculates the break-even point, where total revenues equal total costs. It also determines the contribution margin of each unit and how many units must be sold to cover fixed costs. CVP analysis is useful for short-term decision making but assumes costs and prices remain constant, which limits its effectiveness for long-term planning.
The document discusses concepts related to marginal costing including:
1) The definition of marginal cost as the change in total cost from producing one additional unit of output.
2) Formulas used in marginal costing like marginal cost, contribution, profit volume ratio, and break-even point.
3) The advantages of using marginal costing and break-even analysis for managerial decision making regarding production levels and product profitability.
Marginal costing is an alternative to absorption costing where only variable costs are charged as cost of sales. Fixed costs are treated as period costs. Closing inventories are valued at marginal cost. Contribution is the difference between sales revenue and marginal cost of sales, and it goes towards recovering fixed costs and generating profit. Break-even point is where contribution equals fixed costs and there is no profit or loss. Marginal costing focuses on distinguishing variable and fixed costs and uses marginal cost for inventory valuation and contribution for decision making.
This document provides an overview of marginal costing and absorption costing.
1. Marginal costing treats variable costs as product costs and fixed costs as period costs, while absorption costing treats both variable and fixed production costs as product costs.
2. Profits reported under the two methods will differ if inventory levels change during the period, as absorption costing includes a portion of fixed costs in inventory valuation.
3. The difference in reported profits equals the change in inventory units multiplied by the fixed production cost per unit absorbed. In the long run, total reported profits will be the same under both methods.
Marginal costing is an alternative to absorption costing. Under marginal costing, only variable costs are charged as cost of sales and contribution is calculated. Fixed costs are treated as period costs. Contribution is the difference between sales revenue and variable costs, and it goes towards recovering fixed costs and generating profit. The key principles of marginal costing are that fixed costs do not change with volume, so increasing or decreasing sales only impacts profits by the amount of the variable cost per unit. Inventory is valued at marginal/variable cost under marginal costing.
This document provides an overview of marginal costing. It begins with an introduction to marginal costing, defining it as a technique that differentiates between fixed and variable costs. It then covers key aspects of marginal costing including its meaning, features, advantages, and disadvantages. Examples of how marginal costing can be used for decision making are also provided. The document concludes with sections on absorption costing, the differences between marginal and absorption costing, contribution analysis, break-even analysis, and cost-volume-profit analysis.
This chapter discusses inventory costing methods for manufacturing companies and concepts for measuring production capacity. It describes two main inventory costing methods: variable costing, which expenses fixed manufacturing costs, and absorption costing, which includes fixed costs as inventoriable costs. Absorption costing follows GAAP but variable costing is useful for internal analysis. The chapter also examines four capacity measurement concepts and how the choice of denominator level affects income under absorption costing.
Monte Carl Simulation is a powerful and effective tool when used properly helps to navigate the expected Net Present Value NPV. This presentation helps to improve the pattern to ackowlege onthe Odessa Investment by Decision Dres.
Danshui Plant No. 2 has a one-year contract with Apple to assemble 2.4 million iPhone 4 units but is concerned they will not meet the target as production after 3 months is only 180,000 units. The plant manager Wentao Chen is anxious because operating at this production level results in losses. The document provides production details for 180,000 units in August and calculates variances to determine where costs differ from the standard budget.
Welcome to Chapter 6 of our comprehensive accounting series! In this presentation, we dive into the fascinating world of variable and absorption costing, exploring the principles and techniques behind cost allocation in financial reporting.Through this presentation, we aim to equip students and professionals alike with a solid understanding of variable and absorption costing, enabling them to make informed financial decisions.By examining real-world examples and case studies, we provide practical insights into the application of variable and absorption costing, ensuring students can effectively apply these concepts in their future careers.Whether you're a student seeking clarity on cost allocation methods or a professional looking to enhance your financial acumen, this presentation will serve as a valuable resource. Access the slides now and deepen your understanding of variable and absorption costing!Remember, knowledge is power, and understanding these fundamental accounting principles will contribute to your success in the complex world of finance. Happy learning!
This document contains a project report on break even point analysis submitted by students of the Department of Business Management. It includes an index, introduction, definition of break even analysis, calculation of break even point using the equation technique, examples of break even point calculations, importance of break even analysis, assumptions of break even analysis, margin of safety, and advantages and disadvantages of break even analysis.
- Marginal costing focuses on variable costs and treats fixed costs as period costs. It is used for short-term decision making.
- Absorption costing assigns both variable and fixed production costs to inventory and cost of goods sold. It is used for external financial reporting.
- Under marginal costing, contribution is calculated as sales revenue minus variable costs. Fixed costs are deducted from contribution to determine profit. This allows managers to focus on the impact of decisions on contribution.
This PowerPoint presentation on variable costing and segment reporting provides a comprehensive overview of these important concepts in managerial accounting. It covers the principles of variable costing, including its advantages and disadvantages, and delves into how variable costing differs from absorption costing. Additionally, the presentation explains the importance of segment reporting in evaluating the financial performance of different business segments within an organization. It includes examples, case studies, and visual aids to enhance understanding and engagement.
This document discusses overhead absorption and absorption costing. It begins by defining overhead absorption as the amount of indirect costs assigned to cost objects. It then outlines the steps in overhead absorption, which include classifying indirect costs, aggregating costs into cost pools, determining allocation bases, and assigning overhead. The document contrasts absorption costing with variable costing and explains how absorption costing complies with GAAP by including fixed overhead costs in inventory valuation. It provides an example of calculating overhead absorption rates for a company. Big companies like Tesla also use overhead absorption to allocate indirect production costs. Under- or over-absorption of overhead can occur if actual overhead costs differ from estimated costs or output levels.
Marginal costing is a technique that differentiates between fixed and variable costs. It assigns only variable costs to cost units and writes off fixed costs for the period against total contribution. Contribution is calculated as sales revenue minus variable costs. Marginal costing is useful for decision making as it shows the effect on profit of changes in volume or product mix. Key aspects include classifying costs, calculating contribution, and using contribution to determine the break-even point where total revenues equal total costs. Marginal costing provides information on product and segment profitability without needing to allocate fixed overhead costs.
The document discusses operational auditing and concepts related to evaluating organizational effectiveness and efficiency. It defines operational auditing as evaluating the effectiveness and/or efficiency of operations, with effectiveness referring to accomplishing objectives and efficiency meaning reducing costs without reducing effectiveness. Economy is defined as maximizing the use of limited resources to achieve goals. Examples of types of inefficiency include acquiring goods and services too costly, lack of bids for purchases, raw materials not being available when needed, duplication of employee efforts, and work being done that serves no purpose.
Cost, volume, profit Analysis. for decision makingHAFIDHISAIDI1
Part 1 discusses different cost behaviors such as fixed, variable, and semi-variable costs. It also covers topics like direct vs indirect costs, marginal costing, and operational gearing.
Part 2 is about cost-volume-profit (CVP) analysis. It discusses how CVP is used to determine the break-even point and analyze how costs and profits are affected by changes in sales volume. The assumptions of CVP analysis and formulas for calculating the break-even point in terms of units and sales volume are also presented.
Break even analysis- A Comprehensive and Clear DescriptionShyama Shankar
Break-even analysis is one of the most important concepts in management-accounting that enables the management to calculate production costs accurately and avoid wastage. It relates volume with profits at different levels and helps the company to fix price accordingly.
The document discusses various types of costs including direct costs, indirect costs, fixed costs, variable costs, and mixed costs. It defines costs and provides examples of each cost classification. It also covers topics like contribution margin, break-even point, and how they are calculated using equations and graphical methods. The document is intended to educate people on finance and accounting concepts related to costs.
Farmers can produce crops using different combinations of capital and labor. In the US, crops are typically grown using capital-intensive technology, while in developing countries crops are grown using more labor-intensive production. Isoquants can show the different options for crop production using different amounts of capital and labor.
The document discusses marginal costing and profit planning concepts. It defines key terms like marginal cost, fixed cost, variable cost, and contribution margin. It provides the formulas to calculate break-even point in units and sales revenue. It also explains how to use contribution margin ratio and profit-volume analysis to determine break-even sales and the impact of changes in price, costs or sales on profits.
The document discusses marginal costing, which involves differentiating total costs into fixed and variable costs. It defines marginal cost as the change in total cost from producing one additional unit of output. It also discusses the advantages of marginal costing, including that it provides better information for decision making by separating fixed and variable costs. Finally, it provides formulas for calculating break-even point, contribution, and profit using marginal costing techniques.
Similar to Chapter 9 marginal and absorption costing (20)
Economic Risk Factor Update: June 2024 [SlideShare]Commonwealth
May’s reports showed signs of continued economic growth, said Sam Millette, director, fixed income, in his latest Economic Risk Factor Update.
For more market updates, subscribe to The Independent Market Observer at https://blog.commonwealth.com/independent-market-observer.
KYC Compliance: A Cornerstone of Global Crypto Regulatory FrameworksAny kyc Account
This presentation explores the pivotal role of KYC compliance in shaping and enforcing global regulations within the dynamic landscape of cryptocurrencies. Dive into the intricate connection between KYC practices and the evolving legal frameworks governing the crypto industry.
Falcon stands out as a top-tier P2P Invoice Discounting platform in India, bridging esteemed blue-chip companies and eager investors. Our goal is to transform the investment landscape in India by establishing a comprehensive destination for borrowers and investors with diverse profiles and needs, all while minimizing risk. What sets Falcon apart is the elimination of intermediaries such as commercial banks and depository institutions, allowing investors to enjoy higher yields.
How Poonawalla Fincorp and IndusInd Bank’s Co-Branded RuPay Credit Card Cater...beulahfernandes8
The eLITE RuPay Platinum Credit Card, a strategic collaboration between Poonawalla Fincorp and IndusInd Bank, represents a significant advancement in India's digital financial landscape. Spearheaded by Abhay Bhutada, MD of Poonawalla Fincorp, the card leverages deep customer insights to offer tailored features such as no joining fees, movie ticket offers, and rewards on UPI transactions. IndusInd Bank's solid banking infrastructure and digital integration expertise ensure seamless service delivery in today's fast-paced digital economy. With a focus on meeting the growing demand for digital financial services, the card aims to cater to tech-savvy consumers and differentiate itself through unique features and superior customer service, ultimately poised to make a substantial impact in India's digital financial services space.
What Lessons Can New Investors Learn from Newman Leech’s Success?Newman Leech
Newman Leech's success in the real estate industry is based on key lessons and principles, offering practical advice for new investors and serving as a blueprint for building a successful career.
An accounting information system (AIS) refers to tools and systems designed for the collection and display of accounting information so accountants and executives can make informed decisions.
Every business, big or small, deals with outgoing payments. Whether it’s to suppliers for inventory, to employees for salaries, or to vendors for services rendered, keeping track of these expenses is crucial. This is where payment vouchers come in – the unsung heroes of the accounting world.
In World Expo 2010 Shanghai – the most visited Expo in the World History
https://www.britannica.com/event/Expo-Shanghai-2010
China’s official organizer of the Expo, CCPIT (China Council for the Promotion of International Trade https://en.ccpit.org/) has chosen Dr. Alyce Su as the Cover Person with Cover Story, in the Expo’s official magazine distributed throughout the Expo, showcasing China’s New Generation of Leaders to the World.
Discovering Delhi - India's Cultural Capital.pptxcosmo-soil
Delhi, the heartbeat of India, offers a rich blend of history, culture, and modernity. From iconic landmarks like the Red Fort to bustling commercial hubs and vibrant culinary scenes, Delhi's real estate landscape is dynamic and diverse. Discover the essence of India's capital, where tradition meets innovation.
Fabular Frames and the Four Ratio ProblemMajid Iqbal
Digital, interactive art showing the struggle of a society in providing for its present population while also saving planetary resources for future generations. Spread across several frames, the art is actually the rendering of real and speculative data. The stereographic projections change shape in response to prompts and provocations. Visitors interact with the model through speculative statements about how to increase savings across communities, regions, ecosystems and environments. Their fabulations combined with random noise, i.e. factors beyond control, have a dramatic effect on the societal transition. Things get better. Things get worse. The aim is to give visitors a new grasp and feel of the ongoing struggles in democracies around the world.
Stunning art in the small multiples format brings out the spatiotemporal nature of societal transitions, against backdrop issues such as energy, housing, waste, farmland and forest. In each frame we see hopeful and frightful interplays between spending and saving. Problems emerge when one of the two parts of the existential anaglyph rapidly shrinks like Arctic ice, as factors cross thresholds. Ecological wealth and intergenerational equity areFour at stake. Not enough spending could mean economic stress, social unrest and political conflict. Not enough saving and there will be climate breakdown and ‘bankruptcy’. So where does speculative design start and the gambling and betting end? Behind each fabular frame is a four ratio problem. Each ratio reflects the level of sacrifice and self-restraint a society is willing to accept, against promises of prosperity and freedom. Some values seem to stabilise a frame while others cause collapse. Get the ratios right and we can have it all. Get them wrong and things get more desperate.
Discover the Future of Dogecoin with Our Comprehensive Guidance36 Crypto
Learn in-depth about Dogecoin's trajectory and stay informed with 36crypto's essential and up-to-date information about the crypto space.
Our presentation delves into Dogecoin's potential future, exploring whether it's destined to skyrocket to the moon or face a downward spiral. In addition, it highlights invaluable insights. Don't miss out on this opportunity to enhance your crypto understanding!
https://36crypto.com/the-future-of-dogecoin-how-high-can-this-cryptocurrency-reach/
1. 10/1/21, 11:14 PM Chapter 9: Marginal and absorption costing
https://kfknowledgebank.kaplan.co.uk/acca/chapter-9-marginal-and-absorption-costing 1/11
Home Kaplan Financial Kaplan Publishing +44 (0)161 259 7400
Contents [Hide]
1 Chapter 9: Marginal and absorption costing
Chapter 9: Marginal and absorption costing
Chapter learning objectives
Upon completion of this chapter you will be able to:
explain the importance of, and apply, the concept of contribution
demonstrate and discuss the effect of absorption and marginal costing on inventory valuation and profit determination
calculate profit or loss under absorption and marginal costing
reconcile the profits or losses calculated under absorption and marginal costing
describe the advantages and disadvantages of absorption and marginal costing
1 Marginal costing
The marginal cost of an item is its variable cost. The marginalproduction cost of an item is the sum of its direct materials cost,direct labour cost, direct expenses cost (if any) and
variableproduction overhead cost. So as the volume of production and salesincreases total variable costs rise proportionately.
Fixed costs, in contrast are cost that remain unchanged in a time period, regardless of the volume of production and sale.
Marginal production cost is the part of the cost of one unit of productor service which would be avoided if that unit were not produced, orwhich would increase if one extra
unit were produced.
From this we can develop the following definition of marginal costing as used in management accounting:
Marginal costing is the accounting system in which variable costsare charged to cost units and fixed costs of the period are written offin full against the aggregate contribution.
Note that variable costs are those which change as output changes– these are treated under marginal costing as costs of the product.Fixed costs, in this system, are treated
as costs of the period.
Marginal costing is also the principal costing technique used indecision making. The key reason for this is that the marginal costingapproach allows management's attention to
be focussed on the changeswhich result from the decision under consideration.
The contribution concept
The contribution concept lies at the heart of marginal costing. Contribution can be calculated as follows.
Contribution = Sales price – Variable costs
Illustration 1 – The concept of contribution
The following information relates to a company that makes a singleproduct, a specialist lamp, which is used in the diamond-cuttingbusiness.
Search
2. 10/1/21, 11:14 PM Chapter 9: Marginal and absorption costing
https://kfknowledgebank.kaplan.co.uk/acca/chapter-9-marginal-and-absorption-costing 2/11
Fixed costs have been estimated to be $120,000 based on a production level of 1,200 lamps.
Let us look at the costs and revenues involved when different volumes of lamps are sold.
We can see that the profit per lamp has increased from $100 when 1,200 lamps are sold to $120 when 1,500 lamps are sold.
This is because all of the variable costs (direct materials, direct labour, direct expenses and variable overheads) have increased but the fixed costs have remained constant
at $120,000.
Based on what we have seen above, the idea of profit is not aparticularly useful one as it depends on how many units are sold. Forthis reason, the contribution concept is
frequently employed bymanagement accountants.
Contribution gives an idea of how much 'money' there is available to 'contribute' towards paying for the overheads of the organisation.
At varying levels of output and sales, contribution per unit is constant.
At varying levels of output and sales, profit per unit varies.
Total contribution = Contribution per unit x Sales volume.
Profit = Total contribution – Fixed overheads.
Test your understanding 1
Buhner Ltd makes only one product, the cost card of which is:
3. 10/1/21, 11:14 PM Chapter 9: Marginal and absorption costing
https://kfknowledgebank.kaplan.co.uk/acca/chapter-9-marginal-and-absorption-costing 3/11
The selling price of one unit is $21.
Budgeted fixed overheads are based on budgeted production of 5,000units. Opening inventory was 1,000 units and closing inventory was 4,000units.
Sales during the period were 3,000 units and actual fixed production overheads incurred were $25,000.
(a) Calculate the total contribution earned during the period.
(b) Calculate the total profit or loss for the period.
2 Absorption costing
The principles of absorption costing have been discussed in the previous chapter – Accounting for overheads.
Absorption costing is a method of building up a full product cost whichadds direct costs and a proportion of production overhead costs bymeans of one or a number of
overhead absorption rates.
3 The effect of absorption and marginal costing on inventory valuation and profit determination
Absorption and marginal costing
Marginal costing values inventory at the total variable production cost of a unit of product.
Absorption costing values inventory at the full production cost of a unit of product.
Inventory values will therefore be different at the beginning and end of a period under marginal and absorption costing.
If inventory values are different, then this will have an effect on profits reported in the income statement in a period. Profits determined using marginal costing principles will
therefore be different to those using absorption costing principles.
Absorption costing income statement
In order to be able to prepare income statements under absorptioncosting, you need to be able to complete the following proforma.
Absorption costing income statement
4. 10/1/21, 11:14 PM Chapter 9: Marginal and absorption costing
https://kfknowledgebank.kaplan.co.uk/acca/chapter-9-marginal-and-absorption-costing 4/11
Valuation of inventory – opening and closing inventory are valued at full production cost under absorption costing.
Under/over-absorbed overhead – an adjustment for under or over absorption of overheads is necessary in absorption costing income statements.
Marginal costing income statement
In order to be able to prepare income statements under marginal costing, you need to be able to complete the following proforma.
Marginal costing income statement
Valuation of inventory – opening and closing inventory are valued at marginal (variable) cost under marginal costing.
The fixed costs actually incurred are deducted from contribution earned in order to determine the profit for the period.
Illustration 2 – Effects of absorption and marginal costing
A company commenced business on 1 March making one product only, the cost card of which is as follows:
The fixed production overhead figure has been calculated on thebasis of a budgeted normal output of 36,000 units per annum. The fixedproduction overhead incurred in March
was $15,000 each month.
Selling, distribution and administration expenses are:
5. 10/1/21, 11:14 PM Chapter 9: Marginal and absorption costing
https://kfknowledgebank.kaplan.co.uk/acca/chapter-9-marginal-and-absorption-costing 5/11
The selling price per unit is $35 and the number of units produced and sold were:
Prepare the absorption costing and marginal costing income statements for March.
Absorption costing income statement – March
Marginal costing income statement – March
6. 10/1/21, 11:14 PM Chapter 9: Marginal and absorption costing
https://kfknowledgebank.kaplan.co.uk/acca/chapter-9-marginal-and-absorption-costing 6/11
Solution
Solution
Absorption costing income statement – March
Workings
(W1)
(W2)
Marginal costing income statement - March
7. 10/1/21, 11:14 PM Chapter 9: Marginal and absorption costing
https://kfknowledgebank.kaplan.co.uk/acca/chapter-9-marginal-and-absorption-costing 7/11
Test your understanding 2
Duo Ltd makes and sells two products, Alpha and Beta. The following information is available for period 3:
Fixed production overheads for the period were $105,000 and fixed administration overheads were $27,000.
Required:
(a) Prepare an income statement for period 3 based on marginal costing principles.
(b) Prepare an income statement for period 3 based on absorption costing principles.
Reconciling profits reported under the different methods
When inventory levels increase or decrease during a period then profits differ under absorption and marginal costing.
If inventory levels increase, absorption costing gives the higher profit.
This is because fixed overheads held in closing inventory arecarried forward (thereby reducing cost of sales) to the next accountingperiod instead of being written off in the
current accounting period (asa period cost, as in marginal costing).
If inventory levels decrease, marginal costing gives the higher profit.
This is because fixed overhead brought forward in openinginventory is released, thereby increasing cost of sales and reducingprofits.
If inventory levels are constant, both methods give the same profit.
8. 10/1/21, 11:14 PM Chapter 9: Marginal and absorption costing
https://kfknowledgebank.kaplan.co.uk/acca/chapter-9-marginal-and-absorption-costing 8/11
Illustration 3 – Effects of absorption and marginal costing
A company commenced business on 1 March making one product only, the cost card of which is as follows.
Marginal cost of production = $(5 + 8 + 2) = $15
Full cost of production = $20 (as above)
Difference in cost of production = $5 which is the fixed production overhead element of the full production cost.
This means that each unit of opening and closing inventory will be valued at $5 more under absorption costing.
The number of units produced and sold was as follows.
Closing inventory at the end of March is the difference between thenumber of units produced and the number of units sold, i.e. 500 units(2,000 – 1,500).
Loss for March under absorption costing = $375 (as calculated in Illustration 2).
Loss for March under marginal costing = $2,875 (as calculated in Illustration 2).
Difference in loss (profits) = $2,875 – $375 = $2,500.
This difference can be analysed as being due to the fixed overhead held in inventory, i.e. 500 units of inventory 'holding' $5 fixed overhead per unit.
500 x $5 = $2,500 which is the difference between the profit in the profit statements under the different costing methods for March.
In an exam question you may be told the profit under eithermarginal or absorption costing and be asked to calculate the alternativeprofit for the information provided.
There is a short cut to reconciling the profits:
Test your understanding 3
(a) In a period where opening inventorywas 5,000 units and closing inventory was 3,000 units, a company had aprofit of $92,000 using absorption costing. If the fixed
overheadabsorption rate was $9 per unit, calculate the profit using marginalcosting.
(b) When opening inventory was 8,500litres and closing inventory was 6,750 litres, a company had a profit of$62,100 using marginal costing. The fixed overhead absorption
rate was$3 per litre. Calculate the profit using absorption costing.
4 The advantages and disadvantages of absorption and marginal costing
Advantages and disadvantages of absorption and marginal costing
9. 10/1/21, 11:14 PM Chapter 9: Marginal and absorption costing
https://kfknowledgebank.kaplan.co.uk/acca/chapter-9-marginal-and-absorption-costing 9/11
The main disadvantages of marginal costing are that closing inventory is not valued in accordance with SSAP 9 principles and that fixed production overheads are not
'shared' out between units of production, but written off in full instead.
The main disadvantages of absorption costing are that it is more complex to operate than marginal costing and it does not provide any useful information for decision making
(like marginal costing does).
5 Chapter summary
Test your understanding answers
Test your understanding 1
(a) Total variable costs = $(3 + 6 + 2 + 5) = $16
Contribution per unit (selling price less total variable costs) = $21 – $16 = $5
Total contribution earned = 3,000 x $5 = $15,000
(b) Total profit/(loss) = Total contribution – Fixed production overheads incurred
= $(15,000 – 25,000)
= $(10,000)
Test your understanding 2
(a)
10. 10/1/21, 11:14 PM Chapter 9: Marginal and absorption costing
https://kfknowledgebank.kaplan.co.uk/acca/chapter-9-marginal-and-absorption-costing 10/11
Working
Test your understanding 3
(a)
Since inventory levels have fallen in the period, marginalcosting shows the higher profit figure, therefore marginal costingprofit will be $18,000 higher than the absorption costing
profit, i.e.$110,000.
(b)
11. 10/1/21, 11:14 PM Chapter 9: Marginal and absorption costing
https://kfknowledgebank.kaplan.co.uk/acca/chapter-9-marginal-and-absorption-costing 11/11
Useful Information
Give Us Your Feedback
Privacy and Cookie
Information
Cookie Preferences
Terms & Conditions
Related Free Resources
Kaplan Blog
Kaplan Business in the
UK
Kaplan Financial
Kaplan Publishing
Kaplan LPD
This Product includes content from the International
Auditing and Assurance Standards Board (IAASB)
and the International Ethics Standards Board for
Accountants (IESBA), published by the International
Federation of Accountants (IFAC) in December 2012
and is used with permission of IFAC.
Inventory levels have fallen in the period and therefore marginalcosting profits will be higher than absorption costing profits.Absorption costing profit is therefore $5,250 less than
the marginalcosting profit.
Kaplan Financial Limited. Copyright 2020.