Chapter 2 Graph
•
0 likes•301 views
C
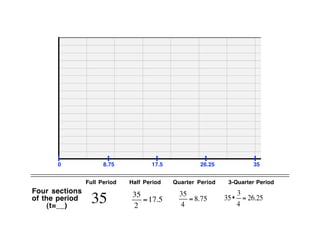
cfkThe document contains graphs that are divided into four sections of a full period. The graphs show lines that increase at quarter period intervals and contain minimum values at those intervals, with the last section showing a minimum value of 151.
Report
Share
Report
Share
Download to read offline

Recommended
Inequalities
This document provides information and examples about solving inequalities:
1) It gives examples of solving linear equations with one variable and two variables.
2) It explains the symbols used for different inequality types and how to graph them, including shading the correct side of the inequality.
3) It provides rules for solving inequalities, such as reversing the inequality sign when multiplying or dividing both sides by a negative number.
4) Multiple examples are worked through step-by-step of solving and graphing various inequalities with one variable and multiple variables.
Algebra 7 Point 5
This document discusses two special cases for factoring expressions: the difference of two squares and perfect square trinomials. It provides examples of factoring expressions using the difference of two squares formula a2 - b2 = (a + b)(a - b). It also covers recognizing and factoring perfect square trinomials using the forms (a + b)2 and (a - b)2. Exercises are provided to practice these factoring techniques.
Exercise #13 notes ~ graphing
This document provides instructions for graphing trigonometric transformations in 3 steps: 1) Determine the a, b, c, and d values from the function's factored form. 2) Draw the median position and amplitude. 3) Determine the period and mark points to graph the wave-like function. Examples graph y=3sin(2x)-1, f(x)=sin(1/2x+1), and f(x)=2cos(3x)-2.
Derivative and graphing
The document discusses how to use the first derivative to find maximums, minimums, and points of inflection on a graph. It provides rules for determining if a graph is increasing or decreasing based on the sign of the derivative. To find critical points, set the derivative equal to zero and solve for x. Then test points on either side of x to determine if the point is a relative maximum or minimum. Examples demonstrate finding the critical points and classifying them.
Lecture 16
The document discusses randomized incremental construction, a technique for building geometric structures by incrementally adding elements in random order. It provides examples like computing the convex hull of a set of points. The key ideas are using a conflict graph to track inconsistencies and resolving them in random order, resulting in an expected linear time algorithm. The technique can be applied to problems like computing the smallest enclosing sphere of a point set.
Calc 3.6b
This document provides examples of analyzing and graphing various functions based on their derivatives. It examines six examples: a radical function, polynomial function, trigonometric function. For each, it identifies the first and second derivatives, domain, x-intercepts, y-intercepts, asymptotes, critical numbers, possible points of inflection, and symmetry. It then analyzes the characteristics of each function graph based on the values and signs of the function, first derivative and second derivative over intervals of the domain.
Chapter 1.4 Opposites, Integers & Absolute Value
The document provides an agenda for an October 28 math class. It includes a do now, homework check on integers and absolute value using a Frayer model vocabulary template, and homework assignments from a pre-algebra textbook. Expressions are categorized as variable expressions, numerical expressions, or variables. Ways to write multiplication and division are demonstrated, along with examples of evaluating variable expressions by substituting values for variables. Vocabulary on evaluating, integers, opposite numbers, and absolute value are defined using Frayer models.
3.3 graphs of exponential functions
This document discusses exponential functions including:
- Exponential growth graphs move away from the x-axis quickly when b > 1, while decay graphs move towards it when 0 < b < 1. Both have a y-intercept of (0, a).
- Functions of the form y = a(b)x have a horizontal asymptote at y = 0.
- The domain is the set of all input values x, while the range is the set of all output values y.
- Examples are provided of identifying growth/decay, domain, range, asymptotes and y-intercepts of exponential functions. Graphing techniques including making tables and connecting points with smooth curves are also outlined.
Grading system using t score by Excel
This document provides instructions for converting a raw score on a test to a normalized T-score and percentile using Microsoft Excel. The steps include: 1) Entering raw score data and sample size, 2) Sorting data, 3) Calculating cumulative frequency and percentile rank, 4) Looking up percentile from a norms table, 5) Calculating normalized T-score. The document includes examples and screenshots to demonstrate the process.
Example 2
The document describes trends in CD and total revenue from 1990 to 2008. CD sales followed a quadratic function, peaking at 5000 in 1999 and declining to 0 by 2005. Ticket sales followed a linear function, declining from 1.5 to 0 from 1999 to 2005. Total revenue was modeled as a composite function of CD and ticket sales multiplied by 1.04 to the power of t, representing a 4% annual increase. When graphed from 1990 to 2008, total revenue increased until peaking around $24,000 from 2000 to 2001 before declining.
8.1 exponential growth
This document defines and explains exponential functions, which are functions that include the expression bx where b is a positive number other than 1. It discusses the shape of exponential graphs, asymptotes, graphing the general forms y=abx and y=a(b^x)+h+k, exponential growth models, and compound interest formulas. Examples are provided to illustrate key concepts.
Zero & Negative Exponents
The document discusses zero and negative exponents. It states that for any nonzero number a, a0 = 1. It also states that for any nonzero number a and integer n, a-n = 1/an. Finally, it discusses how to rewrite expressions with negative exponents so that all exponents are positive by moving the base with the negative exponent to the denominator.
Ch32 26
The document discusses binomial probability distributions with N=10 trials, n=5 successes and probability of success p=0.3. It provides the formulas and calculations to find: (a) the probability of exactly 3 successes, P(X=3), (b) the probability of 2 or fewer successes, P(X≤2), (c) the expected value, E(X), and (d) the variance, V(X).
How to test
To solve a quadratic equation by completing the square, rewrite the left side in the form of x^2 + bx, add (b/2)^2 to both sides to create a perfect square on the left, then take the square root of both sides. To solve by the quadratic formula, identify the coefficients a, b, and c and plug them into the formula x = (-b ± √(b^2 - 4ac)) / 2a to find the solutions.
8.1 Powerpoint
The document discusses using the superposition principle to add functions. It provides an example of finding the total cost function C(n), revenue function R(n), and profit function P(n) for selling zombie merchandise. The functions C(n)=200+5n and R(n)=8n are graphed and their point of intersection represents the number of items that must be sold for revenue to equal cost. The profit function is defined as P(n)=R(n)-C(n)=3n-200 and graphed. It is determined that at least 68 items must be sold to avoid a loss and start making a profit.
strassen matrix multiplication algorithm
Strassen's algorithm improves upon the standard matrix multiplication algorithm by using divide and conquer and only requiring 7 recursive multiplications to multiply 2x2 submatrices rather than 8. This results in a running time of O(n^2.81) rather than O(n^3) for large matrix sizes. The algorithm divides the matrices into submatrices, recursively multiplies the submatrices using 7 intermediate terms rather than relying on the commutativity of multiplication, and combines the results. While the improvement may seem small, the reduced exponent means Strassen's algorithm performs better than the standard algorithm for matrices larger than about 32x32 due to the impact of the exponent on runtime.
Nivel de complejidad ejemplo
This document outlines population projections for a municipal headquarter using the geometric method.
It provides historical population figures from 2010, 2014, and 2018.
Using the geometric method formula, it projects the population in 2026 to be 18,540 inhabitants, in 2036 to be 27,758 inhabitants, and in 2042 to be 33,288 inhabitants.
Integrals
The document discusses integrals and how they are the reverse operation of derivatives. It explains that integrals calculate the area under a curve, while derivatives calculate the slope of a tangent line. The document also provides an example of how to integrate by taking the reverse of derivatives, and includes two example problems and their solutions.
Alg2 lesson 7-2
The document describes how to graph a function by making a table of x and f(x) values, determining where the function crosses the x-axis to find zeros, and estimating relative maximum and minimum points. It provides an example table with values for x from -4 to 5 and the corresponding f(x) values. There are zeros between x = -2 and -1, -1 and 0, 0 and 1, and 2 and 3. The relative maximum occurs at x = 0 and the relative minimum at x = 3.
Special factor patterns
The document provides examples and rules for factoring different types of expressions:
1) It shows how to factor expressions of the form a^2 - b^2 into (a+b)(a-b) and gives an example.
2) It explains how to factor square trinomials of the form x^2 + bx + c by finding two factors of c that sum to b.
3) It discusses factoring expressions involving squares and how exponents work.
Class7 calculus i
The document appears to be notes from a calculus workshop or class covering several topics:
- Conic sections and putting equations into standard form.
- Quadric surfaces and their applications in physics for cooling towers.
- Limits, derivatives, integrals, and their definitions and applications in physics for concepts like velocity and acceleration.
- Substitution techniques for integrals and trigonometric substitutions.
- Riemann sums and using them to define the definite integral.
- References are provided for further reading on topics like quadric surfaces, conic sections, derivatives and integrals, and their uses in physics.
Khoirul bariansyah
This document contains examples of cube numbers from 1 to 10 and their calculations. It also shows a basic Python code to print cube numbers until a given number is exceeded. Finally, it lists the formulas for calculating the perimeter of some basic shapes like rectangles, squares, and triangles.
Module 12 topic 1 notes
The document discusses exponential functions of the form y = a(b)x and provides examples of exponential growth and decay. It explains that exponential growth occurs when b is greater than 1 and exponential decay occurs when b is between 0 and 1. The document also contains an example of using an exponential decay function to model and predict the number of farms in Minnesota between 1983 and 2010, assuming a 2% annual decline.
Solving Quadratics
The document discusses three forms of quadratic equations - standard form, vertex form, and intercept form. It provides the definitions and formulas for each form. It then explains how to graph each form by identifying key features of the equation, finding important points like the vertex, axis of symmetry, intercepts, and connecting points to sketch the parabolic curve. Graphing techniques include using the value of a to determine the opening direction, using b and c for standard form, using h and k for vertex form, and using p and q for intercepts form.
Day 9 examples u1w14
The document discusses how to graph the square root of a function f(x). It notes that invariant points where the graph of √f(x) overlaps with f(x) occur when f(x) equals 0 or 1. To graph √f(x), one locates any invariant points, draws the graph above f(x) between those points, and adds any other points for perfect squares, connecting them with a smooth curve below the graph of f(x).
Day 2 examples u2f13
The document discusses how to graph the square root of a function f(x). It explains that the square root of f(x) is below the graph of f(x), except at invariant points where f(x) equals 0 or 1. It provides examples of graphing the square root of functions like f(x), g(x), h(x), and p(x) by locating invariant points, drawing the graph above f(x) between those points, and sketching a smooth curve below f(x) between key points at perfect squares.
Chapter 4
This document provides steps to solve a trigonometric identity involving logarithms. It breaks the problem down into solving the logarithm and proving the resulting identity. To solve the logarithm, it simplifies the base, base of the argument, and sets the logarithm equal to the exponent of the argument. This reduces the identity. The final steps prove the identity by separately solving each side of the reduced identity using trigonometric identities and properties.
conduciendo por bolivia
The document discusses a mountainous highway in Bolivia called Stremnaya Road that is nicknamed "the road of death". It is a dangerous road situated in Bolivia that winds through mountainous terrain. Driving on this road is risky due to its steep cliffs and lack of safety features.
More Related Content
What's hot
Grading system using t score by Excel
This document provides instructions for converting a raw score on a test to a normalized T-score and percentile using Microsoft Excel. The steps include: 1) Entering raw score data and sample size, 2) Sorting data, 3) Calculating cumulative frequency and percentile rank, 4) Looking up percentile from a norms table, 5) Calculating normalized T-score. The document includes examples and screenshots to demonstrate the process.
Example 2
The document describes trends in CD and total revenue from 1990 to 2008. CD sales followed a quadratic function, peaking at 5000 in 1999 and declining to 0 by 2005. Ticket sales followed a linear function, declining from 1.5 to 0 from 1999 to 2005. Total revenue was modeled as a composite function of CD and ticket sales multiplied by 1.04 to the power of t, representing a 4% annual increase. When graphed from 1990 to 2008, total revenue increased until peaking around $24,000 from 2000 to 2001 before declining.
8.1 exponential growth
This document defines and explains exponential functions, which are functions that include the expression bx where b is a positive number other than 1. It discusses the shape of exponential graphs, asymptotes, graphing the general forms y=abx and y=a(b^x)+h+k, exponential growth models, and compound interest formulas. Examples are provided to illustrate key concepts.
Zero & Negative Exponents
The document discusses zero and negative exponents. It states that for any nonzero number a, a0 = 1. It also states that for any nonzero number a and integer n, a-n = 1/an. Finally, it discusses how to rewrite expressions with negative exponents so that all exponents are positive by moving the base with the negative exponent to the denominator.
Ch32 26
The document discusses binomial probability distributions with N=10 trials, n=5 successes and probability of success p=0.3. It provides the formulas and calculations to find: (a) the probability of exactly 3 successes, P(X=3), (b) the probability of 2 or fewer successes, P(X≤2), (c) the expected value, E(X), and (d) the variance, V(X).
How to test
To solve a quadratic equation by completing the square, rewrite the left side in the form of x^2 + bx, add (b/2)^2 to both sides to create a perfect square on the left, then take the square root of both sides. To solve by the quadratic formula, identify the coefficients a, b, and c and plug them into the formula x = (-b ± √(b^2 - 4ac)) / 2a to find the solutions.
8.1 Powerpoint
The document discusses using the superposition principle to add functions. It provides an example of finding the total cost function C(n), revenue function R(n), and profit function P(n) for selling zombie merchandise. The functions C(n)=200+5n and R(n)=8n are graphed and their point of intersection represents the number of items that must be sold for revenue to equal cost. The profit function is defined as P(n)=R(n)-C(n)=3n-200 and graphed. It is determined that at least 68 items must be sold to avoid a loss and start making a profit.
strassen matrix multiplication algorithm
Strassen's algorithm improves upon the standard matrix multiplication algorithm by using divide and conquer and only requiring 7 recursive multiplications to multiply 2x2 submatrices rather than 8. This results in a running time of O(n^2.81) rather than O(n^3) for large matrix sizes. The algorithm divides the matrices into submatrices, recursively multiplies the submatrices using 7 intermediate terms rather than relying on the commutativity of multiplication, and combines the results. While the improvement may seem small, the reduced exponent means Strassen's algorithm performs better than the standard algorithm for matrices larger than about 32x32 due to the impact of the exponent on runtime.
Nivel de complejidad ejemplo
This document outlines population projections for a municipal headquarter using the geometric method.
It provides historical population figures from 2010, 2014, and 2018.
Using the geometric method formula, it projects the population in 2026 to be 18,540 inhabitants, in 2036 to be 27,758 inhabitants, and in 2042 to be 33,288 inhabitants.
Integrals
The document discusses integrals and how they are the reverse operation of derivatives. It explains that integrals calculate the area under a curve, while derivatives calculate the slope of a tangent line. The document also provides an example of how to integrate by taking the reverse of derivatives, and includes two example problems and their solutions.
Alg2 lesson 7-2
The document describes how to graph a function by making a table of x and f(x) values, determining where the function crosses the x-axis to find zeros, and estimating relative maximum and minimum points. It provides an example table with values for x from -4 to 5 and the corresponding f(x) values. There are zeros between x = -2 and -1, -1 and 0, 0 and 1, and 2 and 3. The relative maximum occurs at x = 0 and the relative minimum at x = 3.
Special factor patterns
The document provides examples and rules for factoring different types of expressions:
1) It shows how to factor expressions of the form a^2 - b^2 into (a+b)(a-b) and gives an example.
2) It explains how to factor square trinomials of the form x^2 + bx + c by finding two factors of c that sum to b.
3) It discusses factoring expressions involving squares and how exponents work.
Class7 calculus i
The document appears to be notes from a calculus workshop or class covering several topics:
- Conic sections and putting equations into standard form.
- Quadric surfaces and their applications in physics for cooling towers.
- Limits, derivatives, integrals, and their definitions and applications in physics for concepts like velocity and acceleration.
- Substitution techniques for integrals and trigonometric substitutions.
- Riemann sums and using them to define the definite integral.
- References are provided for further reading on topics like quadric surfaces, conic sections, derivatives and integrals, and their uses in physics.
Khoirul bariansyah
This document contains examples of cube numbers from 1 to 10 and their calculations. It also shows a basic Python code to print cube numbers until a given number is exceeded. Finally, it lists the formulas for calculating the perimeter of some basic shapes like rectangles, squares, and triangles.
Module 12 topic 1 notes
The document discusses exponential functions of the form y = a(b)x and provides examples of exponential growth and decay. It explains that exponential growth occurs when b is greater than 1 and exponential decay occurs when b is between 0 and 1. The document also contains an example of using an exponential decay function to model and predict the number of farms in Minnesota between 1983 and 2010, assuming a 2% annual decline.
Solving Quadratics
The document discusses three forms of quadratic equations - standard form, vertex form, and intercept form. It provides the definitions and formulas for each form. It then explains how to graph each form by identifying key features of the equation, finding important points like the vertex, axis of symmetry, intercepts, and connecting points to sketch the parabolic curve. Graphing techniques include using the value of a to determine the opening direction, using b and c for standard form, using h and k for vertex form, and using p and q for intercepts form.
Day 9 examples u1w14
The document discusses how to graph the square root of a function f(x). It notes that invariant points where the graph of √f(x) overlaps with f(x) occur when f(x) equals 0 or 1. To graph √f(x), one locates any invariant points, draws the graph above f(x) between those points, and adds any other points for perfect squares, connecting them with a smooth curve below the graph of f(x).
Day 2 examples u2f13
The document discusses how to graph the square root of a function f(x). It explains that the square root of f(x) is below the graph of f(x), except at invariant points where f(x) equals 0 or 1. It provides examples of graphing the square root of functions like f(x), g(x), h(x), and p(x) by locating invariant points, drawing the graph above f(x) between those points, and sketching a smooth curve below f(x) between key points at perfect squares.
What's hot (18)
Viewers also liked
Chapter 4
This document provides steps to solve a trigonometric identity involving logarithms. It breaks the problem down into solving the logarithm and proving the resulting identity. To solve the logarithm, it simplifies the base, base of the argument, and sets the logarithm equal to the exponent of the argument. This reduces the identity. The final steps prove the identity by separately solving each side of the reduced identity using trigonometric identities and properties.
conduciendo por bolivia
The document discusses a mountainous highway in Bolivia called Stremnaya Road that is nicknamed "the road of death". It is a dangerous road situated in Bolivia that winds through mountainous terrain. Driving on this road is risky due to its steep cliffs and lack of safety features.
Algebra
Este documento presenta una serie de operaciones matemáticas básicas como suma, resta, división y multiplicación para enseñar álgebra, pero al final contiene un engaño con un mensaje ofensivo que insta al receptor a enviarlo a otros para vengarse.
Jedi (implicit)
This document summarizes a calculus lesson on implicit differentiation. The lesson began with examples of implied relationships in pictures and led into a discussion of implicit functions hidden within explicit functions. The class then learned how to take the derivative of an implicit function using the example of finding the derivative of any point on a circle. The process involves rewriting the equation in terms of y, applying the chain rule, and solving for the derivative of y. The lesson concluded by emphasizing that the derivative is zero when the numerator is zero, indicating a horizontal tangent line, and when the denominator is zero, indicating a vertical tangent line.
C2M Finale
The document outlines several ministries of Called 2 Ministry.org, including ministries focused on: women aiming to exemplify Proverbs 31 (For Women Only); training godly men to lead their households (For Da Fellaz); guiding young couples to build godly relationships (Couples Ministry); serving young families (Youth Family Life Ministry); spreading the gospel through music (Ps. 150 - Music Ministry); volunteer outreach opportunities (Each One, Reach One!); providing recipes (Kareem's Kuisine); and health and exercise (Fitness Corner). The ministries aim to train and guide people in different stages of life and relationships to serve God.
Winning in Networks (May 2010 Version)
The document discusses the transition to a global digital network era driven by advances in information technology. Key developments include the rise of social media platforms with hundreds of millions of users, the transformation of industries like automobiles which now have computers and connectivity, and the evolution of the music business from physical to digital formats. It argues that businesses must shift from vertical integration to virtual integration based on relationships across networks to succeed in this new environment.
Derivative assignment
D = f(x), the original parent function
B = f'(x), the first derivative of D
A = f''(x), the second derivative of D
This determination is made based on the properties that the derivative is positive when the slope of the parent function is positive, the second derivative is positive when the parent function is concave up, and the second derivative is the derivative of the first derivative. Graphical analysis of the relationships between the graphs of A, B, C and D support this determination.
Venkatraman_MasterClass@CanalPlus
This document summarizes a presentation given by Professor N. Venkatraman on business innovation and transformation opportunities in the media sector. It discusses how emerging technologies like increased bandwidth, connectivity through platforms like Facebook, and mobile access are shifting products, processes and services. It introduces concepts like Moore's Law, Metcalfe's Law and the Bandwidth Law to explain the technology trends driving this change and outlines the challenges of aligning business and technology strategies during times of innovation and transformation.
IT Everywhere--What Does It Mean for Future CIOs
This document discusses how digital technologies are transforming business through five interconnected webs: the mobile web, social web, media web, real-time web, and machine web. It provides examples of how each web is impacting industries and consumer behavior. The presentation raises questions for business leaders about how these shifts are affecting their companies and whether their CIOs are involved in the strategic conversations around digital transformation.
Chapter 2 Solution
The document shows the step-by-step work to solve a multi-step math problem about riders on a ferris wheel. It first finds that Francis and Kieran will get off the ride after 14 minutes, when Wilfred and John are 117 meters high. It then determines it will take another 25 - 14 = 11 more minutes for Wilfred and John to reach the same height of 117 meters again.
Viewers also liked (16)
Recently uploaded
Main news related to the CCS TSI 2023 (2023/1695)
An English 🇬🇧 translation of a presentation to the speech I gave about the main changes brought by CCS TSI 2023 at the biggest Czech conference on Communications and signalling systems on Railways, which was held in Clarion Hotel Olomouc from 7th to 9th November 2023 (konferenceszt.cz). Attended by around 500 participants and 200 on-line followers.
The original Czech 🇨🇿 version of the presentation can be found here: https://www.slideshare.net/slideshow/hlavni-novinky-souvisejici-s-ccs-tsi-2023-2023-1695/269688092 .
The videorecording (in Czech) from the presentation is available here: https://youtu.be/WzjJWm4IyPk?si=SImb06tuXGb30BEH .
Let's Integrate MuleSoft RPA, COMPOSER, APM with AWS IDP along with Slack
Discover the seamless integration of RPA (Robotic Process Automation), COMPOSER, and APM with AWS IDP enhanced with Slack notifications. Explore how these technologies converge to streamline workflows, optimize performance, and ensure secure access, all while leveraging the power of AWS IDP and real-time communication via Slack notifications.
Azure API Management to expose backend services securely
How to use Azure API Management to expose backend service securely
Letter and Document Automation for Bonterra Impact Management (fka Social Sol...
Sidekick Solutions uses Bonterra Impact Management (fka Social Solutions Apricot) and automation solutions to integrate data for business workflows.
We believe integration and automation are essential to user experience and the promise of efficient work through technology. Automation is the critical ingredient to realizing that full vision. We develop integration products and services for Bonterra Case Management software to support the deployment of automations for a variety of use cases.
This video focuses on automated letter generation for Bonterra Impact Management using Google Workspace or Microsoft 365.
Interested in deploying letter generation automations for Bonterra Impact Management? Contact us at sales@sidekicksolutionsllc.com to discuss next steps.
Digital Marketing Trends in 2024 | Guide for Staying Ahead
https://www.wask.co/ebooks/digital-marketing-trends-in-2024
Feeling lost in the digital marketing whirlwind of 2024? Technology is changing, consumer habits are evolving, and staying ahead of the curve feels like a never-ending pursuit. This e-book is your compass. Dive into actionable insights to handle the complexities of modern marketing. From hyper-personalization to the power of user-generated content, learn how to build long-term relationships with your audience and unlock the secrets to success in the ever-shifting digital landscape.
Ocean lotus Threat actors project by John Sitima 2024 (1).pptx
Ocean Lotus cyber threat actors represent a sophisticated, persistent, and politically motivated group that poses a significant risk to organizations and individuals in the Southeast Asian region. Their continuous evolution and adaptability underscore the need for robust cybersecurity measures and international cooperation to identify and mitigate the threats posed by such advanced persistent threat groups.
How to Interpret Trends in the Kalyan Rajdhani Mix Chart.pdf
A Mix Chart displays historical data of numbers in a graphical or tabular form. The Kalyan Rajdhani Mix Chart specifically shows the results of a sequence of numbers over different periods.
Operating System Used by Users in day-to-day life.pptx
Dive into the realm of operating systems (OS) with Pravash Chandra Das, a seasoned Digital Forensic Analyst, as your guide. 🚀 This comprehensive presentation illuminates the core concepts, types, and evolution of OS, essential for understanding modern computing landscapes.
Beginning with the foundational definition, Das clarifies the pivotal role of OS as system software orchestrating hardware resources, software applications, and user interactions. Through succinct descriptions, he delineates the diverse types of OS, from single-user, single-task environments like early MS-DOS iterations, to multi-user, multi-tasking systems exemplified by modern Linux distributions.
Crucial components like the kernel and shell are dissected, highlighting their indispensable functions in resource management and user interface interaction. Das elucidates how the kernel acts as the central nervous system, orchestrating process scheduling, memory allocation, and device management. Meanwhile, the shell serves as the gateway for user commands, bridging the gap between human input and machine execution. 💻
The narrative then shifts to a captivating exploration of prominent desktop OSs, Windows, macOS, and Linux. Windows, with its globally ubiquitous presence and user-friendly interface, emerges as a cornerstone in personal computing history. macOS, lauded for its sleek design and seamless integration with Apple's ecosystem, stands as a beacon of stability and creativity. Linux, an open-source marvel, offers unparalleled flexibility and security, revolutionizing the computing landscape. 🖥️
Moving to the realm of mobile devices, Das unravels the dominance of Android and iOS. Android's open-source ethos fosters a vibrant ecosystem of customization and innovation, while iOS boasts a seamless user experience and robust security infrastructure. Meanwhile, discontinued platforms like Symbian and Palm OS evoke nostalgia for their pioneering roles in the smartphone revolution.
The journey concludes with a reflection on the ever-evolving landscape of OS, underscored by the emergence of real-time operating systems (RTOS) and the persistent quest for innovation and efficiency. As technology continues to shape our world, understanding the foundations and evolution of operating systems remains paramount. Join Pravash Chandra Das on this illuminating journey through the heart of computing. 🌟
Finale of the Year: Apply for Next One!
Presentation for the event called "Finale of the Year: Apply for Next One!" organized by GDSC PJATK
Choosing The Best AWS Service For Your Website + API.pptx
Have you ever been confused by the myriad of choices offered by AWS for hosting a website or an API?
Lambda, Elastic Beanstalk, Lightsail, Amplify, S3 (and more!) can each host websites + APIs. But which one should we choose?
Which one is cheapest? Which one is fastest? Which one will scale to meet our needs?
Join me in this session as we dive into each AWS hosting service to determine which one is best for your scenario and explain why!
Fueling AI with Great Data with Airbyte Webinar
This talk will focus on how to collect data from a variety of sources, leveraging this data for RAG and other GenAI use cases, and finally charting your course to productionalization.
5th LF Energy Power Grid Model Meet-up Slides
5th Power Grid Model Meet-up
It is with great pleasure that we extend to you an invitation to the 5th Power Grid Model Meet-up, scheduled for 6th June 2024. This event will adopt a hybrid format, allowing participants to join us either through an online Mircosoft Teams session or in person at TU/e located at Den Dolech 2, Eindhoven, Netherlands. The meet-up will be hosted by Eindhoven University of Technology (TU/e), a research university specializing in engineering science & technology.
Power Grid Model
The global energy transition is placing new and unprecedented demands on Distribution System Operators (DSOs). Alongside upgrades to grid capacity, processes such as digitization, capacity optimization, and congestion management are becoming vital for delivering reliable services.
Power Grid Model is an open source project from Linux Foundation Energy and provides a calculation engine that is increasingly essential for DSOs. It offers a standards-based foundation enabling real-time power systems analysis, simulations of electrical power grids, and sophisticated what-if analysis. In addition, it enables in-depth studies and analysis of the electrical power grid’s behavior and performance. This comprehensive model incorporates essential factors such as power generation capacity, electrical losses, voltage levels, power flows, and system stability.
Power Grid Model is currently being applied in a wide variety of use cases, including grid planning, expansion, reliability, and congestion studies. It can also help in analyzing the impact of renewable energy integration, assessing the effects of disturbances or faults, and developing strategies for grid control and optimization.
What to expect
For the upcoming meetup we are organizing, we have an exciting lineup of activities planned:
-Insightful presentations covering two practical applications of the Power Grid Model.
-An update on the latest advancements in Power Grid -Model technology during the first and second quarters of 2024.
-An interactive brainstorming session to discuss and propose new feature requests.
-An opportunity to connect with fellow Power Grid Model enthusiasts and users.
Energy Efficient Video Encoding for Cloud and Edge Computing Instances
Energy Efficient Video Encoding for Cloud and Edge Computing Instances
GraphRAG for Life Science to increase LLM accuracy
GraphRAG for life science domain, where you retriever information from biomedical knowledge graphs using LLMs to increase the accuracy and performance of generated answers
Driving Business Innovation: Latest Generative AI Advancements & Success Story
Are you ready to revolutionize how you handle data? Join us for a webinar where we’ll bring you up to speed with the latest advancements in Generative AI technology and discover how leveraging FME with tools from giants like Google Gemini, Amazon, and Microsoft OpenAI can supercharge your workflow efficiency.
During the hour, we’ll take you through:
Guest Speaker Segment with Hannah Barrington: Dive into the world of dynamic real estate marketing with Hannah, the Marketing Manager at Workspace Group. Hear firsthand how their team generates engaging descriptions for thousands of office units by integrating diverse data sources—from PDF floorplans to web pages—using FME transformers, like OpenAIVisionConnector and AnthropicVisionConnector. This use case will show you how GenAI can streamline content creation for marketing across the board.
Ollama Use Case: Learn how Scenario Specialist Dmitri Bagh has utilized Ollama within FME to input data, create custom models, and enhance security protocols. This segment will include demos to illustrate the full capabilities of FME in AI-driven processes.
Custom AI Models: Discover how to leverage FME to build personalized AI models using your data. Whether it’s populating a model with local data for added security or integrating public AI tools, find out how FME facilitates a versatile and secure approach to AI.
We’ll wrap up with a live Q&A session where you can engage with our experts on your specific use cases, and learn more about optimizing your data workflows with AI.
This webinar is ideal for professionals seeking to harness the power of AI within their data management systems while ensuring high levels of customization and security. Whether you're a novice or an expert, gain actionable insights and strategies to elevate your data processes. Join us to see how FME and AI can revolutionize how you work with data!
Recently uploaded (20)
Nordic Marketo Engage User Group_June 13_ 2024.pptx
Nordic Marketo Engage User Group_June 13_ 2024.pptx
Let's Integrate MuleSoft RPA, COMPOSER, APM with AWS IDP along with Slack
Let's Integrate MuleSoft RPA, COMPOSER, APM with AWS IDP along with Slack
Azure API Management to expose backend services securely
Azure API Management to expose backend services securely
Letter and Document Automation for Bonterra Impact Management (fka Social Sol...
Letter and Document Automation for Bonterra Impact Management (fka Social Sol...
Digital Marketing Trends in 2024 | Guide for Staying Ahead
Digital Marketing Trends in 2024 | Guide for Staying Ahead
Ocean lotus Threat actors project by John Sitima 2024 (1).pptx
Ocean lotus Threat actors project by John Sitima 2024 (1).pptx
How to Interpret Trends in the Kalyan Rajdhani Mix Chart.pdf
How to Interpret Trends in the Kalyan Rajdhani Mix Chart.pdf
Operating System Used by Users in day-to-day life.pptx
Operating System Used by Users in day-to-day life.pptx
Deep Dive: Getting Funded with Jason Jason Lemkin Founder & CEO @ SaaStr
Deep Dive: Getting Funded with Jason Jason Lemkin Founder & CEO @ SaaStr
Choosing The Best AWS Service For Your Website + API.pptx
Choosing The Best AWS Service For Your Website + API.pptx
Deep Dive: AI-Powered Marketing to Get More Leads and Customers with HyperGro...
Deep Dive: AI-Powered Marketing to Get More Leads and Customers with HyperGro...
Energy Efficient Video Encoding for Cloud and Edge Computing Instances
Energy Efficient Video Encoding for Cloud and Edge Computing Instances
GraphRAG for Life Science to increase LLM accuracy
GraphRAG for Life Science to increase LLM accuracy
Driving Business Innovation: Latest Generative AI Advancements & Success Story
Driving Business Innovation: Latest Generative AI Advancements & Success Story
Chapter 2 Graph
- 1. 0 8.75 17.5 26.25 35 Full Period Half Period Quarter Period 3-Quarter Period Four sections 3 35 35 35 35 • = 26.25 of the period = 8.75 =17.5 4 4 2 (t=__) € € €
- 2. 0 2 10.75 19.5 28.25 35 Start First Section Second Section Third Section Four sections 26.25 + 2 = 28.25 8.75 + 2 =10.75 17.5 + 2 = 19.5 of the x-axis 0 + 2 = 2 (t=__) € € € €
- 3. 151 76 1 0 2 10.75 19.5 28.25 35
- 4. 151 76 1 0 2 10.75 19.5 28.25 35
- 5. Minimum The Graph of y=-cos(x)
- 6. 151 76 1 0 2 10.75 19.5 28.25 35
- 7. 151 H(m) 76 1 0 2 10.75 19.5 28.25 35 t(min)