SlideShare a Scribd company logo
1 of 17
Chapter 3
Linking IT to Business Metrics
From the first time IT started making a significant dent in
corporate balance sheets, the holy grail of academics,
consultants, and business and IT managers has been to show
that what a company spends on IT has a direct impact on its
performance. Early efforts to do this, such as those trying to
link various measures of IT input (e.g., budget dollars, number
of PCs, number of projects) with various measures of business
performance (e.g., profit, productivity, stock value) all failed to
show any relationship at all (Marchand et al. 2000). Since then,
everyone has prop- erly concluded that the relationship between
what is done in IT and what happens in the business is
considerably more complex than these studies first supposed. In
fact, many researchers would suggest that the relationship is so
filtered through a variety of “conversion effects” (Cronk and
Fitzgerald 1999) as to be practically impossible to demonstrate.
Most IT managers would agree. They have long argued that
technology is not the major stumbling block to achieving
business performance; it is the business itself—the processes,
the managers, the culture, and the skills—that makes the differ-
ence. Therefore, it is simply not realistic to expect to see a clear
correlation between IT and business performance at any level.
When technology is successful, it is a team effort, and the
contributions of the IT and business components of an initiative
cannot and should not be separated.
Nevertheless, IT expenditures must be justified. Thus, most
companies have concentrated on determining the “business
value” that specific IT projects deliver. By focusing on a goal
that matters to business (e.g., better information, faster
transaction processing, reduced staff), then breaking this goal
down into smaller projects that IT can affect directly, they have
tried to “peel the onion” and show specifically how IT delivers
value in a piecemeal fashion. Thus, a series of surrogate
measures are usually used to demonstrate IT’s impact in an
organization. (See Chapter 1 for more details.)
More recently, companies are taking another look at business
performance met- rics and IT. They believe it is time to “put the
onion back together” and focus on what
1 This chapter is based on the authors’ previously published
article, Smith, H. A., J. D. McKeen, and C. Street. “Linking IT
to Business Metrics.” Journal of Information Science and
Technology 1, no. 1 (2004): 13–26. Reproduced by permission
of the Information Institute.
1
27
28 Section I • Delivering Value with IT
really matters to the enterprise. This perspective argues that
employees who truly understand what their business is trying to
achieve can sense the right ways to per- sonally improve
performance that will show up at a business unit and
organizational level. “People who understand the business and
are informed will be proactive and ... have a disposition to
create business value every day in many small and not-so-small
ways” (Marchand et al. 2000). Although the connection may not
be obvious, they say, it is there nevertheless and can be
demonstrated in tangible ways. The key to linking what IT does
to business performance is, therefore, to create an environment
within which everyone thoroughly understands what measures
are important to the business and is held accountable for them.
This point of view does not suggest that all the work done to
date to learn how IT delivers value to an organization (e.g.,
business cases, productivity measures) has been unnecessary,
only that it is incomplete. Without close attention to business
metrics in addition, it is easy for IT initiatives and staff to lose
their focus and become less effective.
This chapter looks at how these controversial yet compelling
ideas are being pursued in organizations to better understand
how companies are attempting to link IT work and firm
performance through business metrics. The first section
describes how business metrics themselves are evolving and
looks at how new management philosophies are changing how
these measures are communicated and applied. Next it discusses
the types of metrics that are important for a well-rounded
program of business measurement and how IT can influence
them. Then it presents three differ- ent ways companies are
specifically linking their IT departments with business met- rics
and the benefits and challenges they have experienced in doing
this. This section concludes with some general principles for
establishing a business measurement pro- gram in IT. Finally, it
offers some advice to managers about how to succeed with such
a program in IT.
Business MeasureMent: an Overview
Almost everyone agrees that the primary goal of a business is to
make money for its shareholders (Goldratt and Cox 1984;
Haspeslagh et al. 2001; Kaplan and Norton 1996).
Unfortunately, in large businesses this objective frequently gets
lost in the midst of people’s day-to-day activities because profit
cannot be measured directly at the level at which most
employees in a company work (Haspeslagh et al. 2001). This
“missing link” between work and business performance leads
companies to look for ways to bridge this gap. They believe that
if a firm’s strategies for achieving its goal can be tied much
more closely to everyday processes and decision making,
frontline employees will be better able to create business value.
Proponents of this value-based manage- ment (VBM) approach
have demonstrated that an explicit, firmwide commitment to
shareholder value, clear communication about how value is
created or destroyed, and incentive systems that are linked to
key business measures will increase the odds of a positive
increase in share price (Haspeslagh et al. 2001).
Measurement counts. What a company measures and the way it
measures influence both the mindsets of managers and the way
people behave. The best measures are tied to business
performance and are linked to the strategies and business
capabilities of the company. (Marchand et al. 2000)
Chapter 3 • Linking IT to Business Metrics 29
Although companies ascribe to this notion in theory, they do not
always act in ways that are consistent with this belief. All too
often, therefore, because they lack clarity about the links
between business performance and their own work, individuals
and even business units have to take leaps of faith in what they
do (Marchand et al. 2000).
Nowhere has this been more of a problem than in IT. As has
been noted often, IT investments have not always delivered the
benefits expected (Bensaou and Earl 1998; Holland and Sharke
2001; Peslak 2012). “Efforts to measure the link between IT
investment and business performance from an economics
perspective have... failed to establish a consistent causal
linkage with sustained business profitability” (Marchand et al.
2000). Value-based management suggests that if IT staff do not
understand the business, they cannot sense how and where to
change it effectively with technology. Many IT and business
managers have implicitly known this for some time. VBM
simply gives them a better framework for implementing their
beliefs more systematically.
One of the most significant efforts to integrate an organization’s
mission and strategy with a measurement system has been
Kaplan and Norton’s (1996) balanced scorecard. They explain
that competing in the information age is much less about
managing physical, tangible assets and much more about the
ability of a company to mobilize its intangible assets, such as
customer relationships, innovation, employee skills, and
information technology. Thus, they suggest that not only should
business measures look at how well a company has done in the
past (i.e., financial performance), but they also need to look at
metrics related to customers, internal business processes, and
learning and growth that position the firm to achieve future
performance. Although it is difficult putting a reliable monetary
value on these items, Kaplan and Norton sug- gest that such
nonfinancial measures are critical success factors for superior
financial performance in the future. Research shows that this is,
in fact, the case. Companies that use a balanced scorecard tend
to have a better return on investment (ROI) than those that rely
on traditional financial measures alone (Alexander 2000).
Today many companies use some sort of scorecard or
“dashboard” to track a vari- ety of different metrics of
organizational health. However, IT traditionally has not paid
much attention to business results, focusing instead on its own
internal measures of performance (e.g., IT operations
efficiency, projects delivered on time). This has per- petuated
the serious disconnect between the business and IT that often
manifests itself in perceptions of poor alignment between the
two groups, inadequate payoffs from IT investments, poor
relationships, and finger-pointing (Holland and Sharke 2001;
Peslak 2012; Potter 2013). All too often IT initiatives are
conceived with little reference to major business results, relying
instead on lower-level business value surrogates that are not
always related to these measures. IT organizations are getting
much better at this bot- tom-up approach to IT investment
(Smith and McKeen 2010), but undelivered IT value remains a
serious concern in many organizations. One survey of CFOs
found that only 49 percent felt that their ROI expectations for
technology had been met (Holland and Sharke 2001). “Despite
considerable effort, no practical model has been developed to
measure whether a company’s IT investments will definitely
contribute to sustainable competitive advantage” (Marchand et
al. 2000). Clearly, in spite of significant efforts over many
years, traditional IT measurement programs have been
inadequate at
30 Section I • Delivering Value with IT
assessing business value. Many IT organizations believe,
therefore, that it is time for a different approach to delivering
IT value, one that holds IT accountable to the same measures
and goals as the rest of the business.
Key Business Metrics fOr it
No one seriously argues that IT has no impact on an
organization’s overall financial performance anymore. There
may be disagreement about whether it has a positive or a
negative impact, but technology is too pervasive and significant
an expense in most firms for it not to have some influence on
the corporate bottom line. However, as has been argued earlier,
we now recognize that neither technology nor business alone is
responsible for IT’s financial impact. It is instead a joint
responsibility of IT and the busi- ness. This suggests that they
need to be held accountable together for its impact. Some
companies have accepted this principle for individual IT
projects (i.e., holding business and IT managers jointly
responsible for achieving their anticipated benefits), yet few
have extended it to an enterprise level. VBM suggests that this
lack of attention to enter- prise performance by IT is one reason
it has been so hard to fully deliver business value for
technology investments. Holding IT accountable for a firm’s
performance according to key financial metrics is, therefore, an
important step toward improving its contribu- tion to the
corporate bottom line.
However, although financial results are clearly an important
part of any mea- surement of a business’s success today, they
are not enough. Effective business metrics programs should also
include nonfinancial measures, such as customer and employee
satisfaction. As already noted, because such nonfinancial
measures are predictive of future performance, they offer an
organization the opportunity to make changes that will
ultimately affect their financial success.
Kaplan and Norton (1996) state “the importance of customer
satisfaction probably cannot be overemphasized.” Companies
that do not understand their customers’ needs will likely lose
customers and profitability. Research shows that merely
adequate satis- faction is insufficient to lead to customer loyalty
and ultimately profit. Only firms where customers are
completely or extremely satisfied can achieve this result
(Heskett et al. 1994). As a result, many companies now
undertake systematic customer satisfaction surveys. However, in
IT it is rare to find external customer satisfaction as one of the
metrics on which IT is evaluated. While IT’s “customers” are
usually considered to be internal, these days technology makes
a significant difference in how external custom- ers experience
a firm and whether or not they want to do business with it.
Systems that are not reliable or available when needed, cannot
provide customers with the informa- tion they need, or cannot
give customers the flexibility they require are all too common.
And with the advent of online business, systems and apps are
being designed to inter- face directly with external customers. It
is, therefore, appropriate to include external customer
satisfaction as a business metric for IT.
Another important nonfinancial business measure is employee
satisfaction. This is a “leading indicator” of customer
satisfaction. That is, employee satisfaction in one year is
strongly linked to customer satisfaction and profitability in the
next (Koys 2001). Employees’ positive attitudes toward their
company and their jobs lead to posi- tive behaviors toward
customers and, therefore, to improved financial performance
Chapter 3 • Linking IT to Business Metrics 31
(Rucci et al. 1998; Ulrich et al. 1991). IT managers have always
watched their own employee satisfaction rate intently because
of its close links to employee turnover. However, they often
miss the link between IT employee satisfaction and customer
satisfaction—both internal customer satisfaction, which leads to
improved general employee satisfaction, and external customer
satisfaction. Thus, only a few companies hold IT managers
accountable for general employee satisfaction.
Both customer and employee satisfaction should be part of a
business metrics program for IT. With its ever-growing
influence in organizations, technology is just as likely to affect
external customer and general employee satisfaction as many
other areas of a business. This suggests that IT has three
different levels of measurement and accountability:
1. Enterprise measures. These tie the work of IT directly to the
performance of the organization (e.g., external customer
satisfaction, corporate financial performance). 2. Functional
measures. These assess the internal work of the IT organization
as a whole (e.g., IT employee satisfaction, internal customer
satisfaction, operational
performance, development productivity).
3. Project measures. These assess the performance of a
particular project team in
delivering specific value to the organization (e.g., business case
benefits, delivery on time).
Functional and project measures are usually well addressed by
IT measurement programs today. It is the enterprise level that is
usually missing.
Designing Business Metrics fOr it
The firms that hold IT accountable for enterprise business
metrics believe this approach fosters a common sense of
purpose, enables everyone to make better decisions, and helps
IT staff understand the implications of their work for the
success of the organi- zation (Haspeslagh et al. 2001; Marchand
et al. 2000; Potter 2013; Roberts 2013). The implementation of
business metrics programs varies widely among companies, but
three approaches taken to linking IT with business metrics are
distinguishable.
1. Balanced scorecard. This approach uses a classic balanced
scorecard with mea- sures in all four scorecard dimensions (see
the “Sample Balanced Scorecard Business Metrics” feature).
Each metric is selected to measure progress against the entire
enterprise’s business plan. These are then broken down into
business unit plans and appropriate submetrics identified.
Individual scorecards are then developed with metrics that will
link into their business unit scorecards. With this approach, IT
is treated as a separate business unit and has its own scorecard
linked to the business plan. “Our management finally realized
that we need to have everyone thinking in the same way,”
explained one manager. “With enterprise systems, we can’t have
people working in silos anymore.” The scorecards are very
visible in the organization with company and business unit
scorecards and those of senior execu- tives posted on the
company’s intranet. “People are extremely interested in seeing
how we’re doing. Scorecards have provided a common
framework for our entire company.” They also provide clarity
for employees about their roles in how they affect key business
metrics.
32 Section I • Delivering Value with IT
Sample Balanced Scorecard Business Metrics
• Shareholdervalue(financial)
• Expensemanagement(financial)
• Customer/clientfocus(customer)
• Loyalty(customer)
• Customercentricorganization(customer)
• Effectivenessandefficiencyofbusinessoperations(operations)
• Riskmanagement(operations)
•
Contributiontofirmwideprioritiesandbusinessinitiatives(growth)
Although scorecards have meant that there is better
understanding of the business’s drivers and plans at senior
management levels, considerable resistance to them is still
found at the lower levels in IT. “While developers see how they
can affect our customers, they don’t see how they can affect
shareholder value, profit, or revenue, and they don’t want to be
held accountable for these things,” stated the same manager.
She noted that implementing an effective scorecard program
relies on three things: good data to provide better metrics,
simplicity of metrics, and enforcement. “Now if someone’s
scorecard is not complete, they cannot get a bonus. This is a
huge incentive to follow the program.”
2. Modified scorecard. A somewhat different approach to a
scorecard is taken by one company in the focus group. This firm
has selected five key measures (see the “Modified Scorecard
Business Metrics” feature) that are closely linked to the com-
pany’s overall vision statement. Results are communicated to all
staff on a quarterly basis in a short performance report. This
includes a clear explanation of each mea- sure, quarterly
progress, a comparison with the previous year’s quarterly
results, and a “stretch” goal for the organization to achieve. The
benefit of this approach is that it orients all employees in the
company to the same mission and values. With everyone using
the same metrics, alignment is much clearer all the way through
the firm, according to the focus group manager.
In IT these key enterprise metrics are complemented by an
additional set of business measures established by the business
units. Each line of business identifies one or two key business
unit metrics on which they and their IT team
Modified Scorecard Business Metrics
· Customer loyalty index. Percentage of customers who said
they were very satisfied with the company and would
recommend it to others.
· Associate loyalty index. Employees’ perception of the
company as a great place to work.
· Revenue growth. This year’s total revenues as a percentage of
last year’s total revenues.
· Operating margin. Operating income earned before interest
and taxes for every dollar of
revenue.
· Return on capital employed. Earnings before interest and tax
divided by the capital used
to generate the earnings.
Chapter 3 • Linking IT to Business Metrics 33
will be measured. Functional groups within IT are evaluated
according to the same metrics as their business partners as well
as on company and internal IT team performance. For example,
the credit group in IT might be evaluated on the number of new
credit accounts the company acquires. Shared IT services (e.g.,
infrastructure) are evaluated according to an average of all of
the IT func- tional groups’ metrics.
The importance the company places on these metrics is reflected
in the firm’s generous bonus program (i.e., bonuses can reach
up to 230 percent of an individual’s salary) in which all IT staff
participate. Bonuses are separate from an individual’s salary,
which is linked to personal performance. The percentage
influence of each set of business measures (i.e., enterprise,
business unit, and individual/team) varies according to the level
of the individual in the firm. However, all staff have at least 25
percent of their bonus linked to enterprise performance metrics.
No bonuses are paid to anyone if the firm does not reach its
earnings-per-share target (which is driven by the five enterprise
measures out- lined in the “Modified Scorecard Business
Metrics” feature). This incentive sys- tem makes it clear that
everyone’s job is connected to business results and helps ensure
that attention is focused on the things that are important to the
company. As a result, interest is much stronger among IT staff
about how the business is doing. “Everyone now speaks the
same language,” said the manager. “Project alignment is much
easier.”
3. Strategic imperatives. A somewhat different approach is
taken by a third focus group company. Here the executive team
annually evaluates the key environmen- tal factors affecting the
company, then identifies a number of strategic imperatives for
the firm (e.g., achieve industry-leading e-business capability,
achieve 10–15 percent growth in earnings per share). These can
vary according to the needs of the firm in any particular year.
Each area of the business is then asked to identify initiatives
that will affect these imperatives and to determine how they
will be measured (e.g., retaining customers of a recent
acquisition, increased net sales, a new product). In the same
way, IT is asked to identify the key projects and mea- sures that
will help the business to achieve these imperatives. Each part of
the company, including IT, then integrates these measures into
its variable pay pro- gram (VPP).
The company’s VPP links a percentage of an individual’s pay to
business results and overall business unit performance. This
percentage could vary from a small portion of one’s salary for a
new employee to a considerable proportion for senior
management. Within IT, the weight that different measures are
accorded in the VPP portion of their pay is determined by a
measurement team and approved by the CIO and the president.
Figure 3.1 illustrates the different percentages allo- cated to
IT’s variable pay component for a typical year. Metrics can
change from year to year depending on where management
wants to focus everyone’s attention. “Performance tends to
improve if you measure it,” explained the manager. “Over the
years, we have ratcheted up our targets in different areas. Once
a certain level of performance is achieved, we may change the
measure or change the emphasis on this measure.”
34
Section I • Delivering Value with IT
IT Variable Pay 100%
Business Results 40%
IT Performance 60%
Report Card Goals 30%
Key Projects 30%
Partner Satisfaction 10%
Application Delivery Effectiveness 5%
Production Availability 5%
Member Retention 5%
Product Recovery 5%
figure 3.1 Percentage Weightings Assigned to IT Variable Pay
Components for a Particular Year
An important difference from the scorecard approach is the
identification of key IT projects. “These are not all IT projects,
but a small number that are closely aligned with the strategic
business imperatives,” stated the manager. “Having the success
of these projects associated with their variable pay drives
everyone’s behavior. People tend to jump in and help if there’s
a problem with one of them.” The goal in this process is for
everyone to understand the VPP measures and to make them
visible within IT. Targets and results are posted quarterly, and
small groups of employees meet to discuss ideas about how they
can influence business and IT goals. “Some amazing ideas have
come out of these meetings,” said the manager. “Everyone
knows what’s important, and these measures get attention.
People use these metrics to make choices all the time in their
work.”
Each of these business measurement programs has been
implemented somewhat differently, but they all share several
key features that could be considered principles of a good
business metrics program for IT:
1. Focus on overall business performance. These programs all
focus employees on both financial and nonfinancial enterprise
performance and have an explicit expecta- tion that everyone in
the organization can influence these results in some way.
2. Understanding is a critical success factor. If people are going
to be held accountable for certain business results, it is
important that they understand them. Similarly, if the
organization is worried about certain results, this must be
communicated as well. Holding regular staff meetings where
people can ask ques- tions and discuss results is effective, as is
providing results on a quarterly basis. Understanding is the
goal. “If you can ask ... a person programming code and they
can tell you three to four of their objectives and how those tie
into the compa- ny’s performance and what the measures of
achieving those objectives are, you’ve got it” (Alexander 2000).
3. Simplicity. Successful companies tend to keep their measures
very simple and easy to use (Haspeslagh et al. 2001). In each
approach already outlined, a limited number of measures are
used. This makes it very easy for employees to calculate
Chapter 3 • Linking IT to Business Metrics 35
their bonuses (or variable pay) based on the metrics provided,
which further
strengthens the linkage between company performance and
individual effort.
4. Visibility. In each of the programs already discussed, metrics
were made widely available to all staff on a quarterly basis. In
one case they are posted on the com- pany’s intranet; in another
they are distributed in a printed report; in a third they are
posted in public areas of the office. Visibility encourages
employee buy-in and accountability and stimulates discussion
about how to do better or what is working
well.
5. Links to incentive systems. Successful companies tend to
include a much
larger number of employees in bonus programs than
unsuccessful ones (Haspeslagh et al. 2001). Extending incentive
schemes to all IT staff, not just management, is important to a
measurement program’s effectiveness. The most effective
programs appear to distinguish between fair compensation for
individual work and competencies and a reward for successfully
achieving corporate objectives.
aDvice tO Managers
The focus group had some final advice for other IT managers
who are thinking of implementing a business metrics program:
• Results will take time. It takes time to change attitudes and
behavior in IT, but it is worth making the effort. Positive results
may take from six months to a year to appear. “We had some
initial pushback from our staff at the beginning,” said one
manager, “but now the metrics program has become ingrained in
our attitudes and behaviors.” Another manager noted, “We had a
few bumps during our first year, but everyone, especially our
executives, is getting better at the program now [that] we’re in
our third year. It really gets our staff engaged with the
business.” If there has been no dramatic difference within three
years, management should recognize that it is either using the
wrong measures or hasn’t got employee buy-in to the pro- gram
(Alexander 2000).
• Have common goals. Having everyone measured on the same
business goals helps build a strong team at all levels in the
organization. It makes it easier to set priorities as a group and
collaborate and share resources, as needed.
· Follow up on problem areas. Companies must be prepared to
take action about poor results and involve staff in their plans. In
particular, if companies are going to ask customers and
employees what they think, they must be prepared to act on the
results. All metrics must be taken seriously and acted on if they
are to be used to drive behavior and lead to continuous
improvement.
· Be careful what you measure. Measuring something makes
people pay attention to it, particularly if it is linked to
compensation. Metrics must, therefore, be selected with care
because they will be a major driver of behavior. For example, if
incen- tives are solely based on financial results, it is probable
that some people may be so driven that they will trample on the
needs and interests of others. Similarly, if only costs are
measured, the needs of customers could be ignored. Conversely,
if a metric indicates a problem area, organizations can expect to
see a lot of ingenuity and sup- port devoted to addressing it.
36 Section I • Delivering Value with IT
• Don’t use measurement as a method of control. A business
metrics program should be designed to foster an environment in
which people look beyond their own jobs and become proactive
about the needs of the organization (Marchand et al. 2000). It
should aim to communicate strategy and help align individual
and organizational initiatives (Kaplan and Norton 1996). All
managers should clearly
understand that a program of this but rather as a motivational
tool.
Conclusion
Getting the most value out of IT has been a serious concern of
business for many years. In spite of considerable effort,
measurement initiatives in IT that use surrogates of busi- ness
value or focus on improving internal IT behavior have not been
fully successful in delivering results. Expecting IT to
participate in achieving specific enterprise objectives— the
same goals as the rest of the organiza- tion—has been shown to
deliver significant benefits. Not only are there demonstrable
financial returns, but there is also consider- able long-term
value in aligning everyone’s behavior with the same goals;
people become more supportive of each other and more
References
Alexander, S. “Business Metrics.” Computerworld 34, no. 24
(2000): 64.
Bensaou, M., and M. Earl. “The Right Mind-Set for Managing
Information Technology.” Harvard Business Review 76, no. 5
(September–October 1998): 110–28.
Cronk, M., and E. Fitzgerald. “Understanding ‘IS Business
Value’: Derivation of Dimensions.” Logistics Information
Management 12, no. 1–2 (1999): 40–49.
Goldratt, E., and J. Cox. The Goal: Excellence in
Manufacturing. Croton-on-Hudson, NY: North River Press,
1984.
Haspeslagh, P., T. Noda, and F. Boulos. “Managing for Value:
It’s Not Just About the Numbers.” Harvard Business Review
(July–August 2001): 65–73.
type should not be used for controlling behavior,
sensitive to the greater corporate good, and decisions are easier
to make. A good business metrics program, therefore, appears to
be a powerful component of effective measure- ment in IT. IT
employees may initially resist accountability for business
results, but the experiences of the focus group demonstrate that
their objections are usually short lived. If a business
measurement program is carefully designed, properly linked to
an incentive pro- gram, widely implemented, and effectively
monitored by management, it is highly likely that business
performance will become an integral part of the mind-set of all
IT staff and ultimately pay off in a wide variety of ways.
Heskett, J., T. Jones, G. Loveman, E. Sasser, and L.
Schlesinger. “Putting the Service Profit Chain to Work.”
Harvard Business Review (March– April 1994): 164–74.
Holland, W., and G. Sharke. “Is Your IT System VESTed?”
Strategic Finance 83, no. 6 (December 2001): 34–37.
Kaplan, R., and D. Norton. The Balanced Scorecard. Boston:
Harvard Business School Press, 1996.
Koys, D. “The Effects of Employee Satisfaction, Organizational
Citizenship Behavior, and Turnover on Organizational
Effectiveness: A Unit-Level, Longitudinal Study.” Personnel
Psychology 54, no. 1 (Spring 2001): 101–14.
Marchand, D., W. Kettinger, and J. Rollins. “Information
Orientation: People, Technology
and the Bottom Line.” Sloan Management
Review (Summer 2000): 69–89.
Peslak, A. R. “An Analysis of Critical Information
Technology Issues Facing Organizations.” Industrial
Management and Data Systems 112, no. 5 (2012): 808–27.
Potter, K. “Business Key Metrics Data: Accelerate the IT Value
Journey.” Gartner Group, ID: G00256958, October 16, 2013.
Roberts, J. P. “Define Strategic IT Metrics as Part of Your IT
Strategy.” Gartner Group, ID: G0025861, November 5, 2013.
Chapter 3 • Linking IT to Business Metrics 37
Rucci, A., S. Kirn, and R. Quinn. “The Employee- Customer-
Profit Chain at Sears.” Harvard Business Review 76
(January/February 1998): 82–97.
Smith, H., and J. McKeen. “Investment Spend Optimization at
BMO Financial Group.” MISQ Executive 9, no. 2 (June 2010):
65–81.
Ulrich, D., R. Halbrook, D. Meder, M. Stuchlik, and S. Thorpe.
“Employee and Customer Attachment: Synergies for
Competitive Advantage.” Human Resource Planning 14 (1991):
89–103.

More Related Content

Similar to Chapter 3Linking IT to Business Metrics From the first time IT.docx

Discussion 1a)When a company decides to use an outside party t.docx
Discussion 1a)When a company decides to use an outside party t.docxDiscussion 1a)When a company decides to use an outside party t.docx
Discussion 1a)When a company decides to use an outside party t.docxcuddietheresa
 
The art of value creation with information technology potentials in business ...
The art of value creation with information technology potentials in business ...The art of value creation with information technology potentials in business ...
The art of value creation with information technology potentials in business ...Alexander Decker
 
Connecting IT and Business Value Through Balanced Scorecard
Connecting IT and Business Value Through Balanced ScorecardConnecting IT and Business Value Through Balanced Scorecard
Connecting IT and Business Value Through Balanced ScorecardGlen Alleman
 
RESEARCH NOTEHOW INFORMATION TECHNOLOGY STRATEGY ANDINVE.docx
RESEARCH NOTEHOW INFORMATION TECHNOLOGY STRATEGY ANDINVE.docxRESEARCH NOTEHOW INFORMATION TECHNOLOGY STRATEGY ANDINVE.docx
RESEARCH NOTEHOW INFORMATION TECHNOLOGY STRATEGY ANDINVE.docxaudeleypearl
 
If the CIO is to be valued as a strategic actor, how can he bring.docx
If the CIO is to be valued as a strategic actor, how can he bring.docxIf the CIO is to be valued as a strategic actor, how can he bring.docx
If the CIO is to be valued as a strategic actor, how can he bring.docxTatianaMajor22
 
COMPLEMENTARY ASSETS AND VALUE CREATION BEYOND INFORMATION TECHNOLOGY INVESTM...
COMPLEMENTARY ASSETS AND VALUE CREATION BEYOND INFORMATION TECHNOLOGY INVESTM...COMPLEMENTARY ASSETS AND VALUE CREATION BEYOND INFORMATION TECHNOLOGY INVESTM...
COMPLEMENTARY ASSETS AND VALUE CREATION BEYOND INFORMATION TECHNOLOGY INVESTM...ijmvsc
 
Report on IT Auditing and Governance_Ta_Hoang_Thang
Report on IT Auditing and Governance_Ta_Hoang_ThangReport on IT Auditing and Governance_Ta_Hoang_Thang
Report on IT Auditing and Governance_Ta_Hoang_ThangThang Ta Hoang
 
1 response for each post in APA format with referencesPost 1I.docx
1 response for each post in APA format with referencesPost 1I.docx1 response for each post in APA format with referencesPost 1I.docx
1 response for each post in APA format with referencesPost 1I.docxjeremylockett77
 
Strategic Business IT alignment
Strategic Business IT alignmentStrategic Business IT alignment
Strategic Business IT alignmentJulen Mohanty
 
8132019 EBSCOhosthttpsweb.b.ebscohost.comehostdeliv.docx
8132019 EBSCOhosthttpsweb.b.ebscohost.comehostdeliv.docx8132019 EBSCOhosthttpsweb.b.ebscohost.comehostdeliv.docx
8132019 EBSCOhosthttpsweb.b.ebscohost.comehostdeliv.docxblondellchancy
 
Piloting procter & gamble from decicion cockpits
Piloting procter & gamble from decicion cockpitsPiloting procter & gamble from decicion cockpits
Piloting procter & gamble from decicion cockpitsniz73
 
Employee Engagement within the IT Industry
Employee Engagement within the IT Industry Employee Engagement within the IT Industry
Employee Engagement within the IT Industry Momo Scott
 
ITFM Overview Paper Jun2016
ITFM Overview Paper Jun2016ITFM Overview Paper Jun2016
ITFM Overview Paper Jun2016Suzon Crowell
 
Analysing The Relationship Between IT Governance And Business IT Alignment Ma...
Analysing The Relationship Between IT Governance And Business IT Alignment Ma...Analysing The Relationship Between IT Governance And Business IT Alignment Ma...
Analysing The Relationship Between IT Governance And Business IT Alignment Ma...Lori Moore
 
The Generic IS/IT Bussiness Value Category : Cases In Indonesia
The Generic IS/IT Bussiness Value Category : Cases In IndonesiaThe Generic IS/IT Bussiness Value Category : Cases In Indonesia
The Generic IS/IT Bussiness Value Category : Cases In IndonesiaAinul Yaqin
 
Accounting Information System (AIS) Alignment And Non-Financial Performance I...
Accounting Information System (AIS) Alignment And Non-Financial Performance I...Accounting Information System (AIS) Alignment And Non-Financial Performance I...
Accounting Information System (AIS) Alignment And Non-Financial Performance I...CSCJournals
 

Similar to Chapter 3Linking IT to Business Metrics From the first time IT.docx (20)

Total IT Spending as Percentage of Revenue Paper.pdf
Total IT Spending as Percentage of Revenue Paper.pdfTotal IT Spending as Percentage of Revenue Paper.pdf
Total IT Spending as Percentage of Revenue Paper.pdf
 
Discussion 1a)When a company decides to use an outside party t.docx
Discussion 1a)When a company decides to use an outside party t.docxDiscussion 1a)When a company decides to use an outside party t.docx
Discussion 1a)When a company decides to use an outside party t.docx
 
The art of value creation with information technology potentials in business ...
The art of value creation with information technology potentials in business ...The art of value creation with information technology potentials in business ...
The art of value creation with information technology potentials in business ...
 
Connecting IT and Business Value Through Balanced Scorecard
Connecting IT and Business Value Through Balanced ScorecardConnecting IT and Business Value Through Balanced Scorecard
Connecting IT and Business Value Through Balanced Scorecard
 
14.balanced scorecard-case-study
14.balanced scorecard-case-study14.balanced scorecard-case-study
14.balanced scorecard-case-study
 
Study on the Nexuses between Supply Chain Information Technology Capabilities...
Study on the Nexuses between Supply Chain Information Technology Capabilities...Study on the Nexuses between Supply Chain Information Technology Capabilities...
Study on the Nexuses between Supply Chain Information Technology Capabilities...
 
RESEARCH NOTEHOW INFORMATION TECHNOLOGY STRATEGY ANDINVE.docx
RESEARCH NOTEHOW INFORMATION TECHNOLOGY STRATEGY ANDINVE.docxRESEARCH NOTEHOW INFORMATION TECHNOLOGY STRATEGY ANDINVE.docx
RESEARCH NOTEHOW INFORMATION TECHNOLOGY STRATEGY ANDINVE.docx
 
If the CIO is to be valued as a strategic actor, how can he bring.docx
If the CIO is to be valued as a strategic actor, how can he bring.docxIf the CIO is to be valued as a strategic actor, how can he bring.docx
If the CIO is to be valued as a strategic actor, how can he bring.docx
 
COMPLEMENTARY ASSETS AND VALUE CREATION BEYOND INFORMATION TECHNOLOGY INVESTM...
COMPLEMENTARY ASSETS AND VALUE CREATION BEYOND INFORMATION TECHNOLOGY INVESTM...COMPLEMENTARY ASSETS AND VALUE CREATION BEYOND INFORMATION TECHNOLOGY INVESTM...
COMPLEMENTARY ASSETS AND VALUE CREATION BEYOND INFORMATION TECHNOLOGY INVESTM...
 
Report on IT Auditing and Governance_Ta_Hoang_Thang
Report on IT Auditing and Governance_Ta_Hoang_ThangReport on IT Auditing and Governance_Ta_Hoang_Thang
Report on IT Auditing and Governance_Ta_Hoang_Thang
 
1 response for each post in APA format with referencesPost 1I.docx
1 response for each post in APA format with referencesPost 1I.docx1 response for each post in APA format with referencesPost 1I.docx
1 response for each post in APA format with referencesPost 1I.docx
 
Strategic Business IT alignment
Strategic Business IT alignmentStrategic Business IT alignment
Strategic Business IT alignment
 
VALUE-BASED-ASSESSMENT.pdf
VALUE-BASED-ASSESSMENT.pdfVALUE-BASED-ASSESSMENT.pdf
VALUE-BASED-ASSESSMENT.pdf
 
8132019 EBSCOhosthttpsweb.b.ebscohost.comehostdeliv.docx
8132019 EBSCOhosthttpsweb.b.ebscohost.comehostdeliv.docx8132019 EBSCOhosthttpsweb.b.ebscohost.comehostdeliv.docx
8132019 EBSCOhosthttpsweb.b.ebscohost.comehostdeliv.docx
 
Piloting procter & gamble from decicion cockpits
Piloting procter & gamble from decicion cockpitsPiloting procter & gamble from decicion cockpits
Piloting procter & gamble from decicion cockpits
 
Employee Engagement within the IT Industry
Employee Engagement within the IT Industry Employee Engagement within the IT Industry
Employee Engagement within the IT Industry
 
ITFM Overview Paper Jun2016
ITFM Overview Paper Jun2016ITFM Overview Paper Jun2016
ITFM Overview Paper Jun2016
 
Analysing The Relationship Between IT Governance And Business IT Alignment Ma...
Analysing The Relationship Between IT Governance And Business IT Alignment Ma...Analysing The Relationship Between IT Governance And Business IT Alignment Ma...
Analysing The Relationship Between IT Governance And Business IT Alignment Ma...
 
The Generic IS/IT Bussiness Value Category : Cases In Indonesia
The Generic IS/IT Bussiness Value Category : Cases In IndonesiaThe Generic IS/IT Bussiness Value Category : Cases In Indonesia
The Generic IS/IT Bussiness Value Category : Cases In Indonesia
 
Accounting Information System (AIS) Alignment And Non-Financial Performance I...
Accounting Information System (AIS) Alignment And Non-Financial Performance I...Accounting Information System (AIS) Alignment And Non-Financial Performance I...
Accounting Information System (AIS) Alignment And Non-Financial Performance I...
 

More from walterl4

Chapter 27 The purchase agreement 185After read.docx
Chapter 27 The purchase agreement           185After read.docxChapter 27 The purchase agreement           185After read.docx
Chapter 27 The purchase agreement 185After read.docxwalterl4
 
Chapter 27Gender and Media Content, Uses, and ImpactDar.docx
Chapter 27Gender and Media Content, Uses, and ImpactDar.docxChapter 27Gender and Media Content, Uses, and ImpactDar.docx
Chapter 27Gender and Media Content, Uses, and ImpactDar.docxwalterl4
 
CHAPTER 25Arab Unity and Disunity (since 1967)THE CRIS.docx
CHAPTER 25Arab Unity and Disunity (since 1967)THE CRIS.docxCHAPTER 25Arab Unity and Disunity (since 1967)THE CRIS.docx
CHAPTER 25Arab Unity and Disunity (since 1967)THE CRIS.docxwalterl4
 
Chapter 28 presents historical challenges to creating a sense of pe.docx
Chapter 28 presents historical challenges to creating a sense of pe.docxChapter 28 presents historical challenges to creating a sense of pe.docx
Chapter 28 presents historical challenges to creating a sense of pe.docxwalterl4
 
Chapter 24Tort Reform© 2014 Jones and Bartlett Pub.docx
Chapter 24Tort Reform© 2014 Jones and Bartlett Pub.docxChapter 24Tort Reform© 2014 Jones and Bartlett Pub.docx
Chapter 24Tort Reform© 2014 Jones and Bartlett Pub.docxwalterl4
 
Chapter 24 Palliative and End-of-Life CareThe hospice nur.docx
Chapter 24 Palliative and End-of-Life CareThe hospice nur.docxChapter 24 Palliative and End-of-Life CareThe hospice nur.docx
Chapter 24 Palliative and End-of-Life CareThe hospice nur.docxwalterl4
 
Chapter 24Mental HealthCopyright © 2018, Elsevie.docx
Chapter 24Mental HealthCopyright © 2018, Elsevie.docxChapter 24Mental HealthCopyright © 2018, Elsevie.docx
Chapter 24Mental HealthCopyright © 2018, Elsevie.docxwalterl4
 
Chapter 23Rural and Migrant HealthCopyright © 2015, 2011, 20.docx
Chapter 23Rural and Migrant HealthCopyright © 2015, 2011, 20.docxChapter 23Rural and Migrant HealthCopyright © 2015, 2011, 20.docx
Chapter 23Rural and Migrant HealthCopyright © 2015, 2011, 20.docxwalterl4
 
Chapter 23 The Skeletal SystemKEY TERMSAxial skeleton v.docx
Chapter 23 The Skeletal SystemKEY TERMSAxial skeleton v.docxChapter 23 The Skeletal SystemKEY TERMSAxial skeleton v.docx
Chapter 23 The Skeletal SystemKEY TERMSAxial skeleton v.docxwalterl4
 
Chapter 4 A Tour of the CellChapter 4 A Tour of the CellName.docx
Chapter 4 A Tour of the CellChapter 4 A Tour of the CellName.docxChapter 4 A Tour of the CellChapter 4 A Tour of the CellName.docx
Chapter 4 A Tour of the CellChapter 4 A Tour of the CellName.docxwalterl4
 
Chapter 4 Managing Disputes ADR and Litigation StrategiesI.docx
Chapter 4  Managing Disputes ADR and Litigation StrategiesI.docxChapter 4  Managing Disputes ADR and Litigation StrategiesI.docx
Chapter 4 Managing Disputes ADR and Litigation StrategiesI.docxwalterl4
 
Chapter 4 Data Communications and Networking 1 of 40 .docx
Chapter 4  Data Communications and Networking  1 of 40 .docxChapter 4  Data Communications and Networking  1 of 40 .docx
Chapter 4 Data Communications and Networking 1 of 40 .docxwalterl4
 
Chapter 3 The APA Ethics Code and Ethical Decision MakingThe APA.docx
Chapter 3 The APA Ethics Code and Ethical Decision MakingThe APA.docxChapter 3 The APA Ethics Code and Ethical Decision MakingThe APA.docx
Chapter 3 The APA Ethics Code and Ethical Decision MakingThe APA.docxwalterl4
 
Chapter 3 3Plainchant Alleluia, Caro mea”Composed ca. 1275This.docx
Chapter 3 3Plainchant Alleluia, Caro mea”Composed ca. 1275This.docxChapter 3 3Plainchant Alleluia, Caro mea”Composed ca. 1275This.docx
Chapter 3 3Plainchant Alleluia, Caro mea”Composed ca. 1275This.docxwalterl4
 
chapter 3 Chapter 3 Managerial Decision Making1. Describ.docx
chapter 3 Chapter 3 Managerial Decision Making1. Describ.docxchapter 3 Chapter 3 Managerial Decision Making1. Describ.docx
chapter 3 Chapter 3 Managerial Decision Making1. Describ.docxwalterl4
 
Chapter 3What are GPNs and how do they function and operate W.docx
Chapter 3What are GPNs and how do they function and operate W.docxChapter 3What are GPNs and how do they function and operate W.docx
Chapter 3What are GPNs and how do they function and operate W.docxwalterl4
 
CHAPTER 3the story of the slave ship, the Zong- in Novembe.docx
CHAPTER 3the story of the slave ship, the Zong- in Novembe.docxCHAPTER 3the story of the slave ship, the Zong- in Novembe.docx
CHAPTER 3the story of the slave ship, the Zong- in Novembe.docxwalterl4
 
Chapter 3The Civilization of the GreeksCopyright © 2017 Ceng.docx
Chapter 3The Civilization of the GreeksCopyright © 2017 Ceng.docxChapter 3The Civilization of the GreeksCopyright © 2017 Ceng.docx
Chapter 3The Civilization of the GreeksCopyright © 2017 Ceng.docxwalterl4
 
Chapter 3What is the basic accounting equation Give an exampl.docx
Chapter 3What is the basic accounting equation Give an exampl.docxChapter 3What is the basic accounting equation Give an exampl.docx
Chapter 3What is the basic accounting equation Give an exampl.docxwalterl4
 
Chapter 3Understanding FinancialStatements and Cash Flow.docx
Chapter 3Understanding FinancialStatements and Cash Flow.docxChapter 3Understanding FinancialStatements and Cash Flow.docx
Chapter 3Understanding FinancialStatements and Cash Flow.docxwalterl4
 

More from walterl4 (20)

Chapter 27 The purchase agreement 185After read.docx
Chapter 27 The purchase agreement           185After read.docxChapter 27 The purchase agreement           185After read.docx
Chapter 27 The purchase agreement 185After read.docx
 
Chapter 27Gender and Media Content, Uses, and ImpactDar.docx
Chapter 27Gender and Media Content, Uses, and ImpactDar.docxChapter 27Gender and Media Content, Uses, and ImpactDar.docx
Chapter 27Gender and Media Content, Uses, and ImpactDar.docx
 
CHAPTER 25Arab Unity and Disunity (since 1967)THE CRIS.docx
CHAPTER 25Arab Unity and Disunity (since 1967)THE CRIS.docxCHAPTER 25Arab Unity and Disunity (since 1967)THE CRIS.docx
CHAPTER 25Arab Unity and Disunity (since 1967)THE CRIS.docx
 
Chapter 28 presents historical challenges to creating a sense of pe.docx
Chapter 28 presents historical challenges to creating a sense of pe.docxChapter 28 presents historical challenges to creating a sense of pe.docx
Chapter 28 presents historical challenges to creating a sense of pe.docx
 
Chapter 24Tort Reform© 2014 Jones and Bartlett Pub.docx
Chapter 24Tort Reform© 2014 Jones and Bartlett Pub.docxChapter 24Tort Reform© 2014 Jones and Bartlett Pub.docx
Chapter 24Tort Reform© 2014 Jones and Bartlett Pub.docx
 
Chapter 24 Palliative and End-of-Life CareThe hospice nur.docx
Chapter 24 Palliative and End-of-Life CareThe hospice nur.docxChapter 24 Palliative and End-of-Life CareThe hospice nur.docx
Chapter 24 Palliative and End-of-Life CareThe hospice nur.docx
 
Chapter 24Mental HealthCopyright © 2018, Elsevie.docx
Chapter 24Mental HealthCopyright © 2018, Elsevie.docxChapter 24Mental HealthCopyright © 2018, Elsevie.docx
Chapter 24Mental HealthCopyright © 2018, Elsevie.docx
 
Chapter 23Rural and Migrant HealthCopyright © 2015, 2011, 20.docx
Chapter 23Rural and Migrant HealthCopyright © 2015, 2011, 20.docxChapter 23Rural and Migrant HealthCopyright © 2015, 2011, 20.docx
Chapter 23Rural and Migrant HealthCopyright © 2015, 2011, 20.docx
 
Chapter 23 The Skeletal SystemKEY TERMSAxial skeleton v.docx
Chapter 23 The Skeletal SystemKEY TERMSAxial skeleton v.docxChapter 23 The Skeletal SystemKEY TERMSAxial skeleton v.docx
Chapter 23 The Skeletal SystemKEY TERMSAxial skeleton v.docx
 
Chapter 4 A Tour of the CellChapter 4 A Tour of the CellName.docx
Chapter 4 A Tour of the CellChapter 4 A Tour of the CellName.docxChapter 4 A Tour of the CellChapter 4 A Tour of the CellName.docx
Chapter 4 A Tour of the CellChapter 4 A Tour of the CellName.docx
 
Chapter 4 Managing Disputes ADR and Litigation StrategiesI.docx
Chapter 4  Managing Disputes ADR and Litigation StrategiesI.docxChapter 4  Managing Disputes ADR and Litigation StrategiesI.docx
Chapter 4 Managing Disputes ADR and Litigation StrategiesI.docx
 
Chapter 4 Data Communications and Networking 1 of 40 .docx
Chapter 4  Data Communications and Networking  1 of 40 .docxChapter 4  Data Communications and Networking  1 of 40 .docx
Chapter 4 Data Communications and Networking 1 of 40 .docx
 
Chapter 3 The APA Ethics Code and Ethical Decision MakingThe APA.docx
Chapter 3 The APA Ethics Code and Ethical Decision MakingThe APA.docxChapter 3 The APA Ethics Code and Ethical Decision MakingThe APA.docx
Chapter 3 The APA Ethics Code and Ethical Decision MakingThe APA.docx
 
Chapter 3 3Plainchant Alleluia, Caro mea”Composed ca. 1275This.docx
Chapter 3 3Plainchant Alleluia, Caro mea”Composed ca. 1275This.docxChapter 3 3Plainchant Alleluia, Caro mea”Composed ca. 1275This.docx
Chapter 3 3Plainchant Alleluia, Caro mea”Composed ca. 1275This.docx
 
chapter 3 Chapter 3 Managerial Decision Making1. Describ.docx
chapter 3 Chapter 3 Managerial Decision Making1. Describ.docxchapter 3 Chapter 3 Managerial Decision Making1. Describ.docx
chapter 3 Chapter 3 Managerial Decision Making1. Describ.docx
 
Chapter 3What are GPNs and how do they function and operate W.docx
Chapter 3What are GPNs and how do they function and operate W.docxChapter 3What are GPNs and how do they function and operate W.docx
Chapter 3What are GPNs and how do they function and operate W.docx
 
CHAPTER 3the story of the slave ship, the Zong- in Novembe.docx
CHAPTER 3the story of the slave ship, the Zong- in Novembe.docxCHAPTER 3the story of the slave ship, the Zong- in Novembe.docx
CHAPTER 3the story of the slave ship, the Zong- in Novembe.docx
 
Chapter 3The Civilization of the GreeksCopyright © 2017 Ceng.docx
Chapter 3The Civilization of the GreeksCopyright © 2017 Ceng.docxChapter 3The Civilization of the GreeksCopyright © 2017 Ceng.docx
Chapter 3The Civilization of the GreeksCopyright © 2017 Ceng.docx
 
Chapter 3What is the basic accounting equation Give an exampl.docx
Chapter 3What is the basic accounting equation Give an exampl.docxChapter 3What is the basic accounting equation Give an exampl.docx
Chapter 3What is the basic accounting equation Give an exampl.docx
 
Chapter 3Understanding FinancialStatements and Cash Flow.docx
Chapter 3Understanding FinancialStatements and Cash Flow.docxChapter 3Understanding FinancialStatements and Cash Flow.docx
Chapter 3Understanding FinancialStatements and Cash Flow.docx
 

Recently uploaded

Incoming and Outgoing Shipments in 1 STEP Using Odoo 17
Incoming and Outgoing Shipments in 1 STEP Using Odoo 17Incoming and Outgoing Shipments in 1 STEP Using Odoo 17
Incoming and Outgoing Shipments in 1 STEP Using Odoo 17Celine George
 
Presiding Officer Training module 2024 lok sabha elections
Presiding Officer Training module 2024 lok sabha electionsPresiding Officer Training module 2024 lok sabha elections
Presiding Officer Training module 2024 lok sabha electionsanshu789521
 
POINT- BIOCHEMISTRY SEM 2 ENZYMES UNIT 5.pptx
POINT- BIOCHEMISTRY SEM 2 ENZYMES UNIT 5.pptxPOINT- BIOCHEMISTRY SEM 2 ENZYMES UNIT 5.pptx
POINT- BIOCHEMISTRY SEM 2 ENZYMES UNIT 5.pptxSayali Powar
 
Solving Puzzles Benefits Everyone (English).pptx
Solving Puzzles Benefits Everyone (English).pptxSolving Puzzles Benefits Everyone (English).pptx
Solving Puzzles Benefits Everyone (English).pptxOH TEIK BIN
 
The basics of sentences session 2pptx copy.pptx
The basics of sentences session 2pptx copy.pptxThe basics of sentences session 2pptx copy.pptx
The basics of sentences session 2pptx copy.pptxheathfieldcps1
 
Organic Name Reactions for the students and aspirants of Chemistry12th.pptx
Organic Name Reactions  for the students and aspirants of Chemistry12th.pptxOrganic Name Reactions  for the students and aspirants of Chemistry12th.pptx
Organic Name Reactions for the students and aspirants of Chemistry12th.pptxVS Mahajan Coaching Centre
 
BASLIQ CURRENT LOOKBOOK LOOKBOOK(1) (1).pdf
BASLIQ CURRENT LOOKBOOK  LOOKBOOK(1) (1).pdfBASLIQ CURRENT LOOKBOOK  LOOKBOOK(1) (1).pdf
BASLIQ CURRENT LOOKBOOK LOOKBOOK(1) (1).pdfSoniaTolstoy
 
Introduction to ArtificiaI Intelligence in Higher Education
Introduction to ArtificiaI Intelligence in Higher EducationIntroduction to ArtificiaI Intelligence in Higher Education
Introduction to ArtificiaI Intelligence in Higher Educationpboyjonauth
 
Mastering the Unannounced Regulatory Inspection
Mastering the Unannounced Regulatory InspectionMastering the Unannounced Regulatory Inspection
Mastering the Unannounced Regulatory InspectionSafetyChain Software
 
PSYCHIATRIC History collection FORMAT.pptx
PSYCHIATRIC   History collection FORMAT.pptxPSYCHIATRIC   History collection FORMAT.pptx
PSYCHIATRIC History collection FORMAT.pptxPoojaSen20
 
Micromeritics - Fundamental and Derived Properties of Powders
Micromeritics - Fundamental and Derived Properties of PowdersMicromeritics - Fundamental and Derived Properties of Powders
Micromeritics - Fundamental and Derived Properties of PowdersChitralekhaTherkar
 
Crayon Activity Handout For the Crayon A
Crayon Activity Handout For the Crayon ACrayon Activity Handout For the Crayon A
Crayon Activity Handout For the Crayon AUnboundStockton
 
Arihant handbook biology for class 11 .pdf
Arihant handbook biology for class 11 .pdfArihant handbook biology for class 11 .pdf
Arihant handbook biology for class 11 .pdfchloefrazer622
 
Concept of Vouching. B.Com(Hons) /B.Compdf
Concept of Vouching. B.Com(Hons) /B.CompdfConcept of Vouching. B.Com(Hons) /B.Compdf
Concept of Vouching. B.Com(Hons) /B.CompdfUmakantAnnand
 
“Oh GOSH! Reflecting on Hackteria's Collaborative Practices in a Global Do-It...
“Oh GOSH! Reflecting on Hackteria's Collaborative Practices in a Global Do-It...“Oh GOSH! Reflecting on Hackteria's Collaborative Practices in a Global Do-It...
“Oh GOSH! Reflecting on Hackteria's Collaborative Practices in a Global Do-It...Marc Dusseiller Dusjagr
 
Grant Readiness 101 TechSoup and Remy Consulting
Grant Readiness 101 TechSoup and Remy ConsultingGrant Readiness 101 TechSoup and Remy Consulting
Grant Readiness 101 TechSoup and Remy ConsultingTechSoup
 
CARE OF CHILD IN INCUBATOR..........pptx
CARE OF CHILD IN INCUBATOR..........pptxCARE OF CHILD IN INCUBATOR..........pptx
CARE OF CHILD IN INCUBATOR..........pptxGaneshChakor2
 
Employee wellbeing at the workplace.pptx
Employee wellbeing at the workplace.pptxEmployee wellbeing at the workplace.pptx
Employee wellbeing at the workplace.pptxNirmalaLoungPoorunde1
 

Recently uploaded (20)

Incoming and Outgoing Shipments in 1 STEP Using Odoo 17
Incoming and Outgoing Shipments in 1 STEP Using Odoo 17Incoming and Outgoing Shipments in 1 STEP Using Odoo 17
Incoming and Outgoing Shipments in 1 STEP Using Odoo 17
 
Presiding Officer Training module 2024 lok sabha elections
Presiding Officer Training module 2024 lok sabha electionsPresiding Officer Training module 2024 lok sabha elections
Presiding Officer Training module 2024 lok sabha elections
 
POINT- BIOCHEMISTRY SEM 2 ENZYMES UNIT 5.pptx
POINT- BIOCHEMISTRY SEM 2 ENZYMES UNIT 5.pptxPOINT- BIOCHEMISTRY SEM 2 ENZYMES UNIT 5.pptx
POINT- BIOCHEMISTRY SEM 2 ENZYMES UNIT 5.pptx
 
Solving Puzzles Benefits Everyone (English).pptx
Solving Puzzles Benefits Everyone (English).pptxSolving Puzzles Benefits Everyone (English).pptx
Solving Puzzles Benefits Everyone (English).pptx
 
The basics of sentences session 2pptx copy.pptx
The basics of sentences session 2pptx copy.pptxThe basics of sentences session 2pptx copy.pptx
The basics of sentences session 2pptx copy.pptx
 
Organic Name Reactions for the students and aspirants of Chemistry12th.pptx
Organic Name Reactions  for the students and aspirants of Chemistry12th.pptxOrganic Name Reactions  for the students and aspirants of Chemistry12th.pptx
Organic Name Reactions for the students and aspirants of Chemistry12th.pptx
 
BASLIQ CURRENT LOOKBOOK LOOKBOOK(1) (1).pdf
BASLIQ CURRENT LOOKBOOK  LOOKBOOK(1) (1).pdfBASLIQ CURRENT LOOKBOOK  LOOKBOOK(1) (1).pdf
BASLIQ CURRENT LOOKBOOK LOOKBOOK(1) (1).pdf
 
Introduction to ArtificiaI Intelligence in Higher Education
Introduction to ArtificiaI Intelligence in Higher EducationIntroduction to ArtificiaI Intelligence in Higher Education
Introduction to ArtificiaI Intelligence in Higher Education
 
Mastering the Unannounced Regulatory Inspection
Mastering the Unannounced Regulatory InspectionMastering the Unannounced Regulatory Inspection
Mastering the Unannounced Regulatory Inspection
 
PSYCHIATRIC History collection FORMAT.pptx
PSYCHIATRIC   History collection FORMAT.pptxPSYCHIATRIC   History collection FORMAT.pptx
PSYCHIATRIC History collection FORMAT.pptx
 
Micromeritics - Fundamental and Derived Properties of Powders
Micromeritics - Fundamental and Derived Properties of PowdersMicromeritics - Fundamental and Derived Properties of Powders
Micromeritics - Fundamental and Derived Properties of Powders
 
Crayon Activity Handout For the Crayon A
Crayon Activity Handout For the Crayon ACrayon Activity Handout For the Crayon A
Crayon Activity Handout For the Crayon A
 
Model Call Girl in Tilak Nagar Delhi reach out to us at 🔝9953056974🔝
Model Call Girl in Tilak Nagar Delhi reach out to us at 🔝9953056974🔝Model Call Girl in Tilak Nagar Delhi reach out to us at 🔝9953056974🔝
Model Call Girl in Tilak Nagar Delhi reach out to us at 🔝9953056974🔝
 
Arihant handbook biology for class 11 .pdf
Arihant handbook biology for class 11 .pdfArihant handbook biology for class 11 .pdf
Arihant handbook biology for class 11 .pdf
 
Model Call Girl in Bikash Puri Delhi reach out to us at 🔝9953056974🔝
Model Call Girl in Bikash Puri  Delhi reach out to us at 🔝9953056974🔝Model Call Girl in Bikash Puri  Delhi reach out to us at 🔝9953056974🔝
Model Call Girl in Bikash Puri Delhi reach out to us at 🔝9953056974🔝
 
Concept of Vouching. B.Com(Hons) /B.Compdf
Concept of Vouching. B.Com(Hons) /B.CompdfConcept of Vouching. B.Com(Hons) /B.Compdf
Concept of Vouching. B.Com(Hons) /B.Compdf
 
“Oh GOSH! Reflecting on Hackteria's Collaborative Practices in a Global Do-It...
“Oh GOSH! Reflecting on Hackteria's Collaborative Practices in a Global Do-It...“Oh GOSH! Reflecting on Hackteria's Collaborative Practices in a Global Do-It...
“Oh GOSH! Reflecting on Hackteria's Collaborative Practices in a Global Do-It...
 
Grant Readiness 101 TechSoup and Remy Consulting
Grant Readiness 101 TechSoup and Remy ConsultingGrant Readiness 101 TechSoup and Remy Consulting
Grant Readiness 101 TechSoup and Remy Consulting
 
CARE OF CHILD IN INCUBATOR..........pptx
CARE OF CHILD IN INCUBATOR..........pptxCARE OF CHILD IN INCUBATOR..........pptx
CARE OF CHILD IN INCUBATOR..........pptx
 
Employee wellbeing at the workplace.pptx
Employee wellbeing at the workplace.pptxEmployee wellbeing at the workplace.pptx
Employee wellbeing at the workplace.pptx
 

Chapter 3Linking IT to Business Metrics From the first time IT.docx

  • 1. Chapter 3 Linking IT to Business Metrics From the first time IT started making a significant dent in corporate balance sheets, the holy grail of academics, consultants, and business and IT managers has been to show that what a company spends on IT has a direct impact on its performance. Early efforts to do this, such as those trying to link various measures of IT input (e.g., budget dollars, number of PCs, number of projects) with various measures of business performance (e.g., profit, productivity, stock value) all failed to show any relationship at all (Marchand et al. 2000). Since then, everyone has prop- erly concluded that the relationship between what is done in IT and what happens in the business is considerably more complex than these studies first supposed. In fact, many researchers would suggest that the relationship is so filtered through a variety of “conversion effects” (Cronk and Fitzgerald 1999) as to be practically impossible to demonstrate. Most IT managers would agree. They have long argued that technology is not the major stumbling block to achieving business performance; it is the business itself—the processes, the managers, the culture, and the skills—that makes the differ- ence. Therefore, it is simply not realistic to expect to see a clear correlation between IT and business performance at any level. When technology is successful, it is a team effort, and the contributions of the IT and business components of an initiative cannot and should not be separated. Nevertheless, IT expenditures must be justified. Thus, most companies have concentrated on determining the “business value” that specific IT projects deliver. By focusing on a goal that matters to business (e.g., better information, faster transaction processing, reduced staff), then breaking this goal down into smaller projects that IT can affect directly, they have tried to “peel the onion” and show specifically how IT delivers value in a piecemeal fashion. Thus, a series of surrogate
  • 2. measures are usually used to demonstrate IT’s impact in an organization. (See Chapter 1 for more details.) More recently, companies are taking another look at business performance met- rics and IT. They believe it is time to “put the onion back together” and focus on what 1 This chapter is based on the authors’ previously published article, Smith, H. A., J. D. McKeen, and C. Street. “Linking IT to Business Metrics.” Journal of Information Science and Technology 1, no. 1 (2004): 13–26. Reproduced by permission of the Information Institute. 1 27 28 Section I • Delivering Value with IT really matters to the enterprise. This perspective argues that employees who truly understand what their business is trying to achieve can sense the right ways to per- sonally improve performance that will show up at a business unit and organizational level. “People who understand the business and are informed will be proactive and ... have a disposition to create business value every day in many small and not-so-small ways” (Marchand et al. 2000). Although the connection may not be obvious, they say, it is there nevertheless and can be demonstrated in tangible ways. The key to linking what IT does to business performance is, therefore, to create an environment within which everyone thoroughly understands what measures are important to the business and is held accountable for them. This point of view does not suggest that all the work done to date to learn how IT delivers value to an organization (e.g., business cases, productivity measures) has been unnecessary, only that it is incomplete. Without close attention to business metrics in addition, it is easy for IT initiatives and staff to lose their focus and become less effective. This chapter looks at how these controversial yet compelling ideas are being pursued in organizations to better understand how companies are attempting to link IT work and firm
  • 3. performance through business metrics. The first section describes how business metrics themselves are evolving and looks at how new management philosophies are changing how these measures are communicated and applied. Next it discusses the types of metrics that are important for a well-rounded program of business measurement and how IT can influence them. Then it presents three differ- ent ways companies are specifically linking their IT departments with business met- rics and the benefits and challenges they have experienced in doing this. This section concludes with some general principles for establishing a business measurement pro- gram in IT. Finally, it offers some advice to managers about how to succeed with such a program in IT. Business MeasureMent: an Overview Almost everyone agrees that the primary goal of a business is to make money for its shareholders (Goldratt and Cox 1984; Haspeslagh et al. 2001; Kaplan and Norton 1996). Unfortunately, in large businesses this objective frequently gets lost in the midst of people’s day-to-day activities because profit cannot be measured directly at the level at which most employees in a company work (Haspeslagh et al. 2001). This “missing link” between work and business performance leads companies to look for ways to bridge this gap. They believe that if a firm’s strategies for achieving its goal can be tied much more closely to everyday processes and decision making, frontline employees will be better able to create business value. Proponents of this value-based manage- ment (VBM) approach have demonstrated that an explicit, firmwide commitment to shareholder value, clear communication about how value is created or destroyed, and incentive systems that are linked to key business measures will increase the odds of a positive increase in share price (Haspeslagh et al. 2001). Measurement counts. What a company measures and the way it measures influence both the mindsets of managers and the way people behave. The best measures are tied to business performance and are linked to the strategies and business
  • 4. capabilities of the company. (Marchand et al. 2000) Chapter 3 • Linking IT to Business Metrics 29 Although companies ascribe to this notion in theory, they do not always act in ways that are consistent with this belief. All too often, therefore, because they lack clarity about the links between business performance and their own work, individuals and even business units have to take leaps of faith in what they do (Marchand et al. 2000). Nowhere has this been more of a problem than in IT. As has been noted often, IT investments have not always delivered the benefits expected (Bensaou and Earl 1998; Holland and Sharke 2001; Peslak 2012). “Efforts to measure the link between IT investment and business performance from an economics perspective have... failed to establish a consistent causal linkage with sustained business profitability” (Marchand et al. 2000). Value-based management suggests that if IT staff do not understand the business, they cannot sense how and where to change it effectively with technology. Many IT and business managers have implicitly known this for some time. VBM simply gives them a better framework for implementing their beliefs more systematically. One of the most significant efforts to integrate an organization’s mission and strategy with a measurement system has been Kaplan and Norton’s (1996) balanced scorecard. They explain that competing in the information age is much less about managing physical, tangible assets and much more about the ability of a company to mobilize its intangible assets, such as customer relationships, innovation, employee skills, and information technology. Thus, they suggest that not only should business measures look at how well a company has done in the past (i.e., financial performance), but they also need to look at metrics related to customers, internal business processes, and learning and growth that position the firm to achieve future performance. Although it is difficult putting a reliable monetary value on these items, Kaplan and Norton sug- gest that such nonfinancial measures are critical success factors for superior
  • 5. financial performance in the future. Research shows that this is, in fact, the case. Companies that use a balanced scorecard tend to have a better return on investment (ROI) than those that rely on traditional financial measures alone (Alexander 2000). Today many companies use some sort of scorecard or “dashboard” to track a vari- ety of different metrics of organizational health. However, IT traditionally has not paid much attention to business results, focusing instead on its own internal measures of performance (e.g., IT operations efficiency, projects delivered on time). This has per- petuated the serious disconnect between the business and IT that often manifests itself in perceptions of poor alignment between the two groups, inadequate payoffs from IT investments, poor relationships, and finger-pointing (Holland and Sharke 2001; Peslak 2012; Potter 2013). All too often IT initiatives are conceived with little reference to major business results, relying instead on lower-level business value surrogates that are not always related to these measures. IT organizations are getting much better at this bot- tom-up approach to IT investment (Smith and McKeen 2010), but undelivered IT value remains a serious concern in many organizations. One survey of CFOs found that only 49 percent felt that their ROI expectations for technology had been met (Holland and Sharke 2001). “Despite considerable effort, no practical model has been developed to measure whether a company’s IT investments will definitely contribute to sustainable competitive advantage” (Marchand et al. 2000). Clearly, in spite of significant efforts over many years, traditional IT measurement programs have been inadequate at 30 Section I • Delivering Value with IT assessing business value. Many IT organizations believe, therefore, that it is time for a different approach to delivering IT value, one that holds IT accountable to the same measures and goals as the rest of the business. Key Business Metrics fOr it No one seriously argues that IT has no impact on an
  • 6. organization’s overall financial performance anymore. There may be disagreement about whether it has a positive or a negative impact, but technology is too pervasive and significant an expense in most firms for it not to have some influence on the corporate bottom line. However, as has been argued earlier, we now recognize that neither technology nor business alone is responsible for IT’s financial impact. It is instead a joint responsibility of IT and the busi- ness. This suggests that they need to be held accountable together for its impact. Some companies have accepted this principle for individual IT projects (i.e., holding business and IT managers jointly responsible for achieving their anticipated benefits), yet few have extended it to an enterprise level. VBM suggests that this lack of attention to enter- prise performance by IT is one reason it has been so hard to fully deliver business value for technology investments. Holding IT accountable for a firm’s performance according to key financial metrics is, therefore, an important step toward improving its contribu- tion to the corporate bottom line. However, although financial results are clearly an important part of any mea- surement of a business’s success today, they are not enough. Effective business metrics programs should also include nonfinancial measures, such as customer and employee satisfaction. As already noted, because such nonfinancial measures are predictive of future performance, they offer an organization the opportunity to make changes that will ultimately affect their financial success. Kaplan and Norton (1996) state “the importance of customer satisfaction probably cannot be overemphasized.” Companies that do not understand their customers’ needs will likely lose customers and profitability. Research shows that merely adequate satis- faction is insufficient to lead to customer loyalty and ultimately profit. Only firms where customers are completely or extremely satisfied can achieve this result (Heskett et al. 1994). As a result, many companies now undertake systematic customer satisfaction surveys. However, in
  • 7. IT it is rare to find external customer satisfaction as one of the metrics on which IT is evaluated. While IT’s “customers” are usually considered to be internal, these days technology makes a significant difference in how external custom- ers experience a firm and whether or not they want to do business with it. Systems that are not reliable or available when needed, cannot provide customers with the informa- tion they need, or cannot give customers the flexibility they require are all too common. And with the advent of online business, systems and apps are being designed to inter- face directly with external customers. It is, therefore, appropriate to include external customer satisfaction as a business metric for IT. Another important nonfinancial business measure is employee satisfaction. This is a “leading indicator” of customer satisfaction. That is, employee satisfaction in one year is strongly linked to customer satisfaction and profitability in the next (Koys 2001). Employees’ positive attitudes toward their company and their jobs lead to posi- tive behaviors toward customers and, therefore, to improved financial performance Chapter 3 • Linking IT to Business Metrics 31 (Rucci et al. 1998; Ulrich et al. 1991). IT managers have always watched their own employee satisfaction rate intently because of its close links to employee turnover. However, they often miss the link between IT employee satisfaction and customer satisfaction—both internal customer satisfaction, which leads to improved general employee satisfaction, and external customer satisfaction. Thus, only a few companies hold IT managers accountable for general employee satisfaction. Both customer and employee satisfaction should be part of a business metrics program for IT. With its ever-growing influence in organizations, technology is just as likely to affect external customer and general employee satisfaction as many other areas of a business. This suggests that IT has three different levels of measurement and accountability: 1. Enterprise measures. These tie the work of IT directly to the performance of the organization (e.g., external customer
  • 8. satisfaction, corporate financial performance). 2. Functional measures. These assess the internal work of the IT organization as a whole (e.g., IT employee satisfaction, internal customer satisfaction, operational performance, development productivity). 3. Project measures. These assess the performance of a particular project team in delivering specific value to the organization (e.g., business case benefits, delivery on time). Functional and project measures are usually well addressed by IT measurement programs today. It is the enterprise level that is usually missing. Designing Business Metrics fOr it The firms that hold IT accountable for enterprise business metrics believe this approach fosters a common sense of purpose, enables everyone to make better decisions, and helps IT staff understand the implications of their work for the success of the organi- zation (Haspeslagh et al. 2001; Marchand et al. 2000; Potter 2013; Roberts 2013). The implementation of business metrics programs varies widely among companies, but three approaches taken to linking IT with business metrics are distinguishable. 1. Balanced scorecard. This approach uses a classic balanced scorecard with mea- sures in all four scorecard dimensions (see the “Sample Balanced Scorecard Business Metrics” feature). Each metric is selected to measure progress against the entire enterprise’s business plan. These are then broken down into business unit plans and appropriate submetrics identified. Individual scorecards are then developed with metrics that will link into their business unit scorecards. With this approach, IT is treated as a separate business unit and has its own scorecard linked to the business plan. “Our management finally realized that we need to have everyone thinking in the same way,” explained one manager. “With enterprise systems, we can’t have people working in silos anymore.” The scorecards are very visible in the organization with company and business unit
  • 9. scorecards and those of senior execu- tives posted on the company’s intranet. “People are extremely interested in seeing how we’re doing. Scorecards have provided a common framework for our entire company.” They also provide clarity for employees about their roles in how they affect key business metrics. 32 Section I • Delivering Value with IT Sample Balanced Scorecard Business Metrics • Shareholdervalue(financial) • Expensemanagement(financial) • Customer/clientfocus(customer) • Loyalty(customer) • Customercentricorganization(customer) • Effectivenessandefficiencyofbusinessoperations(operations) • Riskmanagement(operations) • Contributiontofirmwideprioritiesandbusinessinitiatives(growth) Although scorecards have meant that there is better understanding of the business’s drivers and plans at senior management levels, considerable resistance to them is still found at the lower levels in IT. “While developers see how they can affect our customers, they don’t see how they can affect shareholder value, profit, or revenue, and they don’t want to be held accountable for these things,” stated the same manager. She noted that implementing an effective scorecard program relies on three things: good data to provide better metrics, simplicity of metrics, and enforcement. “Now if someone’s scorecard is not complete, they cannot get a bonus. This is a huge incentive to follow the program.” 2. Modified scorecard. A somewhat different approach to a scorecard is taken by one company in the focus group. This firm has selected five key measures (see the “Modified Scorecard Business Metrics” feature) that are closely linked to the com- pany’s overall vision statement. Results are communicated to all staff on a quarterly basis in a short performance report. This includes a clear explanation of each mea- sure, quarterly
  • 10. progress, a comparison with the previous year’s quarterly results, and a “stretch” goal for the organization to achieve. The benefit of this approach is that it orients all employees in the company to the same mission and values. With everyone using the same metrics, alignment is much clearer all the way through the firm, according to the focus group manager. In IT these key enterprise metrics are complemented by an additional set of business measures established by the business units. Each line of business identifies one or two key business unit metrics on which they and their IT team Modified Scorecard Business Metrics · Customer loyalty index. Percentage of customers who said they were very satisfied with the company and would recommend it to others. · Associate loyalty index. Employees’ perception of the company as a great place to work. · Revenue growth. This year’s total revenues as a percentage of last year’s total revenues. · Operating margin. Operating income earned before interest and taxes for every dollar of revenue. · Return on capital employed. Earnings before interest and tax divided by the capital used to generate the earnings. Chapter 3 • Linking IT to Business Metrics 33 will be measured. Functional groups within IT are evaluated according to the same metrics as their business partners as well as on company and internal IT team performance. For example, the credit group in IT might be evaluated on the number of new credit accounts the company acquires. Shared IT services (e.g., infrastructure) are evaluated according to an average of all of the IT func- tional groups’ metrics. The importance the company places on these metrics is reflected in the firm’s generous bonus program (i.e., bonuses can reach up to 230 percent of an individual’s salary) in which all IT staff
  • 11. participate. Bonuses are separate from an individual’s salary, which is linked to personal performance. The percentage influence of each set of business measures (i.e., enterprise, business unit, and individual/team) varies according to the level of the individual in the firm. However, all staff have at least 25 percent of their bonus linked to enterprise performance metrics. No bonuses are paid to anyone if the firm does not reach its earnings-per-share target (which is driven by the five enterprise measures out- lined in the “Modified Scorecard Business Metrics” feature). This incentive sys- tem makes it clear that everyone’s job is connected to business results and helps ensure that attention is focused on the things that are important to the company. As a result, interest is much stronger among IT staff about how the business is doing. “Everyone now speaks the same language,” said the manager. “Project alignment is much easier.” 3. Strategic imperatives. A somewhat different approach is taken by a third focus group company. Here the executive team annually evaluates the key environmen- tal factors affecting the company, then identifies a number of strategic imperatives for the firm (e.g., achieve industry-leading e-business capability, achieve 10–15 percent growth in earnings per share). These can vary according to the needs of the firm in any particular year. Each area of the business is then asked to identify initiatives that will affect these imperatives and to determine how they will be measured (e.g., retaining customers of a recent acquisition, increased net sales, a new product). In the same way, IT is asked to identify the key projects and mea- sures that will help the business to achieve these imperatives. Each part of the company, including IT, then integrates these measures into its variable pay pro- gram (VPP). The company’s VPP links a percentage of an individual’s pay to business results and overall business unit performance. This percentage could vary from a small portion of one’s salary for a new employee to a considerable proportion for senior management. Within IT, the weight that different measures are
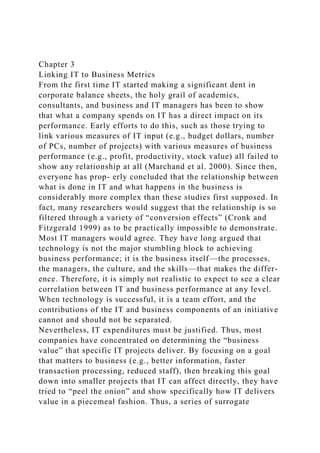
  • 12. accorded in the VPP portion of their pay is determined by a measurement team and approved by the CIO and the president. Figure 3.1 illustrates the different percentages allo- cated to IT’s variable pay component for a typical year. Metrics can change from year to year depending on where management wants to focus everyone’s attention. “Performance tends to improve if you measure it,” explained the manager. “Over the years, we have ratcheted up our targets in different areas. Once a certain level of performance is achieved, we may change the measure or change the emphasis on this measure.” 34 Section I • Delivering Value with IT IT Variable Pay 100% Business Results 40% IT Performance 60% Report Card Goals 30% Key Projects 30% Partner Satisfaction 10% Application Delivery Effectiveness 5% Production Availability 5% Member Retention 5% Product Recovery 5% figure 3.1 Percentage Weightings Assigned to IT Variable Pay Components for a Particular Year An important difference from the scorecard approach is the identification of key IT projects. “These are not all IT projects, but a small number that are closely aligned with the strategic business imperatives,” stated the manager. “Having the success of these projects associated with their variable pay drives everyone’s behavior. People tend to jump in and help if there’s a problem with one of them.” The goal in this process is for everyone to understand the VPP measures and to make them visible within IT. Targets and results are posted quarterly, and small groups of employees meet to discuss ideas about how they can influence business and IT goals. “Some amazing ideas have
  • 13. come out of these meetings,” said the manager. “Everyone knows what’s important, and these measures get attention. People use these metrics to make choices all the time in their work.” Each of these business measurement programs has been implemented somewhat differently, but they all share several key features that could be considered principles of a good business metrics program for IT: 1. Focus on overall business performance. These programs all focus employees on both financial and nonfinancial enterprise performance and have an explicit expecta- tion that everyone in the organization can influence these results in some way. 2. Understanding is a critical success factor. If people are going to be held accountable for certain business results, it is important that they understand them. Similarly, if the organization is worried about certain results, this must be communicated as well. Holding regular staff meetings where people can ask ques- tions and discuss results is effective, as is providing results on a quarterly basis. Understanding is the goal. “If you can ask ... a person programming code and they can tell you three to four of their objectives and how those tie into the compa- ny’s performance and what the measures of achieving those objectives are, you’ve got it” (Alexander 2000). 3. Simplicity. Successful companies tend to keep their measures very simple and easy to use (Haspeslagh et al. 2001). In each approach already outlined, a limited number of measures are used. This makes it very easy for employees to calculate Chapter 3 • Linking IT to Business Metrics 35 their bonuses (or variable pay) based on the metrics provided, which further strengthens the linkage between company performance and individual effort. 4. Visibility. In each of the programs already discussed, metrics were made widely available to all staff on a quarterly basis. In one case they are posted on the com- pany’s intranet; in another they are distributed in a printed report; in a third they are
  • 14. posted in public areas of the office. Visibility encourages employee buy-in and accountability and stimulates discussion about how to do better or what is working well. 5. Links to incentive systems. Successful companies tend to include a much larger number of employees in bonus programs than unsuccessful ones (Haspeslagh et al. 2001). Extending incentive schemes to all IT staff, not just management, is important to a measurement program’s effectiveness. The most effective programs appear to distinguish between fair compensation for individual work and competencies and a reward for successfully achieving corporate objectives. aDvice tO Managers The focus group had some final advice for other IT managers who are thinking of implementing a business metrics program: • Results will take time. It takes time to change attitudes and behavior in IT, but it is worth making the effort. Positive results may take from six months to a year to appear. “We had some initial pushback from our staff at the beginning,” said one manager, “but now the metrics program has become ingrained in our attitudes and behaviors.” Another manager noted, “We had a few bumps during our first year, but everyone, especially our executives, is getting better at the program now [that] we’re in our third year. It really gets our staff engaged with the business.” If there has been no dramatic difference within three years, management should recognize that it is either using the wrong measures or hasn’t got employee buy-in to the pro- gram (Alexander 2000). • Have common goals. Having everyone measured on the same business goals helps build a strong team at all levels in the organization. It makes it easier to set priorities as a group and collaborate and share resources, as needed. · Follow up on problem areas. Companies must be prepared to take action about poor results and involve staff in their plans. In particular, if companies are going to ask customers and
  • 15. employees what they think, they must be prepared to act on the results. All metrics must be taken seriously and acted on if they are to be used to drive behavior and lead to continuous improvement. · Be careful what you measure. Measuring something makes people pay attention to it, particularly if it is linked to compensation. Metrics must, therefore, be selected with care because they will be a major driver of behavior. For example, if incen- tives are solely based on financial results, it is probable that some people may be so driven that they will trample on the needs and interests of others. Similarly, if only costs are measured, the needs of customers could be ignored. Conversely, if a metric indicates a problem area, organizations can expect to see a lot of ingenuity and sup- port devoted to addressing it. 36 Section I • Delivering Value with IT • Don’t use measurement as a method of control. A business metrics program should be designed to foster an environment in which people look beyond their own jobs and become proactive about the needs of the organization (Marchand et al. 2000). It should aim to communicate strategy and help align individual and organizational initiatives (Kaplan and Norton 1996). All managers should clearly understand that a program of this but rather as a motivational tool. Conclusion Getting the most value out of IT has been a serious concern of business for many years. In spite of considerable effort, measurement initiatives in IT that use surrogates of busi- ness value or focus on improving internal IT behavior have not been fully successful in delivering results. Expecting IT to participate in achieving specific enterprise objectives— the same goals as the rest of the organiza- tion—has been shown to deliver significant benefits. Not only are there demonstrable financial returns, but there is also consider- able long-term value in aligning everyone’s behavior with the same goals; people become more supportive of each other and more
  • 16. References Alexander, S. “Business Metrics.” Computerworld 34, no. 24 (2000): 64. Bensaou, M., and M. Earl. “The Right Mind-Set for Managing Information Technology.” Harvard Business Review 76, no. 5 (September–October 1998): 110–28. Cronk, M., and E. Fitzgerald. “Understanding ‘IS Business Value’: Derivation of Dimensions.” Logistics Information Management 12, no. 1–2 (1999): 40–49. Goldratt, E., and J. Cox. The Goal: Excellence in Manufacturing. Croton-on-Hudson, NY: North River Press, 1984. Haspeslagh, P., T. Noda, and F. Boulos. “Managing for Value: It’s Not Just About the Numbers.” Harvard Business Review (July–August 2001): 65–73. type should not be used for controlling behavior, sensitive to the greater corporate good, and decisions are easier to make. A good business metrics program, therefore, appears to be a powerful component of effective measure- ment in IT. IT employees may initially resist accountability for business results, but the experiences of the focus group demonstrate that their objections are usually short lived. If a business measurement program is carefully designed, properly linked to an incentive pro- gram, widely implemented, and effectively monitored by management, it is highly likely that business performance will become an integral part of the mind-set of all IT staff and ultimately pay off in a wide variety of ways. Heskett, J., T. Jones, G. Loveman, E. Sasser, and L. Schlesinger. “Putting the Service Profit Chain to Work.” Harvard Business Review (March– April 1994): 164–74. Holland, W., and G. Sharke. “Is Your IT System VESTed?” Strategic Finance 83, no. 6 (December 2001): 34–37. Kaplan, R., and D. Norton. The Balanced Scorecard. Boston: Harvard Business School Press, 1996. Koys, D. “The Effects of Employee Satisfaction, Organizational Citizenship Behavior, and Turnover on Organizational
  • 17. Effectiveness: A Unit-Level, Longitudinal Study.” Personnel Psychology 54, no. 1 (Spring 2001): 101–14. Marchand, D., W. Kettinger, and J. Rollins. “Information Orientation: People, Technology and the Bottom Line.” Sloan Management Review (Summer 2000): 69–89. Peslak, A. R. “An Analysis of Critical Information Technology Issues Facing Organizations.” Industrial Management and Data Systems 112, no. 5 (2012): 808–27. Potter, K. “Business Key Metrics Data: Accelerate the IT Value Journey.” Gartner Group, ID: G00256958, October 16, 2013. Roberts, J. P. “Define Strategic IT Metrics as Part of Your IT Strategy.” Gartner Group, ID: G0025861, November 5, 2013. Chapter 3 • Linking IT to Business Metrics 37 Rucci, A., S. Kirn, and R. Quinn. “The Employee- Customer- Profit Chain at Sears.” Harvard Business Review 76 (January/February 1998): 82–97. Smith, H., and J. McKeen. “Investment Spend Optimization at BMO Financial Group.” MISQ Executive 9, no. 2 (June 2010): 65–81. Ulrich, D., R. Halbrook, D. Meder, M. Stuchlik, and S. Thorpe. “Employee and Customer Attachment: Synergies for Competitive Advantage.” Human Resource Planning 14 (1991): 89–103.