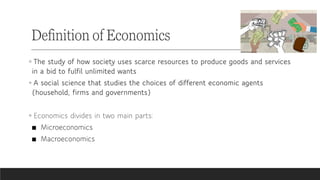
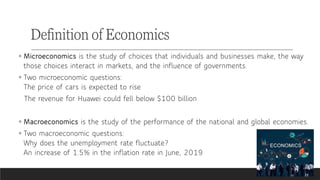
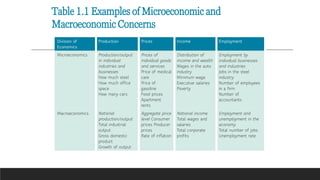
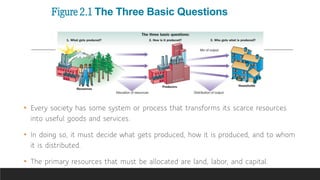
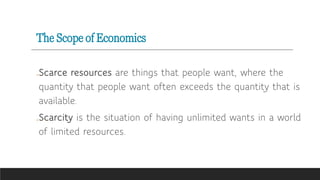
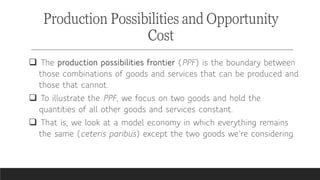
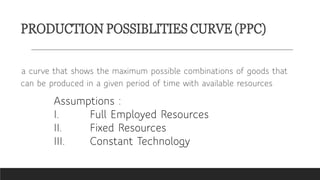
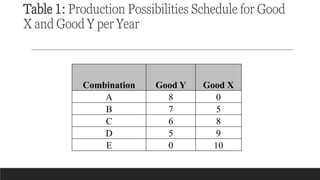
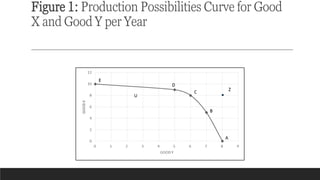
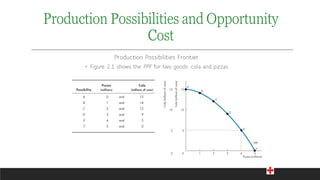
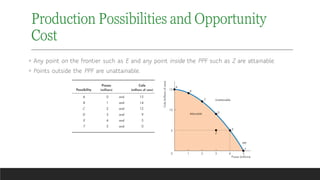
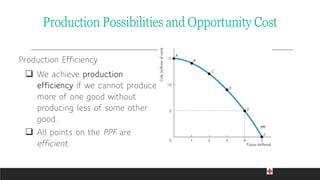
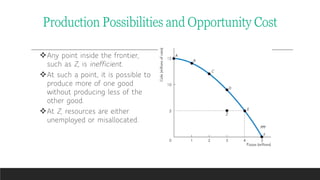
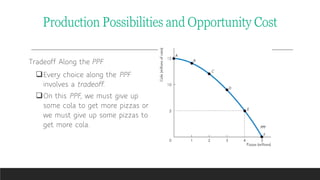
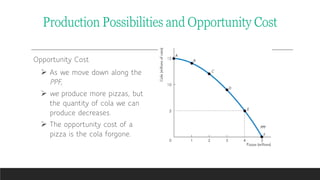
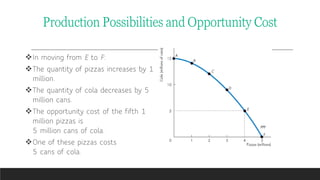
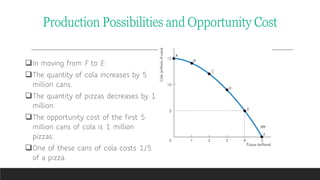
SMP 10103
PRINCIPLES OF ECONOMICS
CHAPTER 1
INTRODUCTION TO ECONOMICS
DR. NOORAZEELA ZAINOL ABIDIN
WHAT IS ECONOMICS?
1
LEARNING OUTCOME
DEFINE ECONOMICS AND
DISTINGUISH BETWEEN
MICROECONOMICS AND
MACROECONOMICS
EXPLAIN THE TWO BIG
QUESTIONS OF ECONOMICS
SCARCITY, CHOICE, AND
OPPORTUNITY COST
PRODUCTION
POSSIBILITIES CURVE
◦ The study of how society uses scarce resources to produce goods and services
in a bid to fulfil unlimited wants
◦ A social science that studies the choices of different economic agents
(household, firms and governments)
◦ Economics divides in two main parts:
■ Microeconomics
■ Macroeconomics
Definition of Economics
◦ Microeconomics is the study of choices that individuals and businesses make, the way
those choices interact in markets, and the influence of governments.
◦ Two microeconomic questions:
The price of cars is expected to rise
The revenue for Huawei could fell below $100 billion
◦ Macroeconomics is the study of the performance of the national and global economies.
◦ Two macroeconomic questions:
Why does the unemployment rate fluctuate?
An increase of 1.5% in the inflation rate in June, 2019
Definition of Economics
Table 1.1 Examples of Microeconomic and
Macroeconomic Concerns
Division of
Economics
Production Prices Income Employment
Microeconomics Production/output
in individual
industries and
businesses
How much steel
How much office
space
How many cars
Prices of
individual goods
and services
Price of medical
care
Price of
gasoline
Food prices
Apartment
rents
Distribution of
income and wealth
Wages in the auto
industry
Minimum wage
Executive salaries
Poverty
Employment by
individual businesses
and industries
Jobs in the steel
industry
Number of employees
in a firm
Number of
accountants
Macroeconomics National
production/output
Total industrial
output
Gross domestic
product
Growth of output
Aggregate price
level Consumer
prices Producer
prices
Rate of inflation
National income
Total wages and
salaries
Total corporate
profits
Employment and
unemployment in the
economy
Total number of jobs
Unemployment rate
The Method of Economics
Economics deals with two kinds of questions: positive and normative.
positive economics An approach to economics that seeks to understand
behavior and the operation of systems without making judgments. It
describes what exists and how it works.
normative economics An approach to economics that analyzes outcomes
of economic behavior, evaluates them as good or bad, and may prescribe
courses of action. Also called policy economics.
POSITIVE ECONOMICS
• deals with facts and figures
• “what is?”
• “if X, then Y.”
• For example
I. the unemployment rate was 4.55% in 2020.
II. if the exports increases by 8%, the national income will rise by 5%.
NORMATIVE ECONOMICS
deals with value judgements or opinions
“what should be?”
For example
I. the government should provide an incentive for the poor
II. The minimum wage needs to be increased to RM1, 500
FUNDAMENTAL ECONOMIC QUESTIONS
What to Produce?
How to Produce?
For Whom to Produce?
THREE MAIN ECONOMIC CHOICES
11
There are 3 main issues of economics, involving what, how & for whom goods and services
should be produced.
What Should Be Produced? – in what quantities?
since resources are not sufficiently available – focus on the production of
commodities which give it a cost advantage over other products.
What to produce is an important question in every economy, because it involves
where the economy will focus most in its specializations.
How?
Goods and services are produced by using
productive resources that economists call factors
of production.
Economic Questions
FACTORS OF PRODUCTION
Labour
Land
Capital
Entrepreneur
THREE MAIN ECONOMIC CHOICES
14
How Should It Be Produced?
1. Land: This refers to the “gift of nature” – fixed and limited => enables countries to
enhance the production processes for transforming natural resources into real consumer
goods.
Though some natural resources are include timber, food and animals, which are
renewable, physical land is usually a static resource in nature.
THREE MAIN ECONOMIC CHOICES
15
How Should It Be Produced?
2. Labor: This refers to the human capital– mainly determined by educational status
refers to the capable, able-bodied individuals who work in the different sectors of
the economy.
Unlike land, labor is mobile, as it can move from one industry to another or from one
location to another. Training and development, especially related to education, are
important elements of promoting the level of human capital in an economy.
THREE MAIN ECONOMIC CHOICES
16
How Should It Be Produced?
3. Capital: This refers to financial resources used to acquire other factors of production
required for the production process.
It includes two economic definitions: monetary resources firms apply to buy natural
resources, land and other goods required in the production process, and also refers to the
main physical assets firms and individuals use to produce goods and services – buildings,
production facilities, equipment, vehicles, etc.
THREE MAIN ECONOMIC CHOICES
17
How Should It Be Produced?
4. Entrepreneurs: These are the owners of the business or the persons who coordinate
the overall economic activities of a company.
Entrepreneurship is regarded as a factor of production since someone must take care
of the overall managerial functions of gathering, allocating and distributing economic
resources to consumers and other businesses in the country or even outside the
country.
For Whom?
◦ Who gets the goods and services depends on the incomes that
people earn.
■ Land earns rent.
■ Labor earns wages.
■ Capital earns interest.
■ Entrepreneurship earns profit.
Economic Questions
THREE MAIN ECONOMIC CHOICES
19
For Whom Should It Be Produced?
This it relates to where the goods produced will end up, as such goods and
services will be used by consumers in the society or exported to other
countries.
Earnings due to participation in the production of goods and services is
divided across the four factors of production that transform the inputs into
outputs. i.e. Capital earns interest, Entrepreneurship earns profit, Labor
earns wages, Land earns rent.
Figure 2.1 The Three Basic Questions
• Every society has some system or process that transforms its scarce resources
into useful goods and services.
• In doing so, it must decide what gets produced, how it is produced, and to whom
it is distributed.
• The primary resources that must be allocated are land, labor, and capital.
BASIC ECONOMIC PROBLEMS
Scarcity
Choices
Opportunity Cost
The Scope of Economics
Scarce resources are things that people want, where the
quantity that people want often exceeds the quantity that is
available.
Scarcity is the situation of having unlimited wants in a world
of limited resources.
To Learn a Way of Thinking
Opportunity Cost
 opportunity cost The best alternative that we
forgo, or give up, when we make a choice or
decision.
ECONOMIC PROBLEMS
24
If watching premier league is more important than the two
available needs, so we have to give up = study at night &
going to the movies.
 The production possibilities frontier (PPF) is the boundary between
those combinations of goods and services that can be produced and
those that cannot.
 To illustrate the PPF, we focus on two goods and hold the
quantities of all other goods and services constant.
 That is, we look at a model economy in which everything remains
the same (ceteris paribus) except the two goods we’re considering.
Production Possibilities and Opportunity
Cost
PRODUCTION POSSIBLITIES CURVE (PPC)
a curve that shows the maximum possible combinations of goods that
can be produced in a given period of time with available resources
Assumptions :
I. Full Employed Resources
II. Fixed Resources
III. Constant Technology
Table 1: Production Possibilities Schedule for Good
X and Good Y per Year
Combination Good Y Good X
A 8 0
B 7 5
C 6 8
D 5 9
E 0 10
Figure 1: Production Possibilities Curve for Good
X and Good Y per Year
Production Possibilities Frontier
◦ Figure 2.1 shows the PPF for two goods: cola and pizzas.
Production Possibilities and Opportunity
Cost
◦ Any point on the frontier such as E and any point inside the PPF such as Z are attainable.
◦ Points outside the PPF are unattainable.
Production Possibilities and Opportunity
Cost
Production Efficiency
 We achieve production
efficiency if we cannot produce
more of one good without
producing less of some other
good.
 All points on the PPF are
efficient.
Production Possibilities and Opportunity Cost
Any point inside the frontier,
such as Z, is inefficient.
At such a point, it is possible to
produce more of one good
without producing less of the
other good.
At Z, resources are either
unemployed or misallocated.
Production Possibilities and Opportunity Cost
Tradeoff Along the PPF
Every choice along the PPF
involves a tradeoff.
On this PPF, we must give up
some cola to get more pizzas or
we must give up some pizzas to
get more cola.
Production Possibilities and Opportunity Cost
Opportunity Cost
 As we move down along the
PPF,
 we produce more pizzas, but
the quantity of cola we can
produce decreases.
 The opportunity cost of a
pizza is the cola forgone.
Production Possibilities and Opportunity Cost
In moving from E to F:
The quantity of pizzas increases by 1
million.
The quantity of cola decreases by 5
million cans.
The opportunity cost of the fifth 1
million pizzas is
5 million cans of cola.
One of these pizzas costs
5 cans of cola.
Production Possibilities and Opportunity Cost
In moving from F to E:
The quantity of cola increases by 5
million cans.
The quantity of pizzas decreases by 1
million.
The opportunity cost of the first 5
million cans of cola is 1 million
pizzas.
One of these cans of cola costs 1/5
of a pizza.
Production Possibilities and Opportunity Cost
FACTORS THAT CAN SHIFT PRODUCTION
POSSIBILITY CURVE
Changes in Resources
Technology change
Figure 2: An Outward Shift of the Production
Possibilities Curve for Palm Oil
Figure 3: An Outward Shift of the Production
Possibilities Curve for Rubber
Figure 4: An Outward Shift of the Production
Possibilities Curve for Rubber and Palm Oil
CONSTANT OPPORTUNITY COST
Table 2: Production Possibilities Schedule for Good X and Good Y per Year (Constant Opportunity
Cost)
Combination Good Y Good X
A 40 0
B 30 10
C 20 20
D 10 30
E 0 40
Figure 5: Production Possibilities Curve for Good X
and Good Y per Year (Constant Opportunity Cost)
Chapter 1 Introduction to Economics.pdf

Chapter 1 Introduction to Economics.pdf

  • 1.
    SMP 10103 PRINCIPLES OFECONOMICS CHAPTER 1 INTRODUCTION TO ECONOMICS DR. NOORAZEELA ZAINOL ABIDIN
  • 2.
  • 3.
    LEARNING OUTCOME DEFINE ECONOMICSAND DISTINGUISH BETWEEN MICROECONOMICS AND MACROECONOMICS EXPLAIN THE TWO BIG QUESTIONS OF ECONOMICS SCARCITY, CHOICE, AND OPPORTUNITY COST PRODUCTION POSSIBILITIES CURVE
  • 4.
    ◦ The studyof how society uses scarce resources to produce goods and services in a bid to fulfil unlimited wants ◦ A social science that studies the choices of different economic agents (household, firms and governments) ◦ Economics divides in two main parts: ■ Microeconomics ■ Macroeconomics Definition of Economics
  • 5.
    ◦ Microeconomics isthe study of choices that individuals and businesses make, the way those choices interact in markets, and the influence of governments. ◦ Two microeconomic questions: The price of cars is expected to rise The revenue for Huawei could fell below $100 billion ◦ Macroeconomics is the study of the performance of the national and global economies. ◦ Two macroeconomic questions: Why does the unemployment rate fluctuate? An increase of 1.5% in the inflation rate in June, 2019 Definition of Economics
  • 6.
    Table 1.1 Examplesof Microeconomic and Macroeconomic Concerns Division of Economics Production Prices Income Employment Microeconomics Production/output in individual industries and businesses How much steel How much office space How many cars Prices of individual goods and services Price of medical care Price of gasoline Food prices Apartment rents Distribution of income and wealth Wages in the auto industry Minimum wage Executive salaries Poverty Employment by individual businesses and industries Jobs in the steel industry Number of employees in a firm Number of accountants Macroeconomics National production/output Total industrial output Gross domestic product Growth of output Aggregate price level Consumer prices Producer prices Rate of inflation National income Total wages and salaries Total corporate profits Employment and unemployment in the economy Total number of jobs Unemployment rate
  • 7.
    The Method ofEconomics Economics deals with two kinds of questions: positive and normative. positive economics An approach to economics that seeks to understand behavior and the operation of systems without making judgments. It describes what exists and how it works. normative economics An approach to economics that analyzes outcomes of economic behavior, evaluates them as good or bad, and may prescribe courses of action. Also called policy economics.
  • 8.
    POSITIVE ECONOMICS • dealswith facts and figures • “what is?” • “if X, then Y.” • For example I. the unemployment rate was 4.55% in 2020. II. if the exports increases by 8%, the national income will rise by 5%.
  • 9.
    NORMATIVE ECONOMICS deals withvalue judgements or opinions “what should be?” For example I. the government should provide an incentive for the poor II. The minimum wage needs to be increased to RM1, 500
  • 10.
    FUNDAMENTAL ECONOMIC QUESTIONS Whatto Produce? How to Produce? For Whom to Produce?
  • 11.
    THREE MAIN ECONOMICCHOICES 11 There are 3 main issues of economics, involving what, how & for whom goods and services should be produced. What Should Be Produced? – in what quantities? since resources are not sufficiently available – focus on the production of commodities which give it a cost advantage over other products. What to produce is an important question in every economy, because it involves where the economy will focus most in its specializations.
  • 12.
    How? Goods and servicesare produced by using productive resources that economists call factors of production. Economic Questions
  • 13.
  • 14.
    THREE MAIN ECONOMICCHOICES 14 How Should It Be Produced? 1. Land: This refers to the “gift of nature” – fixed and limited => enables countries to enhance the production processes for transforming natural resources into real consumer goods. Though some natural resources are include timber, food and animals, which are renewable, physical land is usually a static resource in nature.
  • 15.
    THREE MAIN ECONOMICCHOICES 15 How Should It Be Produced? 2. Labor: This refers to the human capital– mainly determined by educational status refers to the capable, able-bodied individuals who work in the different sectors of the economy. Unlike land, labor is mobile, as it can move from one industry to another or from one location to another. Training and development, especially related to education, are important elements of promoting the level of human capital in an economy.
  • 16.
    THREE MAIN ECONOMICCHOICES 16 How Should It Be Produced? 3. Capital: This refers to financial resources used to acquire other factors of production required for the production process. It includes two economic definitions: monetary resources firms apply to buy natural resources, land and other goods required in the production process, and also refers to the main physical assets firms and individuals use to produce goods and services – buildings, production facilities, equipment, vehicles, etc.
  • 17.
    THREE MAIN ECONOMICCHOICES 17 How Should It Be Produced? 4. Entrepreneurs: These are the owners of the business or the persons who coordinate the overall economic activities of a company. Entrepreneurship is regarded as a factor of production since someone must take care of the overall managerial functions of gathering, allocating and distributing economic resources to consumers and other businesses in the country or even outside the country.
  • 18.
    For Whom? ◦ Whogets the goods and services depends on the incomes that people earn. ■ Land earns rent. ■ Labor earns wages. ■ Capital earns interest. ■ Entrepreneurship earns profit. Economic Questions
  • 19.
    THREE MAIN ECONOMICCHOICES 19 For Whom Should It Be Produced? This it relates to where the goods produced will end up, as such goods and services will be used by consumers in the society or exported to other countries. Earnings due to participation in the production of goods and services is divided across the four factors of production that transform the inputs into outputs. i.e. Capital earns interest, Entrepreneurship earns profit, Labor earns wages, Land earns rent.
  • 20.
    Figure 2.1 TheThree Basic Questions • Every society has some system or process that transforms its scarce resources into useful goods and services. • In doing so, it must decide what gets produced, how it is produced, and to whom it is distributed. • The primary resources that must be allocated are land, labor, and capital.
  • 21.
  • 22.
    The Scope ofEconomics Scarce resources are things that people want, where the quantity that people want often exceeds the quantity that is available. Scarcity is the situation of having unlimited wants in a world of limited resources.
  • 23.
    To Learn aWay of Thinking Opportunity Cost  opportunity cost The best alternative that we forgo, or give up, when we make a choice or decision.
  • 24.
    ECONOMIC PROBLEMS 24 If watchingpremier league is more important than the two available needs, so we have to give up = study at night & going to the movies.
  • 25.
     The productionpossibilities frontier (PPF) is the boundary between those combinations of goods and services that can be produced and those that cannot.  To illustrate the PPF, we focus on two goods and hold the quantities of all other goods and services constant.  That is, we look at a model economy in which everything remains the same (ceteris paribus) except the two goods we’re considering. Production Possibilities and Opportunity Cost
  • 26.
    PRODUCTION POSSIBLITIES CURVE(PPC) a curve that shows the maximum possible combinations of goods that can be produced in a given period of time with available resources Assumptions : I. Full Employed Resources II. Fixed Resources III. Constant Technology
  • 27.
    Table 1: ProductionPossibilities Schedule for Good X and Good Y per Year Combination Good Y Good X A 8 0 B 7 5 C 6 8 D 5 9 E 0 10
  • 28.
    Figure 1: ProductionPossibilities Curve for Good X and Good Y per Year
  • 29.
    Production Possibilities Frontier ◦Figure 2.1 shows the PPF for two goods: cola and pizzas. Production Possibilities and Opportunity Cost
  • 30.
    ◦ Any pointon the frontier such as E and any point inside the PPF such as Z are attainable. ◦ Points outside the PPF are unattainable. Production Possibilities and Opportunity Cost
  • 31.
    Production Efficiency  Weachieve production efficiency if we cannot produce more of one good without producing less of some other good.  All points on the PPF are efficient. Production Possibilities and Opportunity Cost
  • 32.
    Any point insidethe frontier, such as Z, is inefficient. At such a point, it is possible to produce more of one good without producing less of the other good. At Z, resources are either unemployed or misallocated. Production Possibilities and Opportunity Cost
  • 33.
    Tradeoff Along thePPF Every choice along the PPF involves a tradeoff. On this PPF, we must give up some cola to get more pizzas or we must give up some pizzas to get more cola. Production Possibilities and Opportunity Cost
  • 34.
    Opportunity Cost  Aswe move down along the PPF,  we produce more pizzas, but the quantity of cola we can produce decreases.  The opportunity cost of a pizza is the cola forgone. Production Possibilities and Opportunity Cost
  • 35.
    In moving fromE to F: The quantity of pizzas increases by 1 million. The quantity of cola decreases by 5 million cans. The opportunity cost of the fifth 1 million pizzas is 5 million cans of cola. One of these pizzas costs 5 cans of cola. Production Possibilities and Opportunity Cost
  • 36.
    In moving fromF to E: The quantity of cola increases by 5 million cans. The quantity of pizzas decreases by 1 million. The opportunity cost of the first 5 million cans of cola is 1 million pizzas. One of these cans of cola costs 1/5 of a pizza. Production Possibilities and Opportunity Cost
  • 37.
    FACTORS THAT CANSHIFT PRODUCTION POSSIBILITY CURVE Changes in Resources Technology change
  • 38.
    Figure 2: AnOutward Shift of the Production Possibilities Curve for Palm Oil
  • 39.
    Figure 3: AnOutward Shift of the Production Possibilities Curve for Rubber
  • 40.
    Figure 4: AnOutward Shift of the Production Possibilities Curve for Rubber and Palm Oil
  • 41.
    CONSTANT OPPORTUNITY COST Table2: Production Possibilities Schedule for Good X and Good Y per Year (Constant Opportunity Cost) Combination Good Y Good X A 40 0 B 30 10 C 20 20 D 10 30 E 0 40
  • 42.
    Figure 5: ProductionPossibilities Curve for Good X and Good Y per Year (Constant Opportunity Cost)