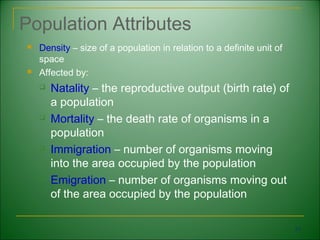
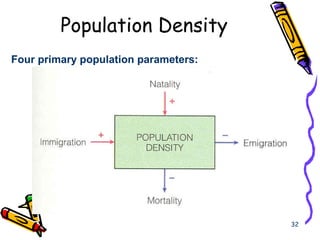
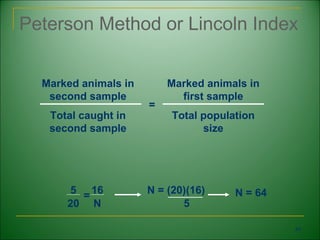
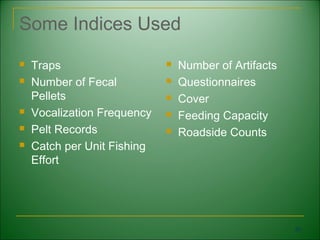
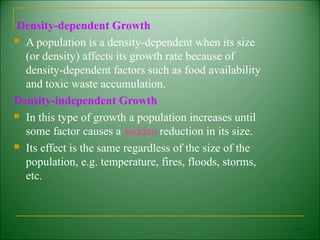
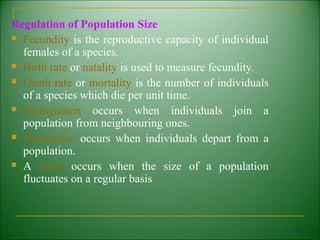
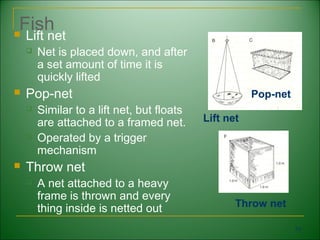
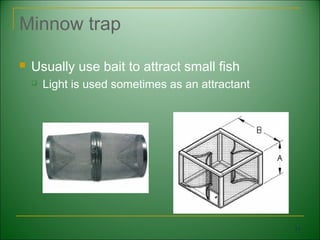
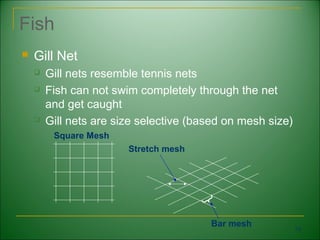
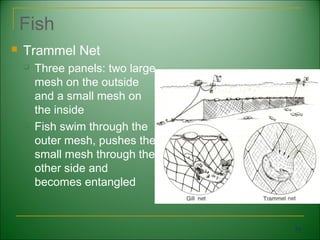
This document provides information on various ecological sampling techniques used in field investigations and population ecology studies. It discusses the importance of sampling, as counting every individual in a population is usually impossible. Common sampling methods include quadrats, transects, and capture-recapture. Quadrats involve counting organisms within a defined area, while transects sample along a line or belt. Capture-recapture allows estimating population size by marking and recapturing individuals. Factors like habitat, organism size, and sampling goals determine the appropriate sampling method and unit size. Population attributes like density, birth and death rates can provide insights into how environmental factors regulate population sizes.
This document discusses two methods for estimating population size: the Lincoln Index and the quadrat method. The Lincoln Index involves capturing, marking, and recapturing a sample of individuals to estimate the total population size using a calculation. The quadrat method involves randomly placing quadrats (sample areas) throughout a total area and counting individuals within each quadrat. The mean number of individuals per quadrat is then extrapolated to the total area to estimate the overall population size.
Population ecology is the study of the relationships between populations and their environment. A population is defined as a group of the same species occupying a particular area. Characteristics of a population include its size, density, and distribution. Biotic interactions like competition and predation regulate population growth. Techniques like quadrat sampling, capture-mark-recapture, and random sampling are used to estimate population size, density, and distribution. Abiotic factors like temperature, light, humidity, and pH influence an organism's population distribution.
Population counting method line transect, point count, mark and recaptureTarique Bin Aziz
Line transect, point count, and mark-recapture are three common population counting methods. Line transect involves walking or flying along a straight transect line and recording sightings and their perpendicular distances. Point count involves recording all birds seen and heard from count stations for a set time period. Mark-recapture involves capturing and marking a sample of the population, releasing them, then capturing another sample to estimate the total population size based on the proportion that were marked. Each method makes assumptions about animal behavior and has advantages such as being economical or applicable throughout the year as well as disadvantages like missing rare species.
The document outlines a study to determine the population sizes of two plant species, mimosa pudica and imperata cylindrica, in a school field. Quadrats of 1m x 1m will be used to count the coverage of each species in random locations. The percentage coverage will be calculated for each species and compared to test the hypothesis that mimosa pudica has a higher population size than imperata cylindrica in the school field. Materials needed include the two plant species, quadrats, recording materials, and tools for calculating percentages.
This document discusses various methods for sampling plant communities. It describes transect and quadrat sampling methods. Transects involve recording plant species along a line or measuring their vertical distribution by digging trenches. Quadrats involve placing a grid and counting organisms within each square. The document also discusses measuring density, coverage, frequency, biomass, and diversity of plant species within samples. It provides formulas for calculating these metrics and comparing values between species.
Dynamic ecosystems - Population SamplingRichardBader
This document discusses dynamic ecosystems, including abiotic and biotic factors, stratification due to varying conditions, intertidal zonation, qualitative and quantitative data collection, geographic range and distribution of organisms, population sampling techniques like transects and quadrats, and capture-mark-recapture estimates of mobile species populations. It also covers density, carrying capacity, and a example calculation to estimate a frog population using the capture-mark-recapture method.
Giovanna Noe-Wilson studied the diversity of benthic foraminifera in different elevations and seasons in Madison, Connecticut using microscopy and molecular techniques. She found that the dominant species, Arnoldiellina fluorescens, was highly abundant across most sites and seasons. Species diversity varied between sites but not clearly with elevation. Seasonality influenced species distribution and diversity. Combining morphological and molecular identification provided a better understanding of foraminiferal communities and will serve as a baseline for future climate impact studies.
1) The document describes the quadrat sampling method, a technique used to estimate population sizes of organisms that do not move around much like plants, shells, and some beetles.
2) The method involves constructing quadrats (square frames) of a fixed size within the study area and randomly selecting some number of quadrats. All organisms of the target species within each quadrat are then counted.
3) The average number of each species per quadrat is calculated and multiplied by the total number of quadrats to estimate the overall population size for that species within the entire area.
This document discusses techniques for ecological monitoring. It begins by listing "sins" or mistakes that commonly occur in ecological monitoring like not having a clear purpose, not storing data properly, or changing methodologies. It then defines ecological monitoring as the systematic collection of ecological data over time related to a specific problem. Key areas where monitoring is needed are described. The document uses the example of monitoring amphibians in the Sharavathi River basin to illustrate how to plan a monitoring study, including setting objectives, understanding the study species, reviewing literature, determining sampling methods, and statistical analysis. Details are provided on amphibian biology and their importance as ecosystem and environmental indicators. The study area and sampling methods used are described.
This document discusses several methods for estimating population abundance and size, including density, abundance, biomass, capture-recapture sampling, removal sampling, transect sampling, and regression method. Capture-recapture sampling involves marking a subset of individuals from a population, releasing them, recapturing them later, and using the ratio of marked to unmarked individuals to estimate total population size. Removal sampling works by successively trapping individuals and assuming catch size will decrease as population size decreases. Transect sampling involves recording distances of observed individuals from an established line to yield density estimates.
Final Year Project proposal (Degree of Agrotech)Asma Sams
this is my slide about the final year project proposal with title " effect of water temperature and dipping time in crisping process of ipomoea reptans"
This document provides an overview of various fishing gears and methods. It begins with an outline of the course topics, which include the study and classification of fishing gears and crafts. It then describes different gear types such as beam trawling, demersal otter trawling, dredging, drift nets, fish attraction devices, gill/fixed nets, handlines, jigging, longlining, pelagic trawling, pole and line fishing, and pots. For each gear type, it explains how it is used to target particular species. The document provides a comprehensive reference for different fishing techniques around the world.
Hydroelectric generation uses the kinetic energy of flowing water to generate electricity. Water spins a turbine connected to a generator, which contains a rotor with magnets that spins inside a stator with coils of wire, inducing electricity in the coils. Most hydroelectric stations use dams to raise water levels and increase the force of falling water to spin the turbine. The generator converts this rotational energy into electrical energy that can power homes and businesses. Building a small-scale hydroelectric generator requires a turbine, generator parts like a rotor and stator, and a water source to drive the turbine. Hydroelectric power has advantages of being renewable, producing no pollution, and being very reliable.
The document compares the cost of designing a building using different structural systems, including a dual system without beams, building frame system with beams, and other options. It finds that the dual system without beams has the lowest total cost at $80 million, while the most expensive is the moment resisting system with beams at $120 million. Charts and tables show the cost breakdown by structural element and comparisons of total costs for each system.
The document outlines guidelines for formatting a final year project proposal. It includes sections for the project title, student names and roll numbers, main text formatting, headings formatting, figures and tables, and references. Guidelines are provided for font type, size, indentation, spacing, capitalization, and other formatting rules to maintain a consistent structure and appearance.
The document provides key information about investigating populations, including methods such as using quadrats, transects, mark-release-recapture, and analyzing data. Quadrats can be point quadrats or frame quadrats, and random or systematic sampling is important. Population size is limited by factors like food, water, disease, and predators. Population growth follows a typical curve with three phases: slow growth, rapid growth, and a stable state. Abiotic factors like temperature and light also influence population size.
Plant sampling methods include transects, quadrats, and aerial observations. Transects measure vegetation variation along a line, showing how plant communities change with the environment. Quadrats quantify plant coverage and abundance within a grid. Both methods are used to measure density, coverage, frequency, biomass, and diversity of plant populations. Sampling provides a representative view of a whole community and avoids bias.
This document discusses biodiversity, including its definition, components, and methods for measuring it. Biodiversity refers to the variety of species, habitats, and genetic diversity in an area. It can be measured by species diversity, habitat diversity, and genetic diversity. Methods for measuring biodiversity include counting species richness, calculating Simpson's Diversity Index using population data from quadrats, mark-recapture studies using the Lincoln Index, and chemical fogging to sample canopy insects. Global patterns of biodiversity are also addressed.
Topic 2.5: investigating ecosystems - Vegetation Sampling Part 1Nigel Gardner
The document discusses different methods for sampling vegetation, including quadrats, transects, and sampling systems. It describes the different types of quadrats - plain, cover, and point - and how transects can be used in the form of line, belt, and interval transects. Random sampling is presented as an objective technique but limitations are discussed. The number of quadrats needed is calculated based on variability between samples. Different attributes that can be measured are also outlined, including density, cover, and abundance.
Pest surveillance involves regularly monitoring pest populations over time in a given area to assess changes. It is important for determining which pest control measures to implement. Common methods of pest surveillance include qualitative and quantitative surveys using various traps, counts, and indices to estimate pest numbers and damage. The key objectives are to identify pests, study population dynamics, estimate crop losses, and monitor how weather and other factors influence pest levels to forecast problems and schedule management actions.
This document outlines the steps and objectives for students to conduct a study of a selected ecosystem. The main activities involve noting the features of the ecosystem, identifying plants and animals using keys, conducting qualitative and quantitative surveys of organisms, examining how organisms are adapted to the environment, and constructing food chains, webs and pyramids to illustrate energy transfer. Students will study a minimum of 10 organisms, including 5 plants and 5 animals, and investigate the abiotic factors and adaptations that influence their distribution within the ecosystem.
This document discusses various methods for measuring biotic factors and biodiversity in ecosystems. It describes how species richness is simply the number of different species counted, while biodiversity combines both the number of species and their relative abundances. It provides Simpson's Biodiversity Index formula for calculating biodiversity. Population size can be estimated by throwing quadrats and scaling up based on total area. The Lincoln Index uses mark-recapture data to estimate animal population sizes. Other methods like measuring abundance, density, frequency, cover, and biomass are also discussed. The document considers potential issues with methods and ethical considerations.
This document discusses various methods for measuring biotic factors and biodiversity in ecosystems, including:
- Species richness, which counts the number of different species. Biodiversity combines species richness with the relative abundance of individuals of each species.
- Population size can be estimated by throwing quadrats and extrapolating from the counts. Simpson's Diversity Index provides a single number measurement of biodiversity.
- Other metrics like abundance, density, frequency, and biomass provide additional information about populations and communities.
- For mobile species, mark-recapture methods like the Lincoln Index can estimate population size over time.
- Alternative approaches include chemical fogging to sample canopy insects, though ethics must be
This document provides definitions and methods for investigating populations in biology. It defines key terms like ecosystem, population, community and habitat. It describes how to use quadrats and transects to sample populations through random and systematic sampling. Methods covered include measuring abundance through frequency and percentage cover, and using mark-release-recapture to determine population size. Population growth curves and factors influencing population sizes like temperature, light, pH, water and humidity are also summarized.
Population ecology examines populations as units of study. A population has characteristics like density, size, age structure, and dispersion. The four basic population parameters that affect density are natality, mortality, immigration, and emigration. Techniques to estimate population density include using quadrats, capture-recapture methods, and calculating relative density with tools like traps or roadside counts. Life tables can describe mortality schedules by tracking age-specific cohort survival. Population growth rates depend on birth and death rates, and can be modeled exponentially or logistically depending on environmental constraints.
This document provides an introduction to vegetation sampling. It discusses key concepts like sampling, statistical and biological populations, statistical and physical samples. It also covers the purposes and importance of sampling, as well as different types of sampling designs including random, systematic, cluster and stratified sampling. The document concludes by outlining some advantages and disadvantages of these different sampling methods.
This document discusses methods of sampling vegetation. There are four main methods: transect, bisect, trisect, and quadrat. The transect method involves recording plant species along a line or belt and can show how plant communities change over a gradient. The bisect method examines the vertical layers of a plant community. The trisect method photographs a plot over time. The quadrat method uses rectangular or circular plots to measure plant coverage and abundance. The appropriate sampling method depends on the population, resources, and need for precision.
This document summarizes a study that used plot sampling and transect sampling methods to analyze a grassland ecosystem. Quadrat and transect line techniques were used to determine species density, cover estimates, and a species-area curve. Results showed that more species were found as area examined increased, up to a point. Species A dominated all cover estimation methods and had the highest density, dominance, and importance value, indicating it was the keystone species. The diversity index value implied the species in the grassland were diverse. Plot and transect sampling methods provided data about this grassland community.
This document summarizes a scientific paper that studied methods of vegetation analysis in a grassland ecosystem using plot and transect sampling techniques. The study found that as the sampled area increases, the number of plant species also increases, following a species-area curve. One species, Species A, was found to dominate the area based on higher values for density, dominance, and frequency compared to other species. The diversity of species in the area was calculated to be moderately diverse using Simpson's and Shannon-Wiener indices. The study demonstrated how plot and transect sampling can be used to analyze factors like species richness, cover estimation, zonation, and density in a grassland ecosystem.
This document provides an overview of key concepts for estimating population density and frequency. It defines populations and gives examples. It also discusses population density, growth, and factors that influence changes. Exponential growth and environmental resistance are explained. Methods for estimating populations include census, capture-mark-recapture techniques using traps, and quadrat sampling for plants. Calculations like Lincoln Index can estimate total populations from captured and recaptured samples. Density, frequency, and cover are defined for quantifying plant populations within quadrats. Autecology is the study of individual species populations and environments.
Population ecology studies the structure and dynamics of populations. Factors like birth rate, death rate, and immigration affect population density. Direct counting of populations is impractical, so sampling techniques like quadrat sampling and capture-mark-recapture are used instead. Quadrat sampling involves using frames to estimate plant and immobile animal population frequencies, densities, and percentages. Capture-mark-recapture involves capturing, marking, releasing, then recapturing animals to estimate total population size using a specific formula. Abiotic factors like temperature and light influence where organisms can live.
This document defines key terms related to ecology, including abiotic and biotic factors, producers, consumers, decomposers, niches, food webs, succession, sampling methods, and population estimation techniques. It discusses various abiotic factors like temperature, light availability, and water that influence organisms. Biotic factors include predation, competition, and disease. Sampling methods are described for estimating populations and community characteristics, including quadrat sampling, transects, and capture-mark-recapture for animals.
Population ecology is the study of populations in relation to their environment. Key concepts include population size, density, growth rates, and limiting factors. Population growth can be exponential in unlimited environments but becomes logistic as resources are depleted. The logistic model describes sigmoid growth with a carrying capacity K, where population growth rate is highest at N=K/2. Natality, mortality, immigration, and emigration influence population size. Estimating population density can involve direct counts, sampling methods like quadrats, or capture-recapture of marked individuals.
it describes the bony anatomy including the femoral head , acetabulum, labrum . also discusses the capsule , ligaments . muscle that act on the hip joint and the range of motion are outlined. factors affecting hip joint stability and weight transmission through the joint are summarized.
How to Add Chatter in the odoo 17 ERP ModuleCeline George
In Odoo, the chatter is like a chat tool that helps you work together on records. You can leave notes and track things, making it easier to talk with your team and partners. Inside chatter, all communication history, activity, and changes will be displayed.
This presentation was provided by Steph Pollock of The American Psychological Association’s Journals Program, and Damita Snow, of The American Society of Civil Engineers (ASCE), for the initial session of NISO's 2024 Training Series "DEIA in the Scholarly Landscape." Session One: 'Setting Expectations: a DEIA Primer,' was held June 6, 2024.
How to Fix the Import Error in the Odoo 17Celine George
An import error occurs when a program fails to import a module or library, disrupting its execution. In languages like Python, this issue arises when the specified module cannot be found or accessed, hindering the program's functionality. Resolving import errors is crucial for maintaining smooth software operation and uninterrupted development processes.
A workshop hosted by the South African Journal of Science aimed at postgraduate students and early career researchers with little or no experience in writing and publishing journal articles.
Strategies for Effective Upskilling is a presentation by Chinwendu Peace in a Your Skill Boost Masterclass organisation by the Excellence Foundation for South Sudan on 08th and 09th June 2024 from 1 PM to 3 PM on each day.
How to Manage Your Lost Opportunities in Odoo 17 CRMCeline George
Odoo 17 CRM allows us to track why we lose sales opportunities with "Lost Reasons." This helps analyze our sales process and identify areas for improvement. Here's how to configure lost reasons in Odoo 17 CRM
This document provides an overview of wound healing, its functions, stages, mechanisms, factors affecting it, and complications.
A wound is a break in the integrity of the skin or tissues, which may be associated with disruption of the structure and function.
Healing is the body’s response to injury in an attempt to restore normal structure and functions.
Healing can occur in two ways: Regeneration and Repair
There are 4 phases of wound healing: hemostasis, inflammation, proliferation, and remodeling. This document also describes the mechanism of wound healing. Factors that affect healing include infection, uncontrolled diabetes, poor nutrition, age, anemia, the presence of foreign bodies, etc.
Complications of wound healing like infection, hyperpigmentation of scar, contractures, and keloid formation.
Walmart Business+ and Spark Good for Nonprofits.pdfTechSoup
"Learn about all the ways Walmart supports nonprofit organizations.
You will hear from Liz Willett, the Head of Nonprofits, and hear about what Walmart is doing to help nonprofits, including Walmart Business and Spark Good. Walmart Business+ is a new offer for nonprofits that offers discounts and also streamlines nonprofits order and expense tracking, saving time and money.
The webinar may also give some examples on how nonprofits can best leverage Walmart Business+.
The event will cover the following::
Walmart Business + (https://business.walmart.com/plus) is a new shopping experience for nonprofits, schools, and local business customers that connects an exclusive online shopping experience to stores. Benefits include free delivery and shipping, a 'Spend Analytics” feature, special discounts, deals and tax-exempt shopping.
Special TechSoup offer for a free 180 days membership, and up to $150 in discounts on eligible orders.
Spark Good (walmart.com/sparkgood) is a charitable platform that enables nonprofits to receive donations directly from customers and associates.
Answers about how you can do more with Walmart!"
4. Population Ecology
Population—
A group of individuals of the same species
living in a particular geographic area
Population Ecology—
Concentrates mainly on the factors that
affect how many individuals of a particular
species live in an area
4
5. What is a sample?
“A portion, piece, or segment that is
representative of a whole”
5
6. Why do we sample?
Because it is usually impossible to
count all the plants or animals present
in a given area
– e.g. # dragonfly larvae in a pond
– e.g. plant cover on a river terrace
– e.g. species of plants in the estate
6
7. NON-INVASIVE SAMPLING
Avoid any degradation of the habitat when
sampling
Removal of whole or parts of organisms
should be limited to species that can quickly
recover
7
8. REPRESENTATIVE
SAMPLING
Take a number of samples from around the
sampling site so as to be reasonably sure
that the samples represent the site in general
Necessities…
the samples represent the whole
– It is necessary to take enough samples so
that an accurate representation is obtained
– It is necessary to avoid bias when sampling
8
9. SAMPLING UNITS
Type determined by the organisms and the
physical nature of the habitat being sampled
– Area of ground surface
– Volume of air, water or soil
Standard units enable comparison of results
9
10. QUADRATS
A standard, area sampling unit consisting of a square frame
Consistent size and shape is essential for comparing samples
from different places and/or times
Quadrat size
Chosen to suit sampling goals
A balance between what is best and what is practical is always
necessary
Should suit:
– practical constraints
– habitat
– organism
10
11. Quadrat Method
A Quadrat is a sampling area of any shape
randomly deployed. Each individual within
the quadrat is counted and those numbers
are used to extrapolate population size.
Example: a 100 square centimeter metal
rectangle is randomly thrown four times and all
of the beetles of a particular species within the
square are counted each time: 19, 21, 17, and
19. This translates to 19 beetles per 100 cm2
or 1900 per m2.
11
12. QUADRAT & TRANSECT
ACTIVITIES
How, Where & Why Scientists Do Sampling
Scientists often collect data “in the field” which could
mean underwater, in a forest, in a cave, on a reef, or
even the moon! Two essential methods to gather
ecological information in a standardized way are:
Transect Sampling (using a single line) and
Quadrat
Sampling (counted within a grid). These sampling
methods provide more accurate data than random
sampling or simply guessing, but they take less time
than counting every specimen in a certain area.
12
13. Quadrats
- a sturdily built
wooden frame,
can be folded for
easy transport and
storage
13
14. Using a quadrat along
a belt transect
Quadrats
- When placed on the ground, the species
present within the frame are identified and
their abundance recorded
- Sampling could be random or systematic
14
15. Practical Constraints
Small quadrats are quicker to survey but yield a
smaller individual sample of habitat
– Often require a larger # of samples to
represent the habitat
Large quadrats require more time and effort
to survey but provide a larger individual
sample of habitat
– Often require a smaller # of samples to
represent the habitat
15
16. Habitat size
Appropriate sample unit size depends on size scale of
the habitat
– Small scale habitats require smaller sized samples
Ex. Boulders
– Large scale habitats require larger sized samples
Ex. Forests
16
17. Organism size and density
Depends on size and density of organisms
– Small, dense organisms require smaller
samples
Ex. grass
– Large, scattered organisms require larger
samples
Ex. Trees
17
19. SYSTEMATIC SAMPLING
Often used when the area being studied is
varied, not very large, or
when time is available
Samples are taken at fixed intervals
19
20. How to sample systematically
Systematic samples are usually taken along a transect
line marked by a tape measure
Transect- a line laid across an area
20
21. Sampling along gradients
Transects are set
up along a
environmental
gradients
– down a hillside
– across a streambed
– out from a source of
pollution
21
23. Line transect method
A measured line is laid
across the area in the
direction of the
environmental gradient
– The species touching the
line can be recorded
along the whole length of
the line (continuous
sampling) or at specific
points along the line
(systematic sampling)
23
24. Line Transect
- useful where a transition of flora and/or fauna
occurs
- a string or tape is stretched out along the
ground in a straight line;
record the organisms touching or covering
the line all along its length or at regular
intervals
- Profile transect: when there is appreciable
height change along the transect and thus
affecting the distribution of its species
24
25. Belt transect method
Similar to line transect but
widens the sampling area
– Transect line is laid out
– Samples are taken by
determining abundance or %
cover in an area that is a
defined distance from the line
– Samples can be taken all the
way along the line, at specific
intervals or even randomly
25
26. Using a quadrat
along a belt transect,
e.g. ladder transect
(every 5m)
Belt Transect
It is a strip, usually a metre wide, marked by putting a
second line parallel to the other. The species
between the lines are carefully recorded, working a
metre at a time.
Alternatively, a frame quadrat in conjunction with a
single line transect could be used. 26
28. STRATIFIED SAMPLING
Often used when
there are small
areas within a
larger habitat that
are clearly different
Strata- major
differences within
communities
recognized before
sampling begins
28
29. RANDOM SAMPLING
Often used when the area being studied is
fairly uniform, very large, or when there is a
limited amount of time available
Random = chosen by chance rather than
according to a plan; all outcomes are equally
likely
Samples are taken from different positions
within a habitat and those positions are
chosen randomly
29
30. How to sample randomly
Choose individuals or Place
“sampling units” haphazardly
– This is rarely completely
random
OR…
Assign numbers to the
areas
or individuals to be sampled
– Use a random number
table to
select which areas or
individuals
will be sample
30
31. Population Attributes
Density – size of a population in relation to a definite unit of
space
Affected by:
Natality – the reproductive output (birth rate) of
a population
Mortality – the death rate of organisms in a
population
Immigration – number of organisms moving
into the area occupied by the population
Emigration – number of organisms moving out
of the area occupied by the population
31
33. Two Types of Density
Estimates
• Absolute Density – a known density
such as #/m2
• Relative Density – we know when one
area has more individuals than
another
33
34. Measuring Absolute Density
Total Count – count the number of
organisms living in an area
Human census, number of oak trees in a
wooded lot, number of singing birds in an area
Total counts generally are not used very often
Sampling Methods – use a sample to
estimate population size
Either use the quadrat or capture-recapture
method
34
35. Measurement of Environmental Parameters
Abiotic factors are important in determining
both the distribution of the organisms and
their physical and physiological adaptations.
Temperature
- diurnal and seasonal temperature variations
are significant in affecting different species of
plants and animals
- equipment: mercury thermometer,
maximum-minimum thermometer,
miniaturized thermistor
35
36. pH meter in use
pH
-measure pH of a solution by universal
indicator, pH paper, pH meter, etc.
Light
-measure its duration and intensity; duration
by predication from Royal Observatory;
intensity by photographic light meter
36
37. Humidity
Relative humidity: the water content of a
given volume of air relative to the same
volume of fully saturated air
- equipment: whirling hygrometer
37
38. Wind and Water Speed
- wind speed:
- anemometer or wind
gauges
- water speed:
- time the movement of a
floating object over a
measured distance
38
39. Salinity
- using a conductivity meter: greater salinity has
greater conductivity
Oxygen Level
- using an oxygen meter or chemical method
(Winkler method)
39
40. Collecting Methods
Collecting all organisms within a habitat is normally
impractical and therefore small areas are selected.
Remember to return all material to its original position
after searching & collecting sufficient specimens.
Some collecting apparatus for general use are listed
below:
40
43. Estimating Population Size
The exact methods used for
estimation depend not only the
nature of the habitat but also on
the organisms involved,
e.g. animals - population ;
plants - percentage cover
43
44. Using Quadrats
- By sampling an area using quadrats and
counting the number of individuals within
each quadrat, it is possible to estimate the
total number of individuals within the area
- confined to plants and sessile, or very slow-
moving animals;
- fast-moving animals are disturbed and run
away
44
45. Capture-recapture Techniques
- useful for mobile animals which can be marked
- capture, marked, released, randomly recaptured
and marked individuals recorded
no. of marked individuals recaptured total no. of individuals in 1st sample
-------------------------------------------- = ------------------------------------------
total no. of individuals in 2nd sample estimated size of population
(the Lincoln Index)
45
46. Capture-recapture Techniques
Factors affecting the accuracy of the estimation:
deaths, migration, individuals become more liable to
predation, etc.
Examples:
- arthropods marked on their backs with non-
toxic paint,
- fish have tags attached to opercula,
- mammals have tags clipped to their ears,
birds have their legs ringed
46
47. Capture-recapture Method
Important tool for estimating density, birth
rate, and death rate for mobile animals.
Method:
Collect a sample of individuals, mark them,
and then release them
After a period, collect more individuals from the
wild and count the number that have marks
We assume that a sample, if random, will
contain the same proportion of marked
individuals as the population does
Estimate population density
47
48. Assumptions For All Capture-
Recapture Studies
Marking technique does not increase
mortality of marked animals
Marked individuals are allowed to mix with
population
Marking technique does not affect catch
probability
Marks are not lost or overlooked
No significant immigration or emigration
No significant mortality or natality
48
49. Peterson Method or Lincoln Index
Marked animals in Marked animals in
second sample first sample
=
Total caught in Total population
second sample size
5 = 16 N = (20)(16) N = 64
20 N 5
49
50. Some Indices Used
Traps Number of Artifacts
Number of Fecal Questionnaires
Pellets Cover
Vocalization Frequency Feeding Capacity
Pelt Records Roadside Counts
Catch per Unit Fishing
Effort
50
51. Abundance Scales
The population size may be fairly accurately determined by
making some form of frequency assessment.
These are subjective and involve an experimenter making some
estimate of the number of individuals in a given area, or the
% cover of a particular species.
This is especially useful where individuals are very numerous,
e.g. barnacles on a rocky shore, or where it is difficult to
distinguish individuals, e.g. grass plants in a meadow.
51
52. The assessments are usually made on an
abundance scale of 5 categories:
Abundance,
Common,
Frequent,
Occasional,
Rare.
Barnacles exposed at
low water
52
53. Environmental resistance are the factors
which limit the growth of a particular
population,
e.g. predation,
disease,
availability of light, food,
water,
oxygen and shelter,
the accumulation of toxic wastes and
even the size of the population itself.
53
54. Density-dependent Growth
A population is a density-dependent when its size
(or density) affects its growth rate because of
density-dependent factors such as food availability
and toxic waste accumulation.
Density-independent Growth
In this type of growth a population increases until
some factor causes a sudden reduction in its size.
Its effect is the same regardless of the size of the
population, e.g. temperature, fires, floods, storms,
etc.
54
55. Regulation of Population Size
Fecundity is the reproductive capacity of individual
females of a species.
Birth rate or natality is used to measure fecundity.
Death rate or mortality is the number of individuals
of a species which die per unit time.
Immigration occurs when individuals join a
population from neighbouring ones.
Emigration occurs when individuals depart from a
population.
A cycle occurs when the size of a population
fluctuates on a regular basis
55
57. Why Do We Sample?
Determine presence and/or abundance
Monitor population fluctuations
Assess ‘ecological damage’
Assess quality of habitat
Assess population responses
57
58. What Do We Sample?
Physical Environment
Temperature, DO, pH, salinity, clarity, flow,
sediment
Biotic Environment
All living things
58
59. Physical Habitat
Temperature
Mercury thermometer
Electronic thermometer
Long-term thermometers
Dissolved Oxygen
Winkler method (titration)
DO meter (electrode)
pH
Litmus paper
pH meter (electrode)
Salinity
Salinity Meter YSI 550A DO Meter w/12' cable
59
60. Water Clarity
Secchi Disk
Disk is attached to a calibrated rope. The disk
is lowered into the water until the white parts
can no longer be seen. Secchi disk depth is
then recorded and serves as the waters
transparency index. The clearer the water, the
greater the secchi disk depth.
Secchi Disk 60
61. Current Velocity (flow)
Floating-orange method.
Put an orange (or something else that floats
just below the water surface) and measure the
time it takes it to float across a known distance.
Odometer-type flow meter
Number of revolutions the propeller makes for
a given time is calibrated to flow velocity.
61
62. Sediment
Sediment size is important to many
aquatic organisms.
Sieve’s are used to separate and grade
sediment samples.
Percent of each size grade can be determined
62
63. Water Sample
Water and plankton from various depths
can be collected.
A trigger mechanism is used to close the
sampler.
Sample is then brought back to the surface
63
64. Small Mammals
Mouse/rat Traps
Fatal
Pit Falls
Bucket is placed in the ground
Sometimes have ‘leads’ to the buckets
Live traps
Havahart
Sherman
Spot-light
Havahart trap Sherman trap
64
65. Birds
Stick-under-the-box method
Bird-trap
Works like a minnow trap
Mist net
Captures birds in flight
Rocket net
Uses a propellant to throw a net
over birds
65
66. Terrestrial Insects
Sticky paper
flies
Baited Traps
Fire ants
Nets
butterflies
Foggers
Collect insects from tree canopies
66
67. Aquatic Insects
Drift Net
Place net in flowing water
Kick Net
‘Kick’ sediment upstream
from block net and the flow
will wash them into the net
Wash bucket
Serber or Hess Sampler
Stir up known area of
sediment
Animals are collected by a
catch net
Multi-plate Sampler
Become colonized
67
69. Fish Larvae
Light Traps
Larvae are attracted to the light
Ichthyoplankton nets
Can be towed at various depths
Fish collect at the ‘cod’end
69
70. Fish
Lift net
Net is placed down, and after
a set amount of time it is
quickly lifted
Pop-net Pop-net
Similar to a lift net, but floats
are attached to a framed net. Lift net
Operated by a trigger
mechanism
Throw net
A net attached to a heavy
frame is thrown and every
thing inside is netted out Throw net
70
71. Minnow trap
Usually use bait to attract small fish
Light is used sometimes as an attractant
71
72. Fish
Electrofishing
Electricity is put into the water
Fish are temporarily stunned and usually swim
towards the electricity source
Usually non-fatal but may cause some damage
72
73. Fish
Gill Net
Gill nets resemble tennis nets
Fish can not swim completely through the net
and get caught
Gill nets are size selective (based on mesh size)
Square Mesh
Stretch mesh
Bar mesh
73
74. Fish
Trammel Net
Three panels: two large
mesh on the outside
and a small mesh on
the inside
Fish swim through the
outer mesh, pushes the
small mesh through the
other side and
becomes entangled
74
75. Hoop nets (and other
similar nets) can have
bait or not.
Fyke nets have leads
to help guide fish to
the net.
75
77. Purse Seine
Used to encircle entire schools of fish
Usually involves a spotter plane and a second
boat
77
78. Trotline (longline)
A series of baited drop lines connected to
a main line.
Can be deployed by tying
one end to the bank and
tying the other end with a
heavy weight.
78
79. Shrimp (or fish) Trawl
Net pulled behind a
boat along the
bottom
Either a beam or otter
boards keep the net
open
79
80. Tagging Individuals
Coded Wire Tags
Microwire that has a unique
label
Magnetic wand detects the tag
Tag retention should be
determined
T-Bar tags
Can be individually numbered
External tag
PIT tags (Passive
Integrated Transponders)
Wand induces the tag to
transmit, individual number is
displayed
80
81. Other Tagging Methods
Toe clip
Amphibian and reptile
Clip of one or more toes to
identify individuals
Bird Band
Place a metal band on a
bird leg
Generally has
identification information
81
82. Preserving plant specimens
Pressing and drying
Long-term preservation
and storage
Alternative drying
techniques
Special preservation
and processing
techniques
Mounting
82
83. Pressing and drying
Techniques for pressing and drying specimens have been
established for many years. There are minor variations in
recommended methods, but they are essentially the same
worldwide.
The best specimens are plants that are pressed as soon as
possible after collection, before wilting and shrivelling. Most
plants may be kept in sealed containers such as plastic bags for
up to a day if it is inconvenient to press immediately. However,
some plants show such rapid wilting, particularly of the flowers,
that such delays are best avoided. Flowers with a lot of nectar
may go mouldy very quickly if excess nectar is not shaken off
before pressing.
Specimens are pressed flat and dried between sheets of
absorbent blotters or semi-absorbent paper such as newspaper.
Papers with a glossy surface should be avoided because they
are not absorbent enough to aid drying. The plant should be
carefully laid out between the drying sheets, as their form at this
stage largely determines their ultimate appearance. The flowers
should be spread out with the petals carefully arranged, wilted
leaves should be straightened and unnecessary shoots of
excessively twiggy shrubs may be cut away.
83
84. Microwave ovens
Small numbers of specimens can be dried using a microwave oven. The
technique recommended in the literature is to place the specimens
between unprinted absorbent paper, for example butcher's paper, not
newspaper, which is unsuitable because the chemicals present in the
ink may cause a fire. The specimens should be put in a special press
which should be of a microwave-safe material (wood, acrylic or
polycarbonate sheeting e.g. plexiglass or perspex, NO metal
components). If such a press is not available, sheets of cardboard can
be placed above and below the specimens and then weighted down.
Drying time depends on the power of your oven. In most cases drying is
accomplished by irradiating at maximum power for 1-2 minutes per
specimen, although it is often a case of trial and error. It is best to
process no more than 10-12 specimens of average thickness per batch.
Specimens are usually dried after the moisture that characteristically
appears on the glass door has disappeared. If the specimen is damp
when taken out of the oven, allow it to stand before re-radiating as
moisture continues to evaporate from the specimen for some time. Care
must be taken not to irradiate the specimens for too long.
It should be noted that microwave treatment damages seeds and the
cellular structure of the plants which may reduce the long-term value of
the specimens.
84
85. Alternative drying techniques
Silica gel/other desiccants & freeze drying
Alternative methods of drying plant specimens have been used
for some time, but are mostly restricted to special purpose
collections. The main alternatives are freeze-drying and drying in
a desiccant powder such as desiccant silica gel. In general these
techniques are used where it is essential to preserve the shape
of a delicate plant of organ of the plant such as the flower.
Freeze-drying has also been used to preserve the chemical
composition of a plant as accurately as possible for later study.
Disadvantages and special conservation problems of specimens
dried in these manners are that they are particularly susceptible
to damage. The dried parts are fragile, lack support and often
catch on packing materials. They must, therefore, be packed
especially carefully and stored in small boxes or tubes with some
appropriate packing material that does not snag and break small
projections. Acid-free tissue paper is often used. Drying in
desiccant silica gel crystals or powder can also have the
disadvantage that it is difficult to remove all traces of the silica
gel after drying.
85
86. Special preservation and processing
techniques
Wet or spirit collections
Very fleshy or delicate structures, including small
algae and orchid flowers, are best preserved in an
air-tight glass or plastic jar with a liquid preservative
rather than by drying. The type of preservative used
should be clearly labelled in the jar. Such material is
often referred to as a spirit collection or wet
collection.
Most material can be satisfactorily preserved in 70%
ethyl alcohol (or 70% methylated spirit or denatured
alcohol) with 30% water. Colours will fade quickly in
spirit, however, so it is a good idea to keep
comprehensive notes and photographs.
86
87. Small algae
Microscopic algae are often collected in a jar and in the water in
which they were found. If the algae are to be stored for more
than 2-3 days, a preservative needs to be used. Traditionally this
has been the extremely toxic formalin - a small amount can be
added to the water to make a 5% final solution, and the container
labelled. This must not be sent through the post or by courier.
There are some other equally toxic options, for example
propylene phenoxytol, but none should be sent through the post.
A safer option is to add sufficient concentrated alcohol or
methylated spirits to the water containing the algae to make a
final solution of 70% alcohol. This treatment dilutes the algae
making them difficult to find, so if they can be concentrated
somehow first (e.g. by filtering) they can be stored in much less
liquid. Another option is to fix the algae in formalin (or something
similar) first, and then prepare a microscope glass slide with a
permanent water-soluble mounting medium.
87
88. Mounting
Mounting specimens prevents most fragile material from
fragmenting and prevents specimens becoming separated from
their labels. If the plant collection is a long-term project,
specimens should be mounted on sheets of archival (permanent)
cardboard or paper with archival-quality fixing media. These
include stitching with cotton thread, dental floss, nickel-plated
copper wire (for heavier specimens), narrow strips of archival
paper, linen tape, or by using an archival adhesive such as
methyl cellulose adhesive
One disadvantage of mounting specimens is that it can make
parts of the specimen inaccessible for examination, so it is
essential that this be borne in mind during specimen
arrangement and mounting. For example, easily reversible
mounting media should be used, specimens should be strapped
to the sheet, rather than glued all over, and the specimen should
be carefully arranged before it is attached so that it shows all
features.
88
89. Full-size herbarium mounting sheets are
usually about 43 cm long x 28 cm wide. The
plant name and accompanying field notes
should be transcribed on a permanent label
stuck to one corner of the herbarium sheet
(the bottom right-hand corner being the most
common) or, sometimes, annotations may be
written directly on the sheet or card.
Small pieces of material which may have
become separated from the specimen (e.g.
seeds) can be placed in small plastic bags
and pinned to the sheet.
89
90. Long-term preservation and
storage
The long-term preservation of dry plant
specimens is largely dependent on protection
from insect attack. Specimens collected by
Linnaeus in the eighteenth century, and by
Banks and Solander on the Endeavour voyage
in 1788, are still excellently preserved.
90
91. Pests and their control
A range of pests attack dried plant material. The
most common pests are insects and fungi, though
rodents and other large animals can cause damage
in poor storage conditions. Insects eat the material,
the paper surrounding the material, and the
adhesives and mounting media.
Such insect pests range from psocids (book lice),
which attack mainly the softer parts such as flowers
and soft fruits, to tobacco beetles and carpet
beetles, which can bore holes through the toughest
of specimens. Many insects are particularly
sensitive to relative humidity levels and do not thrive
at levels below 50%.
91
92. The most common and acceptable specimen
treatments for insect control are:
Freezing
Microwave
Poisoning
Insect deterrents
Fungal pests
92
93. Storage
Dried and pressed plant specimens can be
stored in cardboard or plastic boxes, or tied in
bundles in light-weight cardboard folders
placed in 'pigeon holes'.
Alternatively, they can be placed in protective
plastic jackets and displayed in ring folders
which is recommended if they are to be
frequently handled, such as for a reference
collection.
93
94. Filing
Specimens should be filed in a systematic order if a
relatively permanent collection is being made. The
major groups, i.e. ferns and fern allies, cycads,
conifers, dicotyledons and monocotyledons, are
best kept separately or according to some
classification scheme, such as that given in a flora
or handbook.
Similarly, the genera within each family and the
species within each genus may be filed
alphabetically or following some such classification.
94
95. Preservation of entire animals
Types of collection specimens of an entire animal:
For reference collections, mammals can be prepared as a variety of
specimens. The condition of the specimen may determine possible
ways to preserve it; if for instance decomposition of the skin has
loosened the hair of a carcass so much that it can easily be pulled
out or removed by rubbing (“slipping” fur), it will be very difficult or
impossible to produce a study skin or mounted specimen.
The most usual types of specimens (based on Nagorsen and
Peterson, 1980) are:
1) entire fluid-preserved animals (for studying anatomy and
histology; fluid preservation may change the fur colour)
2) study skins with accompanying skulls / partial skeletons (some
bones remain in the skin), for studying pelage colour, hair quality
and moulting patterns,
3) mounted skins with accompanying partial or entire skeleton
(some bones may remain in the skin, dependant on the method of
preservation) or freeze-dried specimens,
4) entire skeletons, for instance for studying anatomy, geographic
variation or for age determination (entire skeletons are poorly
represented in collections, so Nagorsen and Peterson (1980)
recommend preparation of at least one male and one female
skeleton per species.
95
96. Preservation of specimens in the
field
Formalin preservation
Preservation in alcohol
Preservation by cooling or freezing
96
97. Formalin preservation
After weighing and measuring the animal and attaching an adequate
label very small specimens (up to 100 g) can be fixed whole by
submerging them in 10 % buffered formalin (tissue - formalin
solution ratio of at least 1 : 12). the body cavity can be filled with
formalin solution by injection until it is turgid and firm; some formalin
may also be injected under the skin, into the body cavity, larger
muscles and organs. If hypodermic needles are not available, the
body cavity can be opened ventrally by making a slit instead,
allowing the formalin to enter.
Keeping the mouth open with a piece of wood or cotton may later
allow examination of teeth. Then the whole body can be immersed
in formalin, in the posture in which it is supposed to stay
permanently because it will harden. The ratio of formalin to carcass
must be at least 12 to 1 to assure a good fixation. Tissues can be
left in buffered neutralized formalin for several months, but formalin
hardens specimens; therefore, after fixation, longterm storage in
alcohol may be better. After preservation the carcass should
therefore be washed in water and transferred into ethanol for
permanent storage
Disadvantages; for instance it discolours the fur, after a longish
immersion, softens the bones and prevents further examination for
microbiology.
97
98. Preservation in alcohol
After weighing, a whole animal can be
preserved in a container of alcohol (70-90%).
Removal of the intestine prior to storage of
the animal in alcohol is recommended
98
99. Preservation by cooling or
freezing
Removal of the skin with insulating fur before
cooling or freezing may help to cool the
carcass down more quickly.
Freezing is not recommended if histological
examination is planned
99