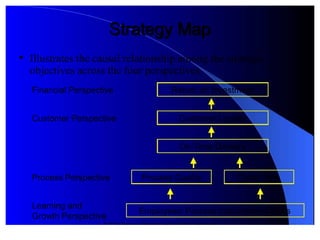
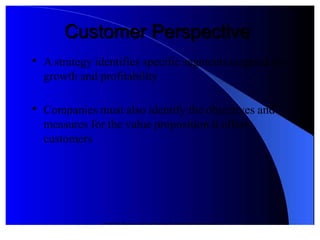
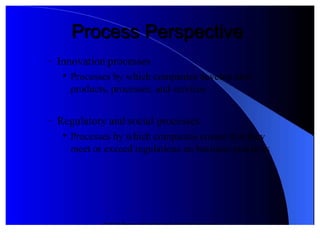
© 2012 Pearson Prentice© 2012 Pearson Prentice Hall. All rights reserved.Hall. All rights reserved.
The Balanced ScorecardThe Balanced ScorecardThe Balanced ScorecardThe Balanced Scorecard
and Strategy Mapand Strategy Mapand Strategy Mapand Strategy Map
Chapter 2Chapter 2
© 2012 Pearson Prentice© 2012 Pearson Prentice Hall. All rights reserved.Hall. All rights reserved.
Performance MeasrementPerformance MeasrementPerformance MeasrementPerformance Measrement
SystemsSystemsSystemsSystems

Measurement must supportMeasurement must support the company’s strategythe company’s strategy
and operationand operation

Must be designed so companies get better atMust be designed so companies get better at
managing and improving the value created frommanaging and improving the value created from
their intangible assetstheir intangible assets

 Need to move Need to move from reliance on ffrom reliance on financial measuresinancial measures
to a mix ofto a mix of financial and nonfinancial measuresfinancial and nonfinancial measures
© 2012 Pearson Prentice Hall. All rights reserved.
Balanced ScorecardBalanced Scorecard

The Balanced Scorecard (BSC provides a system
for measuring and managing all aspects of a
company’s performance

The scorecard balances traditional financial
measures of success! such as profits and return on
capital! "ith nonfinancial measures of the drivers
of future financial performance

The Balanced Scorecard measures organi#ational
 performance across different perspectives
© 2012 Pearson Prentice Hall. All rights reserved.
PerspectivesPerspectives

$our different but lin%ed perspectives are derived
from the organi#ation’s mission! vision and
strategy&
 '  $inancial
 '  Customer 
 '  rocess
 '  )earning and gro"th
© 2012 Pearson Prentice Hall. All rights reserved.
Balanced MeasrementsBalanced Measrements

The BSC enables companies to&
 '  Trac% financial results
 '  Monitor ho" they are building the capabilities for
future gro"th and profitability

*ith customers

*ith their internal processes

*ith their employees and systems
© 2012 Pearson Prentice Hall. All rights reserved.
StrategyStrategy

+ strategy accomplishes t"o principal functions&
 '  Creating a competitive advantage by positioning
the company in its external environment "ith
resources to support customers better than its
competitors
 '  ,aving a clear strategy provides clear guidance for
ho" internal resources should be allocated to gain
a competitive advantage in the mar%etplace
© 2012 Pearson Prentice Hall. All rights reserved.
!"#ectives!"#ectives

Concise statements that articulate "hat the
organi#ation hopes to accomplish

+ction phrases

Tell the story of the strategy through the cause-
and-effect relationships
© 2012 Pearson Prentice Hall. All rights reserved.
!"#ectives!"#ectives

Typical ob.ectives found in each of the four BSC
 perspectives include&
 '  /ncrease revenues through expanded sales to
existing customers ($inancial perspective
 '  0ffer complete solutions to our targeted customers
(Customer perspective
 '  +chieve excellence in order fulfillment through
continuous improvements (rocess perspective
 '  +lign employee incentives and re"ards "ith the
strategy ()earning and gro"th perspective
© 2012 Pearson Prentice Hall. All rights reserved.
MeasresMeasres

rovide specificity and reduce the ambiguity that
is inherent in "ord statements

Specifying exactly ho" an ob.ective is measured
"ill give employees a clear focus for their
improvement efforts

0nce the ob.ectives have been translated into
measures! managers select targets for each
measure
© 2012 Pearson Prentice Hall. All rights reserved.
TargetsTargets

Targets establish the level of performance or rate
of improvement re1uired for a measure
 '  Should be set to represent excellent performance
 '  Should! if achieved! place the company as one of
the best performers in its industry
 '  Should create distinctive value for customers and
shareholders
© 2012 Pearson Prentice Hall. All rights reserved.
Strategy MapStrategy Map

/llustrates the causal relationship among the strategic
ob.ectives across the four perspectives
$inancial Perspective %etrn on &nvestment
'stomer Perspective 'stomer (oyalty
!n)Time *elivery
Process Perspective
(earning and
+ro,th Perspective
Process -ality 'ycle Time
mployees/ Process &mprovement Sills
© 2012 Pearson Prentice Hall. All rights reserved.
$inancial Perspective$inancial Perspective

The ultimate ob.ective for profit-see%ing
companies

$inancial performance measures indicate "hether
the company’s strategy! implementation! and
execution are contributing to bottom-line
improvement

+ company’s financial performance can be
improved in t"o "ays& productivity improvements
and revenue gro"th
© 2012 Pearson Prentice Hall. All rights reserved.
$inancial Perspective$inancial Perspective

/ncreased productivity occurs by&
 '  )o"ering direct and indirect expenses
 '  tili#ing their financial and physical assets more
efficiently

Companies generate revenue gro"th by&
 '  Selling additional products or services to existing
customers
 '  Selling ne" products! selling to ne" customers!
and expanding into ne" mar%ets
© 2012 Pearson Prentice Hall. All rights reserved.
'stomer Perspective'stomer Perspective

/dentify the targeted customer segments in "hich
the business unit competes and the measures of the
 business unit’s performance in these targeted
segments

This perspective typically includes several
common measures of the successful outcomes
from a "ell-formulated and implemented strategy&
 '  +chieve customer satisfaction and loyalty
 '  +c1uire ne" customers
 '  /ncrease mar%et share
 '  3nhance customer profitability
© 2012 Pearson Prentice Hall. All rights reserved.
'stomer Perspective'stomer Perspective

+ strategy identifies specific segments targeted for
gro"th and profitability

Companies must also identify the ob.ectives and
measures for the value proposition it offers
customers
© 2012 Pearson Prentice Hall. All rights reserved.
'stomer Perspective'stomer Perspective

The value proposition is the uni1ue mix of product
 performance! price! 1uality! availability! ease of purchase!
service! relationship! and image offered to the targeted
customers
 '  4efines the company’s strategy
 '  Communicates "hat the company expects to do for its
customers better or differently from its competitors

5alue propositions used successfully by different
companies include&
 '  6Best buy7 or lo"est total cost
 '  roduct leadership
 '  Complete customer solutions
© 2012 Pearson Prentice Hall. All rights reserved.
Process PerspectiveProcess Perspective

Means by "hich the organi#ation "ill&
 '  Create and deliver the value proposition for
customers
 '  +chieve the productivity improvements for the
financial ob.ectives

The rocess perspective identifies the critical
 processes in "hich the organi#ation must excel to
achieve its customer! revenue gro"th! and
 profitability ob.ectives
© 2012 Pearson Prentice Hall. All rights reserved.
Process PerspectiveProcess Perspective

0rgani#ations perform many different processes!
"hich may be classified into four groupings&
 '  0perating processes

4ay-to-day processes by "hich companies produce
their existing products and services and deliver them
to customers
 '  Customer management processes

rocesses by "hich companies expand and deepen
relationships "ith targeted customers
© 2012 Pearson Prentice Hall. All rights reserved.
Process PerspectiveProcess Perspective
 '  /nnovation processes

rocesses by "hich companies develop ne"
 products! processes! and services
 '  8egulatory and social processes

rocesses by "hich companies ensure that they
meet or exceed regulations on business practices
© 2012 Pearson Prentice Hall. All rights reserved.
(earning and +ro,th(earning and +ro,th
PerspectivePerspective

/dentifies ob.ectives that drive improvement in the
 process ob.ectives
 '  ,uman 8esources
 '  /nformation Technology
 '  0rgani#ation Culture and +lignment
© 2012 Pearson Prentice Hall. All rights reserved.
(earning and +ro,th(earning and +ro,th
PerspectivePerspective

,uman 8esources
 '  Strategic competency availability

3mployees have the appropriate mix of s%ills! talent!
and %no"-ho"

/nformation Technology
 '  Strategic information availability

Systems and applications contribute to effective
strategy execution
© 2012 Pearson Prentice Hall. All rights reserved.
(earning and +ro,th(earning and +ro,th
PerspectivePerspective

0rgani#ation Culture and +lignment
 '  Culture and climate

3mployees have an a"areness and understanding of
the shared vision! strategy! and cultural values
 '  9oal +lignment

3mployee goals and incentives are aligned "ith the
strategy
 '  :no"ledge sharing

3mployees and teams share best practices and other
%no"ledge relevant to strategy execution
© 2012 Pearson Prentice Hall. All rights reserved.
BS' in onprofit andBS' in onprofit and
+overnment !rganiations+overnment !rganiations

The BSC is especially "ell-suited for nonprofit
and government organi#ations (N90s

Their success has to be measured by their
effectiveness in providing benefits to constituents

Because nonfinancial measures can assess
 performance "ith constituents! the BSC provides
the natural performance management system for
 N90s
© 2012 Pearson Prentice Hall. All rights reserved.
P+!s and StrategyP+!s and Strategy

Many N90s encountered difficulties in
developing their initial BSC! finding that they
didn’t have a clear strategy

Many N90s place their mission ob.ective at the
top of their scorecard and strategy map
 '  Cannot use the standard BSC architecture "here
financial ob.ectives are the ultimate! high-level
outcomes to be achieved
© 2012 Pearson Prentice Hall. All rights reserved.
Managing ,ith the BS'Managing ,ith the BS'

The benefits from BSC are reali#ed as the
organi#ation integrates its ne" measurement
system into management processes that&
 '  Communicate the strategy to all employees and
organi#ational units
 '  +lign employees’ individual ob.ectives and
incentives to successful strategy implementation
 '  /ntegrate the strategy "ith ongoing management
 processes
Barriers to ffective 3seBarriers to ffective 3se

Senior management is not committed

Scorecard responsibilities do not filter do"n

The solution is overdesigned! or the scorecard is a
one-time event

The scorecard is treated as a systems or consulting
 pro.ect
© 2012 Pearson Prentice Hall. All rights reserved.

Chapter 02 The Balanced Scorecard and Strategy Map

  • 1.
    © 2012 PearsonPrentice© 2012 Pearson Prentice Hall. All rights reserved.Hall. All rights reserved. The Balanced ScorecardThe Balanced ScorecardThe Balanced ScorecardThe Balanced Scorecard and Strategy Mapand Strategy Mapand Strategy Mapand Strategy Map Chapter 2Chapter 2
  • 2.
    © 2012 PearsonPrentice© 2012 Pearson Prentice Hall. All rights reserved.Hall. All rights reserved. Performance MeasrementPerformance MeasrementPerformance MeasrementPerformance Measrement SystemsSystemsSystemsSystems  Measurement must supportMeasurement must support the company’s strategythe company’s strategy and operationand operation  Must be designed so companies get better atMust be designed so companies get better at managing and improving the value created frommanaging and improving the value created from their intangible assetstheir intangible assets   Need to move Need to move from reliance on ffrom reliance on financial measuresinancial measures to a mix ofto a mix of financial and nonfinancial measuresfinancial and nonfinancial measures
  • 3.
    © 2012 PearsonPrentice Hall. All rights reserved. Balanced ScorecardBalanced Scorecard  The Balanced Scorecard (BSC provides a system for measuring and managing all aspects of a company’s performance  The scorecard balances traditional financial measures of success! such as profits and return on capital! "ith nonfinancial measures of the drivers of future financial performance  The Balanced Scorecard measures organi#ational  performance across different perspectives
  • 4.
    © 2012 PearsonPrentice Hall. All rights reserved. PerspectivesPerspectives  $our different but lin%ed perspectives are derived from the organi#ation’s mission! vision and strategy&  '  $inancial  '  Customer   '  rocess  '  )earning and gro"th
  • 5.
    © 2012 PearsonPrentice Hall. All rights reserved. Balanced MeasrementsBalanced Measrements  The BSC enables companies to&  '  Trac% financial results  '  Monitor ho" they are building the capabilities for future gro"th and profitability  *ith customers  *ith their internal processes  *ith their employees and systems
  • 6.
    © 2012 PearsonPrentice Hall. All rights reserved. StrategyStrategy  + strategy accomplishes t"o principal functions&  '  Creating a competitive advantage by positioning the company in its external environment "ith resources to support customers better than its competitors  '  ,aving a clear strategy provides clear guidance for ho" internal resources should be allocated to gain a competitive advantage in the mar%etplace
  • 7.
    © 2012 PearsonPrentice Hall. All rights reserved. !"#ectives!"#ectives  Concise statements that articulate "hat the organi#ation hopes to accomplish  +ction phrases  Tell the story of the strategy through the cause- and-effect relationships
  • 8.
    © 2012 PearsonPrentice Hall. All rights reserved. !"#ectives!"#ectives  Typical ob.ectives found in each of the four BSC  perspectives include&  '  /ncrease revenues through expanded sales to existing customers ($inancial perspective  '  0ffer complete solutions to our targeted customers (Customer perspective  '  +chieve excellence in order fulfillment through continuous improvements (rocess perspective  '  +lign employee incentives and re"ards "ith the strategy ()earning and gro"th perspective
  • 9.
    © 2012 PearsonPrentice Hall. All rights reserved. MeasresMeasres  rovide specificity and reduce the ambiguity that is inherent in "ord statements  Specifying exactly ho" an ob.ective is measured "ill give employees a clear focus for their improvement efforts  0nce the ob.ectives have been translated into measures! managers select targets for each measure
  • 10.
    © 2012 PearsonPrentice Hall. All rights reserved. TargetsTargets  Targets establish the level of performance or rate of improvement re1uired for a measure  '  Should be set to represent excellent performance  '  Should! if achieved! place the company as one of the best performers in its industry  '  Should create distinctive value for customers and shareholders
  • 11.
    © 2012 PearsonPrentice Hall. All rights reserved. Strategy MapStrategy Map  /llustrates the causal relationship among the strategic ob.ectives across the four perspectives $inancial Perspective %etrn on &nvestment 'stomer Perspective 'stomer (oyalty !n)Time *elivery Process Perspective (earning and +ro,th Perspective Process -ality 'ycle Time mployees/ Process &mprovement Sills
  • 12.
    © 2012 PearsonPrentice Hall. All rights reserved. $inancial Perspective$inancial Perspective  The ultimate ob.ective for profit-see%ing companies  $inancial performance measures indicate "hether the company’s strategy! implementation! and execution are contributing to bottom-line improvement  + company’s financial performance can be improved in t"o "ays& productivity improvements and revenue gro"th
  • 13.
    © 2012 PearsonPrentice Hall. All rights reserved. $inancial Perspective$inancial Perspective  /ncreased productivity occurs by&  '  )o"ering direct and indirect expenses  '  tili#ing their financial and physical assets more efficiently  Companies generate revenue gro"th by&  '  Selling additional products or services to existing customers  '  Selling ne" products! selling to ne" customers! and expanding into ne" mar%ets
  • 14.
    © 2012 PearsonPrentice Hall. All rights reserved. 'stomer Perspective'stomer Perspective  /dentify the targeted customer segments in "hich the business unit competes and the measures of the  business unit’s performance in these targeted segments  This perspective typically includes several common measures of the successful outcomes from a "ell-formulated and implemented strategy&  '  +chieve customer satisfaction and loyalty  '  +c1uire ne" customers  '  /ncrease mar%et share  '  3nhance customer profitability
  • 15.
    © 2012 PearsonPrentice Hall. All rights reserved. 'stomer Perspective'stomer Perspective  + strategy identifies specific segments targeted for gro"th and profitability  Companies must also identify the ob.ectives and measures for the value proposition it offers customers
  • 16.
    © 2012 PearsonPrentice Hall. All rights reserved. 'stomer Perspective'stomer Perspective  The value proposition is the uni1ue mix of product  performance! price! 1uality! availability! ease of purchase! service! relationship! and image offered to the targeted customers  '  4efines the company’s strategy  '  Communicates "hat the company expects to do for its customers better or differently from its competitors  5alue propositions used successfully by different companies include&  '  6Best buy7 or lo"est total cost  '  roduct leadership  '  Complete customer solutions
  • 17.
    © 2012 PearsonPrentice Hall. All rights reserved. Process PerspectiveProcess Perspective  Means by "hich the organi#ation "ill&  '  Create and deliver the value proposition for customers  '  +chieve the productivity improvements for the financial ob.ectives  The rocess perspective identifies the critical  processes in "hich the organi#ation must excel to achieve its customer! revenue gro"th! and  profitability ob.ectives
  • 18.
    © 2012 PearsonPrentice Hall. All rights reserved. Process PerspectiveProcess Perspective  0rgani#ations perform many different processes! "hich may be classified into four groupings&  '  0perating processes  4ay-to-day processes by "hich companies produce their existing products and services and deliver them to customers  '  Customer management processes  rocesses by "hich companies expand and deepen relationships "ith targeted customers
  • 19.
    © 2012 PearsonPrentice Hall. All rights reserved. Process PerspectiveProcess Perspective  '  /nnovation processes  rocesses by "hich companies develop ne"  products! processes! and services  '  8egulatory and social processes  rocesses by "hich companies ensure that they meet or exceed regulations on business practices
  • 20.
    © 2012 PearsonPrentice Hall. All rights reserved. (earning and +ro,th(earning and +ro,th PerspectivePerspective  /dentifies ob.ectives that drive improvement in the  process ob.ectives  '  ,uman 8esources  '  /nformation Technology  '  0rgani#ation Culture and +lignment
  • 21.
    © 2012 PearsonPrentice Hall. All rights reserved. (earning and +ro,th(earning and +ro,th PerspectivePerspective  ,uman 8esources  '  Strategic competency availability  3mployees have the appropriate mix of s%ills! talent! and %no"-ho"  /nformation Technology  '  Strategic information availability  Systems and applications contribute to effective strategy execution
  • 22.
    © 2012 PearsonPrentice Hall. All rights reserved. (earning and +ro,th(earning and +ro,th PerspectivePerspective  0rgani#ation Culture and +lignment  '  Culture and climate  3mployees have an a"areness and understanding of the shared vision! strategy! and cultural values  '  9oal +lignment  3mployee goals and incentives are aligned "ith the strategy  '  :no"ledge sharing  3mployees and teams share best practices and other %no"ledge relevant to strategy execution
  • 23.
    © 2012 PearsonPrentice Hall. All rights reserved. BS' in onprofit andBS' in onprofit and +overnment !rganiations+overnment !rganiations  The BSC is especially "ell-suited for nonprofit and government organi#ations (N90s  Their success has to be measured by their effectiveness in providing benefits to constituents  Because nonfinancial measures can assess  performance "ith constituents! the BSC provides the natural performance management system for  N90s
  • 24.
    © 2012 PearsonPrentice Hall. All rights reserved. P+!s and StrategyP+!s and Strategy  Many N90s encountered difficulties in developing their initial BSC! finding that they didn’t have a clear strategy  Many N90s place their mission ob.ective at the top of their scorecard and strategy map  '  Cannot use the standard BSC architecture "here financial ob.ectives are the ultimate! high-level outcomes to be achieved
  • 25.
    © 2012 PearsonPrentice Hall. All rights reserved. Managing ,ith the BS'Managing ,ith the BS'  The benefits from BSC are reali#ed as the organi#ation integrates its ne" measurement system into management processes that&  '  Communicate the strategy to all employees and organi#ational units  '  +lign employees’ individual ob.ectives and incentives to successful strategy implementation  '  /ntegrate the strategy "ith ongoing management  processes
  • 26.
    Barriers to ffective3seBarriers to ffective 3se  Senior management is not committed  Scorecard responsibilities do not filter do"n  The solution is overdesigned! or the scorecard is a one-time event  The scorecard is treated as a systems or consulting  pro.ect © 2012 Pearson Prentice Hall. All rights reserved.
  • 27.
    © 2012 PearsonPrentice Hall. All rights reserved.