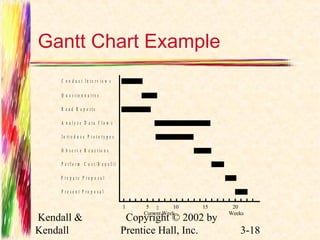
Chapter 3 
Determining Feasibility and 
Managing Analysis and 
Design Activities 
Systems Analysis and Design 
Kendall and Kendall 
Fifth Edition
Major Topics 
 Project initiation 
 Determining project feasibility 
 Project scheduling 
 Managing project activities 
 Manage systems analysis team 
members 
Kendall & 
Kendall 
Copyright © 2002 by 
Prentice Hall, Inc. 3-2
Project Initiation 
 Projects are initiated for two broad 
reasons: 
 Problems that lend themselves to systems 
solutions 
 Opportunities for improvement through 
 Upgrading systems 
 Altering systems 
 Installing new systems 
Kendall & 
Kendall 
Copyright © 2002 by 
Prentice Hall, Inc. 3-3
Organizational Problems 
 Identify problems by 
 Check output against performance criteria 
 Too many errors 
 Work completed slowly 
 Work done incorrectly 
 Work done incompletely 
 Work not done at all 
Kendall & 
Kendall 
Copyright © 2002 by 
Prentice Hall, Inc. 3-4
Organizational Problems 
 Observe behavior of employees 
 High absenteeism 
 High job dissatisfaction 
 High job turnover 
Kendall & 
Kendall 
Copyright © 2002 by 
Prentice Hall, Inc. 3-5
Organizational Problems 
 Listen to feedback from vendors, 
customers, and suppliers 
 Complaints 
 Suggestions for improvement 
 Loss of sales 
 Lower sales 
Kendall & 
Kendall 
Copyright © 2002 by 
Prentice Hall, Inc. 3-6
Project Selection 
 Five specific criteria for project selection 
 Backed by management 
 Timed appropriately for commitment of 
resources 
 It moves the business toward attainment of 
its goals 
 Practicable 
 Important enough to be considered over 
other projects 
Kendall & 
Kendall 
Copyright © 2002 by 
Prentice Hall, Inc. 3-7
Possibilities for Improvement 
 Many possible objectives exist including 
 Speeding up a process 
 Streamlining a process 
 Combining processes 
 Reducing errors in input 
 Reducing redundant storage 
 Reducing redundant output 
 Improving system and subsystem 
integration 
Kendall & 
Kendall 
Copyright © 2002 by 
Prentice Hall, Inc. 3-8
Feasibility Impact Grid (FIG) 
 A feasibility impact grid (FIG) is used to 
assess the impact of any improvements 
to the existing system 
 Can increase awareness of the impacts 
made on the achievement of corporate 
objectives 
Kendall & 
Kendall 
Copyright © 2002 by 
Prentice Hall, Inc. 3-9
Feasibility Impact Grid (FIG) 
 Current or proposed systems are listed 
on the left 
 Objectives are listed on the top 
 Red arrows indicate a positive impact 
 Green arrows indicate implementation 
Kendall & 
Kendall 
Copyright © 2002 by 
Prentice Hall, Inc. 3-10
Feasibility 
 A feasibility study assesses the 
operational, technical, and economic 
merits of the proposed project 
 There are three types of feasibility: 
 Technical feasibility 
 Economic feasibility 
 Operational feasibility 
Kendall & 
Kendall 
Copyright © 2002 by 
Prentice Hall, Inc. 3-11
Technical Feasibility 
 Technical feasibility assesses whether 
the current technical resources are 
sufficient for the new system 
 If they are not available, can they be 
upgraded to provide the level of 
technology necessary for the new 
system 
Kendall & 
Kendall 
Copyright © 2002 by 
Prentice Hall, Inc. 3-12
Economic Feasibility 
 Economic feasibility determines 
whether the time and money are 
available to develop the system 
 Includes the purchase of 
 New equipment 
 Hardware 
 Software 
Kendall & 
Kendall 
Copyright © 2002 by 
Prentice Hall, Inc. 3-13
Operational Feasibility 
 Operational feasibility determines if the 
human resources are available to 
operate the system once it has been 
installed 
 Users that do not want a new system 
may prevent it from becoming 
operationally feasible 
Kendall & 
Kendall 
Copyright © 2002 by 
Prentice Hall, Inc. 3-14
Activity Planning 
 Activity planning includes 
 Selecting a systems analysis team 
 Estimating time required to complete each 
task 
 Scheduling the project 
 Two tools for project planning and 
control are Gantt charts and PERT 
diagrams 
Kendall & 
Kendall 
Copyright © 2002 by 
Prentice Hall, Inc. 3-15
Estimating Time 
 Project is broken down into phases 
 Further broken down into tasks or 
activities 
 Finally broken down into steps or even 
smaller units 
 Estimate time for each task or activity 
 May use a most likely, pessimistic, and 
optimistic estimates for time 
Kendall & 
Kendall 
Copyright © 2002 by 
Prentice Hall, Inc. 3-16
Gantt Charts 
 Easy to construct and use 
 Shows activities over a period of time 
Kendall & 
Kendall 
Copyright © 2002 by 
Prentice Hall, Inc. 3-17
Gantt Chart Example 
C o n d u c t I n t e r v i e w s 
Kendall & 
Kendall 
 
Copyright © 2002 by 
Prentice Hall, Inc. 3-18 
Q u e s t i o n n a i r e s 
R e a d R e p o r t s 
A n a l y z e D a t a F l o w s 
I n t r o d u c e P r o t o t y p e s 
O b s e r v e R e a c t i o n s 
P e r f o r m C o s t / B e n e f i t 
P r e p a r e P r o p o s a l 
P r e s e n t P r o p o s a l 
1 5 10 15 20 
Current Week Weeks
PERT Diagram 
 PERT - Program Evaluation and 
Review Technique 
 PERT diagrams show precedence, 
activities that must be completed before 
the next activities may be started 
 Used to calculate the critical path, the 
longest path through the activities 
 This is the shortest time to complete the 
project 
Kendall & 
Kendall 
Copyright © 2002 by 
Prentice Hall, Inc. 3-19
PERT Diagram Example 
A C o n d u c t I n t e r v i e w s N o n e 3 
B Q u e s t i o n n a i r e s A 4 
C R e a d R e p o r t s N o n e 4 
D A n a l y z e D a t a F l o w s B , C 8 
E I n t r o d u c e P r o t o t y p e s B , C 5 
F O b s e r v e R e a c t i o n s E 3 
G P e r f o r m C o s t / B e n e f i t D 3 
H P r e p a r e P r o p o s a l G 2 
I P r e s e n t P r o p o s a l H 2 
Kendall & 
Kendall 
Copyright © 2002 by 
Prentice Hall, Inc. 3-20 
10 
20 
30 50 60 70 80 
40 
A, 3 B, 4 
C, 4 D, 8 G, 3 H, 2 I, 2 
E, 5 F, 3
PERT Diagram Advantages 
 Easy identification of the order of 
precedence 
 Easy identification of the critical path 
and thus critical activities 
 Easy determination of slack time, the 
leeway to fall behind on noncritical 
paths 
Kendall & 
Kendall 
Copyright © 2002 by 
Prentice Hall, Inc. 3-21
Timeboxing 
 Timeboxing sets an absolute due date 
for project delivery 
 The most critical features are developed 
first and implemented by the due date 
 Other features are added later 
Kendall & 
Kendall 
Copyright © 2002 by 
Prentice Hall, Inc. 3-22
Personal Information Manager 
Software 
 Personal information manager (PIM) 
software is useful for scheduling 
activities and includes features such as: 
 Telephone and fax number lists 
 To-do lists 
 Online calendars 
Kendall & 
Kendall 
Copyright © 2002 by 
Prentice Hall, Inc. 3-23
Team Management 
 Teams often have two leaders: 
 One who leads members to accomplish 
tasks 
 One concerned with social relationships 
 The systems analyst must manage 
 Team members 
 Their activities 
 Their time, and resources 
Kendall & 
Kendall 
Copyright © 2002 by 
Prentice Hall, Inc. 3-24
Goal Setting 
 Successful projects require that 
reasonable productivity goals for 
tangible outputs and process activities 
be set 
 Goal setting helps to motivate team 
members 
Kendall & 
Kendall 
Copyright © 2002 by 
Prentice Hall, Inc. 3-25
Ecommerce Project 
Management 
 Ecommerce and traditional software 
project management differences: 
 The data used by ecommerce systems is 
scattered across the organization 
 Ecommerce systems need a staff with a 
wide variety of skills 
 Partnerships must be built externally and 
internally well ahead of implementation 
 Security is of utmost importance 
Kendall & 
Kendall 
Copyright © 2002 by 
Prentice Hall, Inc. 3-26
Project Failures 
 Project failures may be prevented by 
 Training 
 Experience 
 Learning why other projects have failed 
Kendall & 
Kendall 
Copyright © 2002 by 
Prentice Hall, Inc. 3-27

Chap03

  • 1.
    Chapter 3 DeterminingFeasibility and Managing Analysis and Design Activities Systems Analysis and Design Kendall and Kendall Fifth Edition
  • 2.
    Major Topics Project initiation  Determining project feasibility  Project scheduling  Managing project activities  Manage systems analysis team members Kendall & Kendall Copyright © 2002 by Prentice Hall, Inc. 3-2
  • 3.
    Project Initiation Projects are initiated for two broad reasons:  Problems that lend themselves to systems solutions  Opportunities for improvement through  Upgrading systems  Altering systems  Installing new systems Kendall & Kendall Copyright © 2002 by Prentice Hall, Inc. 3-3
  • 4.
    Organizational Problems Identify problems by  Check output against performance criteria  Too many errors  Work completed slowly  Work done incorrectly  Work done incompletely  Work not done at all Kendall & Kendall Copyright © 2002 by Prentice Hall, Inc. 3-4
  • 5.
    Organizational Problems Observe behavior of employees  High absenteeism  High job dissatisfaction  High job turnover Kendall & Kendall Copyright © 2002 by Prentice Hall, Inc. 3-5
  • 6.
    Organizational Problems Listen to feedback from vendors, customers, and suppliers  Complaints  Suggestions for improvement  Loss of sales  Lower sales Kendall & Kendall Copyright © 2002 by Prentice Hall, Inc. 3-6
  • 7.
    Project Selection Five specific criteria for project selection  Backed by management  Timed appropriately for commitment of resources  It moves the business toward attainment of its goals  Practicable  Important enough to be considered over other projects Kendall & Kendall Copyright © 2002 by Prentice Hall, Inc. 3-7
  • 8.
    Possibilities for Improvement  Many possible objectives exist including  Speeding up a process  Streamlining a process  Combining processes  Reducing errors in input  Reducing redundant storage  Reducing redundant output  Improving system and subsystem integration Kendall & Kendall Copyright © 2002 by Prentice Hall, Inc. 3-8
  • 9.
    Feasibility Impact Grid(FIG)  A feasibility impact grid (FIG) is used to assess the impact of any improvements to the existing system  Can increase awareness of the impacts made on the achievement of corporate objectives Kendall & Kendall Copyright © 2002 by Prentice Hall, Inc. 3-9
  • 10.
    Feasibility Impact Grid(FIG)  Current or proposed systems are listed on the left  Objectives are listed on the top  Red arrows indicate a positive impact  Green arrows indicate implementation Kendall & Kendall Copyright © 2002 by Prentice Hall, Inc. 3-10
  • 11.
    Feasibility  Afeasibility study assesses the operational, technical, and economic merits of the proposed project  There are three types of feasibility:  Technical feasibility  Economic feasibility  Operational feasibility Kendall & Kendall Copyright © 2002 by Prentice Hall, Inc. 3-11
  • 12.
    Technical Feasibility Technical feasibility assesses whether the current technical resources are sufficient for the new system  If they are not available, can they be upgraded to provide the level of technology necessary for the new system Kendall & Kendall Copyright © 2002 by Prentice Hall, Inc. 3-12
  • 13.
    Economic Feasibility Economic feasibility determines whether the time and money are available to develop the system  Includes the purchase of  New equipment  Hardware  Software Kendall & Kendall Copyright © 2002 by Prentice Hall, Inc. 3-13
  • 14.
    Operational Feasibility Operational feasibility determines if the human resources are available to operate the system once it has been installed  Users that do not want a new system may prevent it from becoming operationally feasible Kendall & Kendall Copyright © 2002 by Prentice Hall, Inc. 3-14
  • 15.
    Activity Planning Activity planning includes  Selecting a systems analysis team  Estimating time required to complete each task  Scheduling the project  Two tools for project planning and control are Gantt charts and PERT diagrams Kendall & Kendall Copyright © 2002 by Prentice Hall, Inc. 3-15
  • 16.
    Estimating Time Project is broken down into phases  Further broken down into tasks or activities  Finally broken down into steps or even smaller units  Estimate time for each task or activity  May use a most likely, pessimistic, and optimistic estimates for time Kendall & Kendall Copyright © 2002 by Prentice Hall, Inc. 3-16
  • 17.
    Gantt Charts Easy to construct and use  Shows activities over a period of time Kendall & Kendall Copyright © 2002 by Prentice Hall, Inc. 3-17
  • 18.
    Gantt Chart Example C o n d u c t I n t e r v i e w s Kendall & Kendall  Copyright © 2002 by Prentice Hall, Inc. 3-18 Q u e s t i o n n a i r e s R e a d R e p o r t s A n a l y z e D a t a F l o w s I n t r o d u c e P r o t o t y p e s O b s e r v e R e a c t i o n s P e r f o r m C o s t / B e n e f i t P r e p a r e P r o p o s a l P r e s e n t P r o p o s a l 1 5 10 15 20 Current Week Weeks
  • 19.
    PERT Diagram PERT - Program Evaluation and Review Technique  PERT diagrams show precedence, activities that must be completed before the next activities may be started  Used to calculate the critical path, the longest path through the activities  This is the shortest time to complete the project Kendall & Kendall Copyright © 2002 by Prentice Hall, Inc. 3-19
  • 20.
    PERT Diagram Example A C o n d u c t I n t e r v i e w s N o n e 3 B Q u e s t i o n n a i r e s A 4 C R e a d R e p o r t s N o n e 4 D A n a l y z e D a t a F l o w s B , C 8 E I n t r o d u c e P r o t o t y p e s B , C 5 F O b s e r v e R e a c t i o n s E 3 G P e r f o r m C o s t / B e n e f i t D 3 H P r e p a r e P r o p o s a l G 2 I P r e s e n t P r o p o s a l H 2 Kendall & Kendall Copyright © 2002 by Prentice Hall, Inc. 3-20 10 20 30 50 60 70 80 40 A, 3 B, 4 C, 4 D, 8 G, 3 H, 2 I, 2 E, 5 F, 3
  • 21.
    PERT Diagram Advantages  Easy identification of the order of precedence  Easy identification of the critical path and thus critical activities  Easy determination of slack time, the leeway to fall behind on noncritical paths Kendall & Kendall Copyright © 2002 by Prentice Hall, Inc. 3-21
  • 22.
    Timeboxing  Timeboxingsets an absolute due date for project delivery  The most critical features are developed first and implemented by the due date  Other features are added later Kendall & Kendall Copyright © 2002 by Prentice Hall, Inc. 3-22
  • 23.
    Personal Information Manager Software  Personal information manager (PIM) software is useful for scheduling activities and includes features such as:  Telephone and fax number lists  To-do lists  Online calendars Kendall & Kendall Copyright © 2002 by Prentice Hall, Inc. 3-23
  • 24.
    Team Management Teams often have two leaders:  One who leads members to accomplish tasks  One concerned with social relationships  The systems analyst must manage  Team members  Their activities  Their time, and resources Kendall & Kendall Copyright © 2002 by Prentice Hall, Inc. 3-24
  • 25.
    Goal Setting Successful projects require that reasonable productivity goals for tangible outputs and process activities be set  Goal setting helps to motivate team members Kendall & Kendall Copyright © 2002 by Prentice Hall, Inc. 3-25
  • 26.
    Ecommerce Project Management  Ecommerce and traditional software project management differences:  The data used by ecommerce systems is scattered across the organization  Ecommerce systems need a staff with a wide variety of skills  Partnerships must be built externally and internally well ahead of implementation  Security is of utmost importance Kendall & Kendall Copyright © 2002 by Prentice Hall, Inc. 3-26
  • 27.
    Project Failures Project failures may be prevented by  Training  Experience  Learning why other projects have failed Kendall & Kendall Copyright © 2002 by Prentice Hall, Inc. 3-27