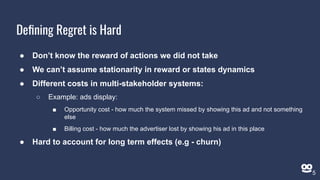
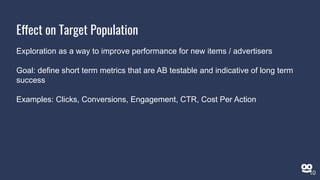
The document discusses the challenges of evaluating exploration effectiveness in recommender systems, emphasizing factors such as a changing state-action space, non-stationarity in user behavior, and the importance of fairness for new items. It outlines the need for metrics that reflect both short-term and long-term impacts on business KPIs and introduces different perspectives on exploration, including maximizing overall utility and improving chances for new advertisers. Additionally, fairness metrics in classification and ranking are explored, highlighting the potential consequences of applying fairness constraints in reinforcement learning.
![4[Ou 2018]](https://image.slidesharecdn.com/reveal2020-explorationevaluationinrecsys-201011150352/85/Challenges-in-Evaluating-Exploration-Effectiveness-in-Recommender-Systems-4-320.jpg)
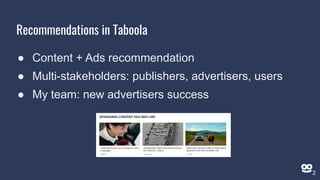
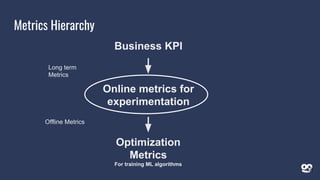
![High level system impact
What is the overall effect of exploration on our system?
Use main metric(s) - e.g user engagement
● Compare traffic with / without exploration (fix model training)
○ Does not account for exploratory data available in training
A
Exploitation
90%
C
Exploration
5%
● Compare model trained on A + B to model trained on A + C
[Chen 2019]
8
B
Exploitation
5%](https://image.slidesharecdn.com/reveal2020-explorationevaluationinrecsys-201011150352/85/Challenges-in-Evaluating-Exploration-Effectiveness-in-Recommender-Systems-8-320.jpg)

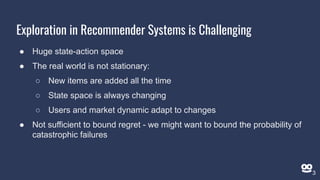
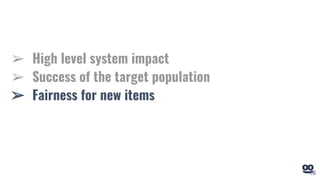
![What do we Want From a Metric
● Indicative of long term gain in Business KPI
● Sensitive to changes, converge fast
● Not too noisy
Also:
● Fast and cheap to compute
● Hard to game, incentivizes the right action
[Gupta et al 2019]
13](https://image.slidesharecdn.com/reveal2020-explorationevaluationinrecsys-201011150352/85/Challenges-in-Evaluating-Exploration-Effectiveness-in-Recommender-Systems-13-320.jpg)
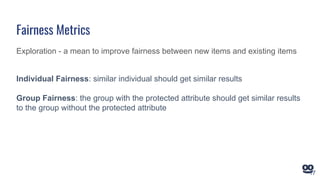
![● Data set of past experiments
● Correlation between the short term metric and business KPI
● Predictive power of the short term metric
Causality:
● Surrogacy assumption: long-term outcome is independent of treatment
conditional on the surrogate
● Surrogate index - combining multiple surrogates [Athey 2019]
Indicative of Long Term Gain in Business KPI
14](https://image.slidesharecdn.com/reveal2020-explorationevaluationinrecsys-201011150352/85/Challenges-in-Evaluating-Exploration-Effectiveness-in-Recommender-Systems-14-320.jpg)

![Don’t consider the effects of short-term actions on long-term rewards:
● Applying fairness constraint may cause more harm to the group they try to
protect at next iteration [Liu 2018]
Take long time to converge:
● Fairness constrained algorithm may take exponential time (in number of
states) to converge to optimal policy [Jabbari 2017]
Fairness in RL
20](https://image.slidesharecdn.com/reveal2020-explorationevaluationinrecsys-201011150352/85/Challenges-in-Evaluating-Exploration-Effectiveness-in-Recommender-Systems-20-320.jpg)
![● Small changes in relevancy can lead to large changes in exposure
● Also the other way around: it doesn’t matter if the model predicted 0.4 or 0.6
if it doesn’t impact the ranking.
● Work on adapting fairness constrained to ranking:
○ Parity: restricting the fraction of items from each group in different positions in
ranking [Zehlike 2017, Yang 2017, Celis 2017]
○ Different fairness constraints [Singh & Joachims 2018]
○ Pairwise comparisons within same query [Beutel 2019]
Fairness in Ranking
21](https://image.slidesharecdn.com/reveal2020-explorationevaluationinrecsys-201011150352/85/Challenges-in-Evaluating-Exploration-Effectiveness-in-Recommender-Systems-21-320.jpg)