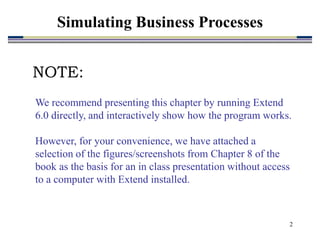
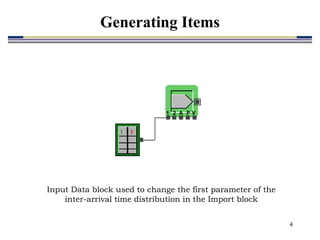
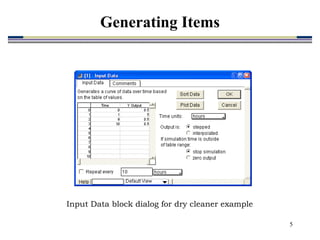
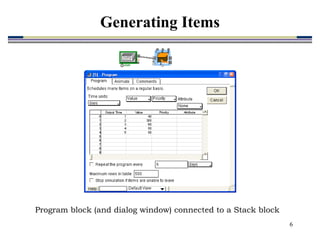
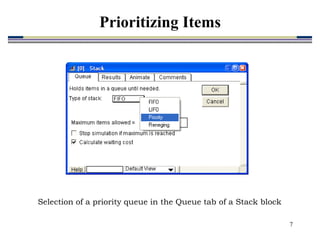
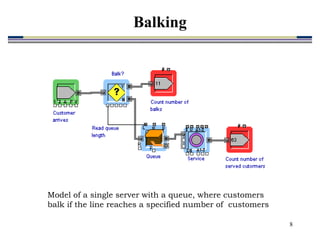
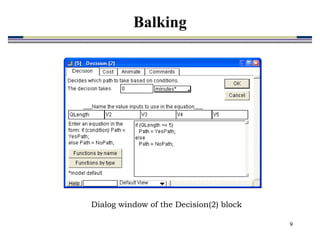
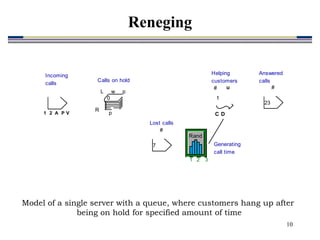
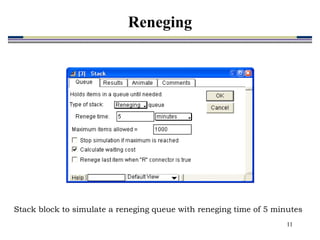
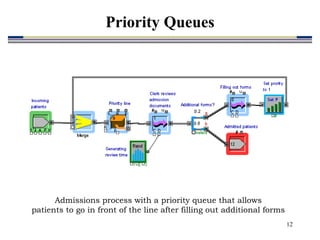
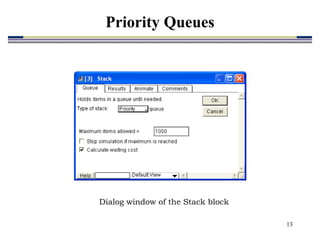
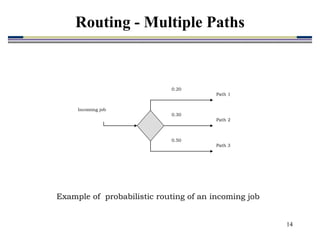
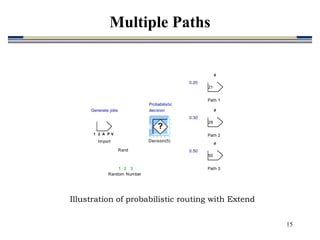
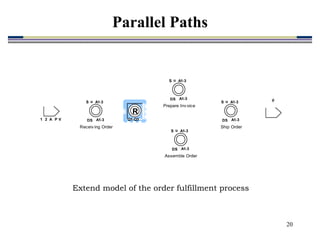
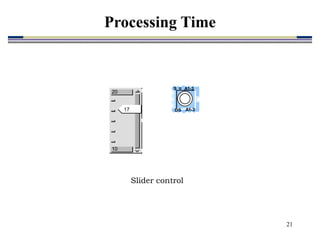
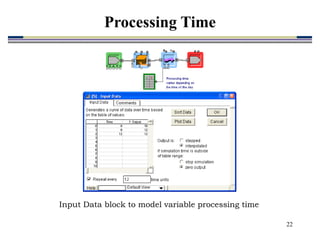
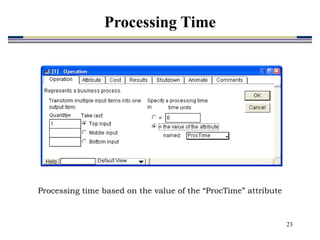
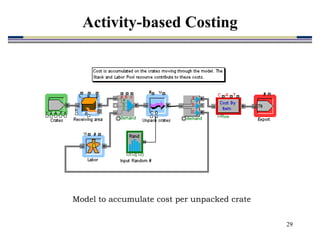
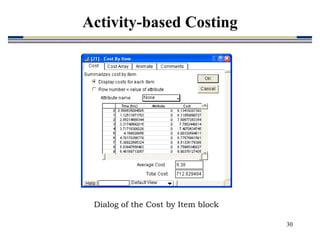
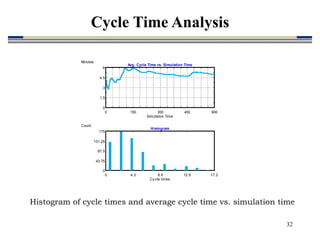
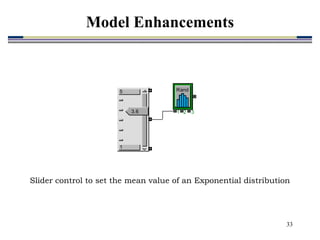
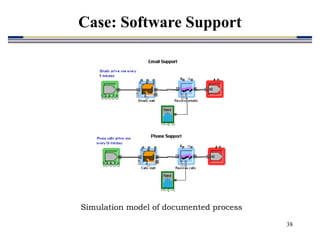
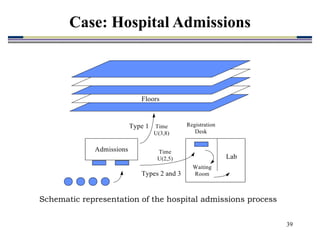
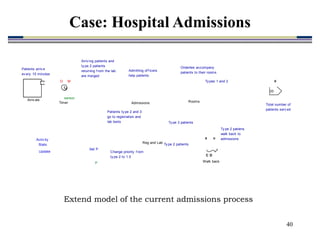
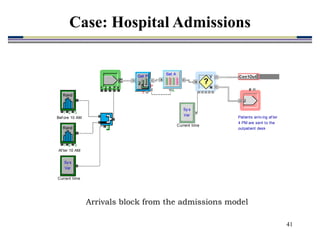
2. 2
Simulating Business Processes
We recommend presenting this chapter by running Extend
6.0 directly, and interactively show how the program works.
However, for your convenience, we have attached a
selection of the figures/screenshots from Chapter 8 of the
book as the basis for an in class presentation without access
to a computer with Extend installed.
NOTE:
3. 3
Import block dialog showing and exponential inter-
arrival times with mean of 6 minutes
Generating Items
4. 4
Input Data block used to change the first parameter of the
inter-arrival time distribution in the Import block
2 V
1 A P
t y
Generating Items
10. 10
Model of a single server with a queue, where customers hang up after
being on hold for specified amount of time
1 2 3
Rand
2 V
1 A P
L w p
p
R
0
C
# u
D
1
#
7
#
23
Incoming
calls
Calls on hold
Answered
calls
Lost calls
Helping
customers
Generating
call time
Reneging
11. 11
Stack block to simulate a reneging queue with reneging time of 5 minutes
Reneging
12. 12
Admissions process with a priority queue that allows
patients to go in front of the line after filling out additional forms
Priority Queues
14. 14
Example of probabilistic routing of an incoming job
Path 1
Path 2
Path 3
0.20
0.30
0.50
Incoming job
Routing - Multiple Paths
15. 15
Illustration of probabilistic routing with Extend
?
Decision(5)
2 V
1 A P
Import
1 2 3
Rand
Random Number
#
21
Path 1
#
29
Path 2
#
50
Path 3
Generate jobs
Probabilistic
decision
0.20
0.30
0.50
Multiple Paths
16. 16
Illustration of tactical routing with customers choosing the shortest line
2 V
1 A P
?
L w p
p
R
A1-3
A1-3
S
DS
u
1 2 3
Rand
#
245
Max
Con
Min
Con
L w p
p
R
A1-3
A1-3
S
DS
u
1 2 3
Rand
#
211
L w p
p
R
A1-3
A1-3
S
DS
u
1 2 3
Rand
#
169
L1
L2
L3
L1
L2
L3
Multiple Paths
20. 20
R
Q1-Q3
2 V
1 A P
A1-3
A1-3
S
DS
u
Receiv ing Order
A1-3
A1-3
S
DS
u
Prepare Inv oice
A1-3
A1-3
S
DS
u
Assemble Order
A1-3
A1-3
S
DS
u
Ship Order
#
Extend model of the order fulfillment process
Parallel Paths
31. 31
Two operations in series with a Timer block to measure cycle time
Cycle Time Analysis
32. 32
Histogram of cycle times and average cycle time vs. simulation time
0 150 300 450 600
0
1.5
3
4.5
6
Simulation Time
Minutes
Avg. Cycle Time vs. Simulation Time
Av g. Cy cle Time Red Green Black
0 4.3 8.6 12.9 17.2
0
43.75
87.5
131.25
175
Cy cle times
Count
Histogram
Delay Time Data Data
Data
Cycle Time Analysis
33. 33
5
1
3.6 1 2 3
Rand
Slider control to set the mean value of an Exponential distribution
Model Enhancements
40. 40
Extend model of the current admissions process
Arriv als
Reg and Lab
Patients ty pe 2 and 3
go to registration and
lab tests
Patients arriv e
ev ery 15 minutes
Ty pe 3 patients
Admitting of f icers
help patients
Ty pe 2 patients
Rooms
Orderlies accompany
patients to their rooms
M
D
sensor
Timer
#
33
Change priority f rom
ty pe 2 to 1.5
Ty pes 1 and 2
Total number of
patients serv ed
Arriv ing patients and
ty pe 2 patients
returning f rom the lab
are merged
Ty pe 2 patiens
walk back to
admissions
Update
Activ ity
Stats
P
Set P
Admissions
C
# u
D
Walk back
Case: Hospital Admissions
41. 41
2 V
1 A P
T
Sy s
Var
Current time
1 2 3
Rand
Bef ore 10 AM
1 2 3
Rand
Af ter 10 AM
Get P
P
Con1Out
Con1Out
Y
N
?
A
Set A
#
2
Patients arriv ing af ter
4 PM are sent to the
outpatient desk
Sy s
Var
Current time
Arrivals block from the admissions model
Case: Hospital Admissions
42. 42
Admissions block from the admissions model
C
# u
D
Ty pe 1
L w p
p
R
Queue
Get P
P
u #
Con1In
Con1In
Con2Out
Con2Out
Con3Out
Con3Out
demand
a
b
c
1 2 3
Rand
C
# u
D
Ty pe 2
Patients wait f or an
admissions of f icer
If patient is ty pe 2 or
3, go to the lab,
otherwise go to the
rooms
1 2 3
Rand
C
# u
D
Ty pe 3
1 2 3
Rand
Get P
P
Pool of admitting
of f icers
demand
a b c
a
b
c
Case: Hospital Admissions
43. 43
Registration and Lab block from the admissions model
C
# u
D
Registration
L w p
p
R
C
# u
D
Lab tests
L w p
p
R
Waiting room
Y
N
?
Get P
P
Con1In
Con1In
Con2Out
Con2Out
Con3Out
Con3Out
1 2 3
Rand
1 2 3
Rand
Patients f orm a line at
the registration desk Patients wait f or a lab
technician
Ty pe 3 patients
leav e the process
Ty pe 2 patients
return to the
admissions desk
Case: Hospital Admissions
44. 44
Rooms block from the admissions model
C
# u
D
Walk to room
demand
a b c
a
b
c
Pool of
orderlies
C
# u
D
Wait f or papers
C
# u
D
Walk back
demand
a
b
c
Con1Out
Con1Out
Con3In
Con3In
select
b
?
a
0.8
0.2
u #
Orderlies and
patients walk to
the rooms
Orderiles and
patients are
unbatched
1 2 3
Rand
Orderlies and
patients are
batched
Orderlies walk back
to admissions
Case: Hospital Admissions
45. 45
Histogram of cycle times for type 1 patients
0
10
20
30
40
50
60
70
80
90
100
20 30 40 50 60 70 80 More
Cycle time
Frequency
.00%
20.00%
40.00%
60.00%
80.00%
100.00%
Case: Hospital Admissions
46. 46
Extend model of the redesigned admissions process
Admissions
Arriv als
Lab tests
Patients ty pe 2 and 3
go to lab tests
Patients arriv e
ev ery 15 minutes
Ty pe 3 patients
leav e
Admitting of f icers
help patients
Ty pe 2 patients
Rooms
Orderlies accompany
patients to their rooms
M
D
sensor
Timer
#
36
Ty pes 1 and 2
Total number of
patients serv ed
Ty pe 1 and 2 patients
are merged
Ty pe 2 patiens
walk to wait f or
an orderly
C
# u
D
Walk back
Case: Hospital Admissions
47. 47
A
B C
D E
F G
Type I
Types
II & III
Measuring cycle times of different types of jobs
Exercise 1
48. 48
A1 B1
A2 B2
A3 B3
Type 1
C1
C2
C3
Type 2
Type 3
Investigating the effect of pooling resources
Exercise 2
51. 51
A
B C
D E F G H
I J
0.2
0.2
0.8
0.5
0.5
Flowchart for Exercise 8
Exercise 8
52. 52
Flowchart for the X-ray process
1 2 3 4 5 6 7
10
11
12
8 9
25%
Project: X-ray Process
53. 53
2
1
3
4 5
Storage of
inbound
material
Parallel operations
(Workstations 1-3)
Assembly
(Workstation 4)
Painting
(Workstation 5) Inspection
Rework
Flowchart of the production process
for the Assembly Factory
Project: An Assembly Factory