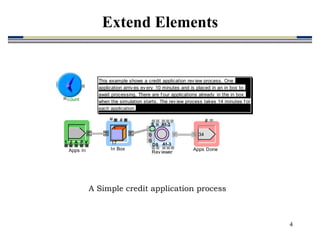
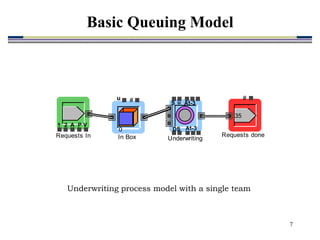
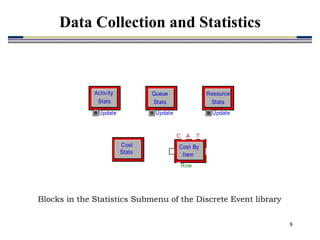
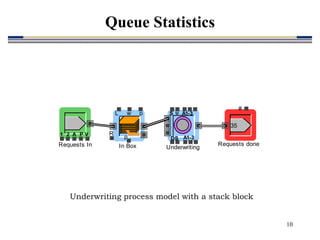
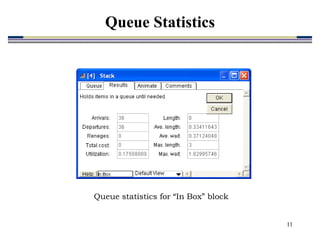
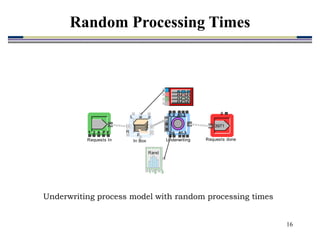
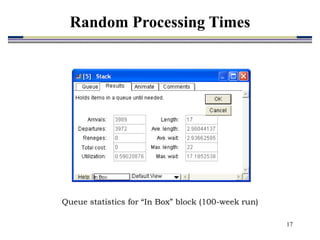
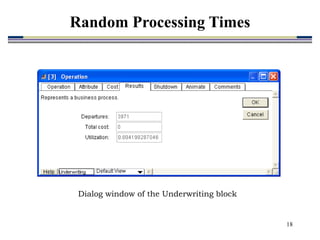
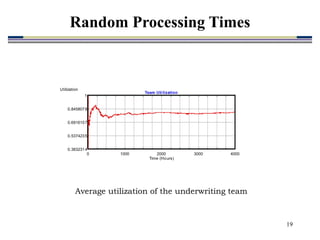
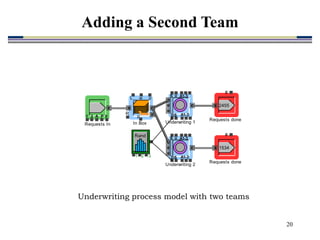
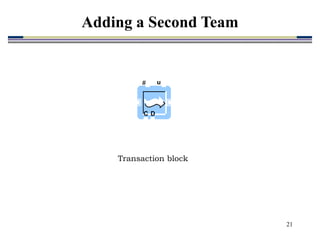
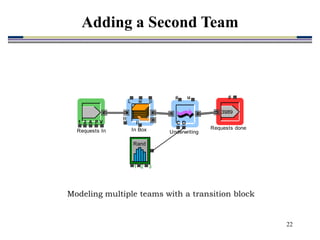
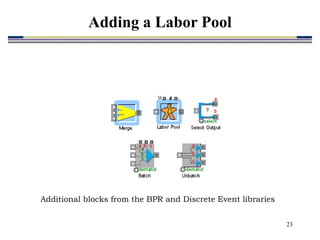
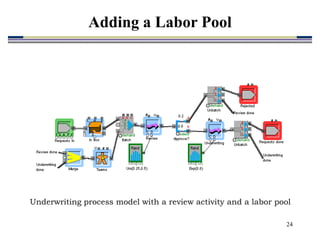
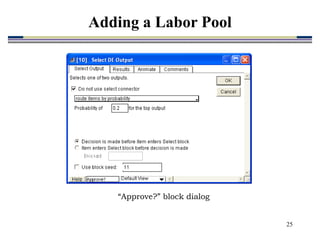
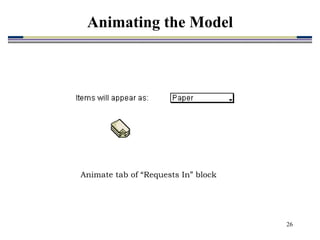
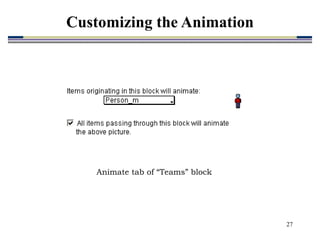
1
Introduction to Extend
Chapter 7
Business Process Modeling, Simulation and
Design
2
Introduction to Extend
We recommend presenting this chapter by running Extend
6.0 directly, and interactively show how the program
works.
However, for your convenience, we have attached a
selection of the figures/screenshots from Chapter 7 of the
book as the basis for an in class presentation without
access to a computer with Extend installed.
NOTE:
3
count
ev ent
2 V
1 A P
u #
A1-3
A1-3
S
DS
u #
Executive Import Repository
Operation Export
Basic Extend Blocks
Extend Elements
4
2 V
1 A P
Apps In
This example shows a credit application rev iew process. One
application arriv es ev ery 10 minutes and is placed in an in box to
await processing. There are f our applications already in the in box
when the simulation starts. The rev iew process takes 14 minutes f or
each application.
u #
17
In Box
A1-3
A1-3
S
DS
u
0
0
Rev iewer
#
34
Apps Done
count
ev ent
A Simple credit application process
Extend Elements
5
Main Extend window
Tutorial: Basic Queuing Model
6
Import dialog window
Basic Queuing Model
7
2 V
1 A P
Requests In
#
35
Requests done
A1-3
A1-3
S
DS
u
Underwriting
u #
0
In Box
Underwriting process model with a single team
Basic Queuing Model
8
Blocks in the Statistics Submenu of the Discrete Event library
Update
Queue
Stats
Cost
Stats
Update
Resource
Stats
Update
Activ ity
Stats
C T
A
Row
Cost By
Item
Data Collection and Statistics
9
Stack block
L w p
p
R
Queue Statistics
10
Underwriting process model with a stack block
2 V
1 A P
Requests In
#
35
Requests done
A1-3
A1-3
S
DS
u
Underwriting
L w p
p
R
In Box
Queue Statistics
11
Queue statistics for “In Box” block
Queue Statistics
12
Plotter, Discrete Event block
Queue Statistics
13
Underwriting process model with a plotter block
2 V
1 A P
Requests In
#
35
Requests done
A1-3
A1-3
S
DS
u
Underwriting
L w p
p
R
In Box
Queue Statistics
14
Waiting time vs. simulation time
0 10 20 30 40
0
0.25
0.5
0.75
1
1.25
1.5
1.75
2
Time (Hours)
Hours
Waiting time at In Box
Waiting time
Queue Statistics
15
Input Random Number block
1 2 3
Rand
Random Processing Times
16
Underwriting process model with random processing times
2 V
1 A P
Requests In
#
3971
Requests done
A1-3
A1-3
S
DS
u
Underwriting
L w p
p
R
In Box
1 2 3
Rand
Random Processing Times
17
Queue statistics for “In Box” block (100-week run)
Random Processing Times
18
Dialog window of the Underwriting block
Random Processing Times
19
0 1000 2000 3000 4000
0.3832314
0.5374235
0.6916157
0.8458078
1
Time (Hours)
Utilization
Team Uti lization
Average utilization of the underwriting team
Random Processing Times
20
Underwriting process model with two teams
2 V
1 A P
Requests In
#
2455
Requests done
A1-3
A1-3
S
DS
u
Underwriting 1
L w p
p
R
In Box
#
1534
Requests done
1 2 3
Rand
A1-3
A1-3
S
DS
u
Underwriting 2
Adding a Second Team
21
Transaction block
C
# u
D
Adding a Second Team
22
Modeling multiple teams with a transition block
2 V
1 A P
Requests In
#
3989
Requests done
L w p
p
R
In Box
1 2 3
Rand
C
# u
D
Underwriting
Adding a Second Team
23
Additional blocks from the BPR and Discrete Event libraries
Adding a Labor Pool
24
Underwriting process model with a review activity and a labor pool
Adding a Labor Pool
25
“Approve?” block dialog
Adding a Labor Pool
26
Animate tab of “Requests In” block
Animating the Model
27
Animate tab of “Teams” block
Customizing the Animation
28
Cost tab of labor pool block
Calculating Costs
29
Cost per request
Calculating Costs
30
Unbatch block dialog
Calculating Costs
31
Underwriting process model with cost collection blocks
Calculating Costs
32
Flowchart view of the simulation model for the Underwriting process
Using the Flowchart View
33
Queue 1 Queue 2
Server 1 Server 2
Process with two servers in series
Exercise 3
34
Teller configuration (multiple queues)
1 2 3 4 5
Exercise 4

ch07-Extend.ppt