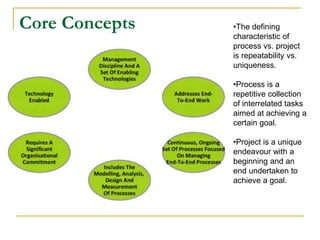
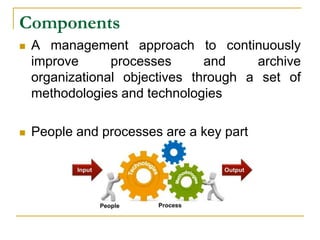
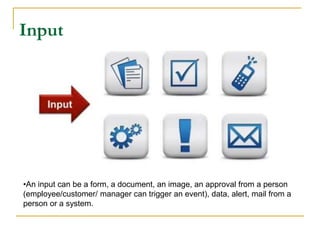
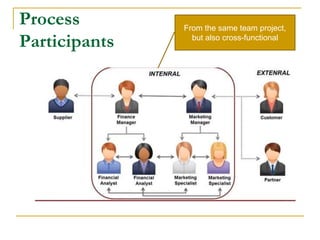
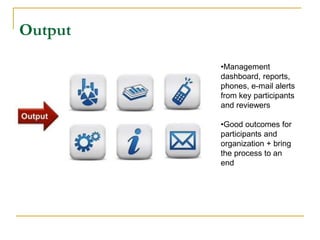
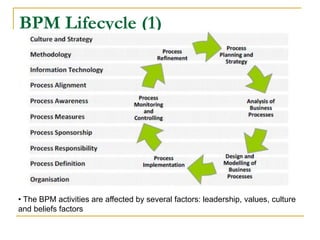
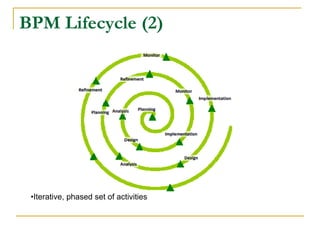
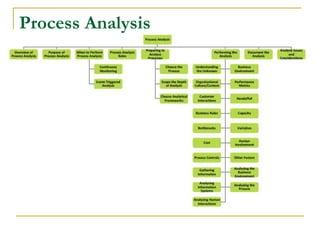
Business Process Management
(BPM)
Information
 Instructor:
 Assist. Prof. Maria-Iuliana Dascalu, PhD, FILS-UPB
 Contact address:
 maria.dascalu@upb.ro
 The course material will be available on:
 www.mariaiulianadascalu.com/teaching
 Schedule:
 Friday, 9th of May, 18-21, room 2103
 Saturday, 16th of May, 9-18 , room 2017
 Sunday, 17th of May, 9-18 , room 2017
 Grading:
 10%: written exam (18 multiple-choice qs and an open qs), 24th of
May, 9-9.50 , room 2017
 20%: research presentation on a given subject (in teams) in-class
on Sunday, 17th of May
 70%: project presentation (in teams), 24th of May, 10-12
The bottom line is…
 Clean kitchen does not necessarily produce tasty food, but
 we’d rather eat a so-so tasty food from a clean kitchen.
 Good processes does not necessarily develop quality
software, but
 we’d rather fly in Airbus with a software from a well-known
company than a small software development house.
 So, there is a need for quality processes, since they decrease
the risk of companies producing low quality products.
 Process management ensure qualitative processes.
Outline
 Definitions
 Core concepts and their descriptions
 Components
 Lifecycle
 Examples
 Advanced concepts
Definitions (1)
 Business = person/ corporation engaged in commerce,
manufacturing, or a service; profit-seeking enterprise
(people/teams are involved for a specific outcome; refers to individuals, interacting together, to perform a set of
activities to deliver value to customers and a return on investment to the stakeholders)
 Process= a systematic series of actions directed to
some end; a continuous set of actions, operations or
series of changes taking place in a definite manner
 Management = the act or manner of managing; handling,
direction or control; executive ability; the person or
persons controlling and directing the affairs of a business
or institution (it requires handling exceptions, providing directions, controlling variables to achieve
desirable outcomes; it requires skills and involves people and executives)
Definitions (2)
Definitions (3)
 Business Process Management:
 Disciplined approach to identify, design, execute, document,measure, monitor
and control both automated and nonautomated business processes to achieve
consistent, targeted results aligned with an organisation’s strategic goals
 Involves the deliberate, collaborative and increasingly technology aided
definition, improvement, innovation and management of end-to-end business
processes that drive business results, create value and enable an organisation
to meet its business objectives with more agility
 Enables an enterprise to align its business processes to its business strategy,
leading to effective overall company performance through improvements of
specific work activities either within a specific department, across the enterprise
or between organisations
(Association of Business Process Management Professionals-ABPMP)
Outline
 Definitions
 Core concepts and their descriptions
 Components
 Lifecycle
 Examples
 Advanced concepts
Core Concepts •The defining
characteristic of
process vs. project
is repeatability vs.
uniqueness.
•Process is a
repetitive collection
of interrelated tasks
aimed at achieving a
certain goal.
•Project is a unique
endeavour with a
beginning and an
end undertaken to
achieve a goal.
Management Discipline and Enabling
Technologies
 Enabling technology is meaningless without the management
disciplines and processes for exploiting the technology
 Vendors have created application suites which help enable
organisations to better manage their business processes
 Tools to visually design and model business processes
 Simulate and test business processes, automate, control and
measure business processes
 Provide feedback and reporting on process performance
 Some vendors have combined these into integrated business
process management suites
Addresses End-To-End Work
 Business functions are typically defined by a group
of activities related by a particular skill or goal such
(i.e. sales, finance, manufacturing)
 Business processes focus on the end-to-end work,
i.e., tasks and activities, across functional
boundaries to deliver customer value
 Business processes have defined inputs and
outputs and functions have not
Ongoing Management of Processes
 BPM involves a permanent ongoing
organisational commitment to managing the
organisations processes
 Includes:
 Modelling
 Analysis
 Process design
 Performance measurement
Modelling, Analysis, Design and
Measurement of Processes
 Practice of BPM requires the measurement and
supervision of process performance
 Setting process performance goals
 Measuring actual performance, the efficiency of the business
processes (“doing the thing right“)
 Reviewing the effectiveness of business processes (“doing the
right thing“)
 Providing information, insight and feedback to other primary
activities such as process analysis, design and transformation
 Gather information at key points in the process to
support decisions regarding cost or timing
Organisational Commitment
 Management of end-to-end business process crosses organisational
boundaries
 New roles and responsibilities are introduced, such as process
owners, designers and architects
 Individuals responsible for end-to-end process design must interact
with traditional functionally based managers
 New governance structures need to be introduced which may change
the way organisations make decisions and allocate resources
 Practice of BPM requires a significant organisational commitment:
without organisational commitment, the practice and benefits of BPM
is unlikely to mature within an organisation
 • Without supporting leadership, values, beliefs and culture, BPM is
unlikely to successfully take hold within an organisation
BPM Technology
 BPM is a technology enabled and supported management discipline
 Wide range of technologies available to support the planning, design,
analysis, operation and monitoring of business processes
 Application suites available which help enable organisations to better
manage their business processes
 BPM systems must be able to integrate with legacy systems in order to
control work and get information or measure performance
 Common framework for how these technologies are deployed is most
often referred to as a Service Oriented Architecture (SOA)
Outline
 Definitions
 Core concepts and their descriptions
 Components
 Lifecycle
 Examples
 Advanced concepts
Components
 A management approach to continuously
improve processes and archive
organizational objectives through a set of
methodologies and technologies
 People and processes are a key part
Input
•An input can be a form, a document, an image, an approval from a person
(employee/customer/ manager can trigger an event), data, alert, mail from a
person or a system.
Process
Participants
From the same team project,
but also cross-functional
Process Activities
 Types:
 Value Added - contribute to the process output in a
positive way
 Handoff - pass control of the process to another
department or organisation
 Control - assure that the processes behave within
desired tolerances or specify a validity checkpoint
 Examples:
 Planning & strategy
 Analysis
 Design & modeling
 Implementation
 Monitoring & controlling
 Refinement
Output
•Management
dashboard, reports,
phones, e-mail alerts
from key participants
and reviewers
•Good outcomes for
participants and
organization + bring
the process to an
end
Outline
 Definitions
 Core concepts and their descriptions
 Components
 Lifecycle
 Examples
 Advanced concepts
BPM Lifecycle (1)
• The BPM activities are affected by several factors: leadership, values, culture
and beliefs factors
BPM Lifecycle (2)
•Iterative, phased set of activities
Process Planning and Strategy
 Sets the strategy and direction for the BPM
process
 Plan starts with an understanding of organisational
strategies and goals
 Provides a foundation for a holistic BPM approach to
ensure the alignment with organisational strategy and
the integration of strategy, people, processes and
systems across functional boundaries
 Identifies appropriate BPM organisational roles and
responsibilities, executive sponsorship, goals and
expected performances measures and methodologies
Analysis of Business Processes
 Takes information from strategic plans,
process models, performance
measurements, changes in the environment
and other factors in order to fully understand
the business processes in the context of the
overall organisation
Design and Modelling of Business
Processes
 Document the sequence of activities, including the
design of what work is performed, at what time, in
what location, by what process actors using what
methodology
 Defines what the organisation wants the process to
be and answers the what, when, where, who and
how questions of how end-to-end work is executed
 Ensures that the proper management controls and
metrics are in place for compliance and performance
measurement
Process Monitoring and Controlling
 Continuous measuring and monitoring of business
processes provides the information necessary to
adjust resources in order to meet process objectives
 Measuring and monitoring also provides critical
process performance information through key
measurements related to goals and value to the
organisation
 Analysis of process performance information can
result in improvement, redesign or reengineering
activates
Process Refinement
 Implements the output of the iterative
analysis and design cycle
 Addresses organisational change
management challenges
 Aimed at continuous improvement and
process optimisation
Outline
 Definitions
 Core concepts and their descriptions
 Components
 Lifecycle
 Examples
 Advanced concepts
Continuous vs. Ad Hoc
Simple vs. Complex: number of steps, number of
participants, number of people/systems involved, number of exceptions
Other examples…
 Management processes:
 used to measure, monitor and control business activities
 ensure that a primary or supporting process meets operational,
financial, regulatory and legal goals
 Primary (core) processes:
 end-to-end, cross-functional processes which directly deliver value
 represent the essential activities an organisation performs to fulfill its
mission
 Support processes:
 support primary processes, often by managing resources and/or
infrastructure required by primary processes
 not directly deliver value (does not mean that they are unimportant to
an organisation); e.g. information technology management and human
resource management
Example: Request to IT Department
Outline
 Definitions
 Core concepts and their descriptions
 Components
 Lifecycle
 Examples
 Advanced concepts
Advanced Concepts
1. Process Ownership
2. Process Modelling
3. Process Analysis
4. Process Design
5. Process Performance Measurement
6. Process Transformation
7. Process Implementation
8. Process Quality
9. Process Management Organisation
10. Enterprise Process Management
11. Process Management Technology
1. Process Ownership
Process Ownership
 Successful BPM implementations recognise that the
role of a process owner is critical
 Process owner is responsible for the entire end-to-
end process across functional departments
 Success of this role depends on the authority the
individual has to control the budget and make
decisions that effect the development, maintenance
and improvement of the business process
2. Process Modelling
Process Modelling
Process Diagrams, Maps and Models
 Diagrams:
 Process diagram often depicts simple notation of the basic
workflow of a process
 Depicts the major elements of a process flow, but omits the minor
details which are not necessary for understanding the overall flow
of work
 Maps:
 More precision than a diagram
 More detail about process and important relationships to other
elements such as performers (actors), events, results
 Provide a comprehensive view of all of the major components of
the process
 Models:
 Represents the performance of what is being modelled
 Needs greater precision, data about the process and about the
factors that affect its performance
 Often done using tools that provide simulation and reporting
capability to analyse and understand the process
Process Attributes and Characteristics
 describe the properties, behaviour, purpose and
other elements of the process
 are captured in a tool in order to organise, analyse
and manage an organisation’s portfolio of processes
 examples:
 Inputs/Outputs, Events/Results, Value Add,
Roles/Organisations, Data/Information, Probabilities,
Queuing, Transmission Time, Wait Time, Arrival
Patterns/Distributions, Costs (indirect and direct), Entry
Rules, Exit Rules, Branching Rules, Join Rules,
Work/Handling Time, Batching, Servers (number of people
available to perform tasks)
Purpose of Process Modelling (1)
 A model is rarely a complete and full representation
of the actual process
 Objective is to create a representation of the
process that describes it accurately and sufficiently
for the task at hand
 Models are simplified representations that facilitate
understanding of that which is being studied and
making decisions about it
Purpose of Process Modelling (2)
 Focus on representing those attributes of the process that support continued
analysis from one or more perspectives
 Understanding the business process through the creation of the model
 Creating a visible representation and establishing a commonly shared
rerspective
 Process models are the primary means for
 Measuring performance against standards
 Determining opportunities for change
 Expressing the desired end state preceding a change effort
 Benefits of Modelling:
 Models are relatively fast, easy and inexpensive to complete
 Models are easy to understand (when compared to other forms of documentation)
 Models provide a baseline for measurement
 Models facilitate process simulation and impact analysis
Modelling Standards and Notations
 Range of number of modelling and notational standards and
Techniques
 Models provide a language for describing and communicating as-is and
to-be process information
 Like all new languages must be learned
 Examples:
 Business Process Modelling Notation (BPMN)
 Flow Charting
 Event Process Chain (EPC)
 Value Chain
 Unified Modelling Language (UML)
 IDEF-0 (Integration Definition for Function Modelling)
 LOVEM-E (Line of Visibility Engineering Method - Enhanced)
 SIPOC (Supplier, Input, Process, Output and Customer)
 Systems Dynamics
 Value Stream Mapping
Business Process Modelling Notation
(BPMN)
 Widely used and supported standard for business
process modelling
 Provides a graphical notation for specifying business
processes in a Business Process Diagram (BPD)
 Uses a flowcharting technique similar to activity
diagrams from Unified Modelling Language (UML)
 Can output BPMN to Business Process Execution
Language (BPEL)
 Standard executable language for specifying interactions
with Web Services
 Emerging standard
BPMN - Structure
 BPMN – Events: denote something that happens
 Classifications: Catching – triggered by external event or Throwing – generating an output
 Types: Start Event - acts as a trigger for the process, End Event - represents the result of a process,
Intermediate Event - represents something that happen between the start and end events
 BPMN – Activities: describe the kind of work that must be done
 Types: Task - represents a single unit of work that is not or cannot be broken down to a further level of
business process detail, Sub-Process - used to hide or reveal additional levels of business process
detail, Transaction - a form of sub-process in which all contained activities must be treated as a whole
 BPMN – Gateway: determines forking and merging of paths depending on the conditions expressed
 BPMN – Flow objects are connected to each other using connecting objects.
 Types: Sequence Flow - shows in which order the activities will be performed, Message Flow - shows
what messages flow across organisational boundaries, Association - associate an Artefact to a Flow
Object and can indicate directionality
 BPMN - Swim Lanes: visual mechanism of organising and categorising activities, based on cross
functional flowcharting
 Types: Pool - represents major participants in a process and contains one or more lanes, Lane - used
to organise and categorise activities within a pool according to function or role
 BPMN – Artefacts: used to bring some more information into the model/diagram
 Types: Data Objects - show the data is required or produced in an activity, Group - used to group
different activities but does not affect the flow in the diagram, Annotation - used to provide the
model/diagram with understandable details
References
 Association of Business Process Management Professionals
(ABPMP) Business Process Management Common Body of
Knowledge (CBOK)
 Alan McSweeney, “Introduction to Business Process
Management”, 2010
 M. Staron, W. Meding, “Ensuring Reliability of Information
Provided by Measurement Systems”, Ericsson
 M. Staron, “Software Leadership and Quality Assurance”,
Gothenburg University, 2010
Business Process Management
(BPM) – cont.
Process Modelling Quality
 Most process analysis and design efforts
require the use of models to describe what is
happening during the process
 Useful to have some standards and measures
of quality as it relates to process modeling
 Quality of model defined by its accuracy,
amount of detail and completeness
Requirements of a Process Model
 Business environment
 Organisational structure
 Business rules
 Process structure
Model Validation and Simulation
 Useful or necessary to validate the model
through simulation
 Validate the model through simulation is to
compare simulated outputs to real-world
results
Modelling Perspectives
 Processes can
be modelled
from many
perspectives
 All perspectives
are maintained
in a process
repository
Modelling Approaches
 Bottom-up
 Top-down
 Middle-out
Capturing Information for Process
Modelling
 Direct Observation
 Interviews
 Survey/Written Feedback
 Structured Workshops
 Web-Based Conferencing
Modelling Participants
 Business strategists
 Business managers
 Financial analysts
 Auditors
 Compliance analysts
 Process performance analysts
 Requirements analysts
 Systems analysts
 Business analysts
Modelling Techniques and Tools
 White Boarding and Flip Charts
 Paper and Post-Its
 Drawing Tools and Reports (e.g. Visio,
PowerPoint)
 Electronic Modelling and Projection:
 Repository-based tools allow the reuse of objects
or patterns that have already been defined in
previous efforts
Process Simulation
 Form of models which provide valuable insight to
process dynamics
 Simulations require sufficient data which typically
allows the process to be mathematically simulated
under various scenarios, loads, etc.
 Simulations can be manual or electronic using
process simulation tools
 Various benefits
3. Process Analysis
Process Analysis
Purpose of Process Analysis
 Process analysis is an essential tool to show how well the business is meeting its objectives
 Due to business change the processes of an organisation can quickly become inconsistent to their
original design and no longer meet the needs of the business
 Analysis generates an understanding and measurement of process effectiveness and its efficiency
 Information generated from analysis includes:
 Strategy, culture and environment of the organisation that uses the process (why the process
exists)
 Inputs and outputs of the process
 Stakeholders, both internal and external, including suppliers, customers and their needs and
expectations
 Inefficiencies within the current process
 Scalability of the process to meet customer demands
 Business rules that control the process and why they must exist
 What performance metrics should monitor the process, who is interested in those metrics and
what they mean
 What activities make up the process and their dependencies across departments and business
functions
 Improved resource utilisation
 Opportunities to reduce constraints and increase capacity
When to Perform Process Analysis
 Can be the result of continuous monitoring of
processes or can be triggered by specific
events, such as:
 Strategic Planning
 Performance Issues
 New Technologies
 Startup Venture
 Merger/Acquisition
 Regulatory Requirements
Process Analysis Roles
 Performed by a single individual or by a cross-functional team
 Analyst
 Decide the depth and scope of the analysis
 How it is analysed
 Perform the analysis
 Provide documentation and final reports to the stakeholders and
executive leadership
 Facilitator
 Lead process analysis teams with an unbiased view
 Subject Matter Experts
 Individuals closest to the process with knowledge and expertise
 Familiar with both the business and technical infrastructure that
supports the process
Preparing the Analysis
 Choose the
process
 Determine the
scope of the
depth of analysis
 Choose analytical
frameworks
Performing the Analysis
4. Process Design
Process Design
Process Design Principles (1)
 Design around customer interactions
 Design around value-adding activities
 Minimise/ automate handoffs
 Work is performed where it makes the most sense
 Provide a single point of contact
 Ensure a continuous flow
 Reduce batch size: batching causes wait time for items at the
end of the batch
 Capture information once at the source and share it:
eliminate data redundancy
 Involve as few as possible
 Redesign, then automate
 Ensure quality at the beginning
Process Design Principles (2)
 Standardise processes: when there is no
standardisation there cannot be process control
 Use co-located or networked teams for complex
issues
 If complex problems occur regularly, consider co-locating
team members
 If co-location does not make sense, then network the team
so information can smoothly flow
 Consider outsourcing business processes
 Compare to the costs of designing the process in-house as
well as compared to the risks associated with outsourcing
 Process Compliance
 Process Design Considerations
5. Process Performance Measurement
Process Performance Measurement
Business Process Action Hierarchy
Process Hierarchy Example
Key Process Performance Definitions
 All processes have a metric or
measurement associated with
the work or output of the
process that is performed
 Metrics are based on the
following fundamental metric
dimensions: time, cost, capacity,
quality
 When a process is value-added?
 When it is required to generate
the output required by the
customer of the process
 When the customer is willing to
pay for the process
 When it enhances customer
experience
Key Performance Indicators (KPIs)
Examples of KPIs
Measurement Methods
 Several common measurement
methodologies used in BPM implementations
 Value Stream Mapping
 Activity Based Costing (ABC)
 Statistical Methods
6. Process Transformation
Process Transformation
BPM Improvement Methodologies
 An approach with principles, procedures and
practices that provide guidelines for
designing and executing the different
components within BPM
Other Methodologies
 Lean:
 originated by Toyota
 Focus on reduction of process wastes
 TQM (Total Quality Management)
 focus on process measurement and controls as a megans of
continuous improvement
 statistical analysis
 Performance Improvement Model
 developed in the early 1990s
 framework aligns processes at three distinct three levels of
performance: organisational, process and job/ performer
 Redesign
 although it may lead to significant changes, these changes continue to
be based on the fundamental concepts of the existing process
 Reengineering
 Mike Hammer’s 1993 book Reengineering the Corporation
 radical change of process
7. Process Implementation
Process Implementation
Activity Specification
 Each implementation activity specification should
include:
 Objectives, performance metrics and list of deliverables—
all related to delivering improved customer value
 Risks for completion and how to be minimised
 Accountability for completion
 Financial, personnel, any IT support and other resources
required
 Length of time for completion
 Any implementation task cross-functional
interdependencies
Orchestrating Change
8. Process Quality
Are these all of the same quality? Do they cost the
same?
What is good quality?
 Please list 3 characteristics of a good quality
car.
What about these?
What is a “good quality” mobile
phone?
 List 3 characteristics of a good quality phone.
 How about the characteristics of a process to
make a phone?
Definition of Quality
 IEEE (IEEE_Std_610.12-1990) :
 the degree to which a system, component, or process meets
specified requirements/ customer or user needs or expectations
 Fault (according to ISO/CD 10303-226):
 “an abnormal condition or defect at the component,
equipment, or sub-system level which may lead to a failure”
 Failure:
 the state or condition of not meeting a desirable or intended
objective
 Defect:
 see fault
Root Cause Analysis (RCA)
 RCA is used to find the root causes of defects –
what is the cause of the failure
 RCA can be done using a number of methods:
 Barrier analysis
 Causal factor tree analysis
 Change analysis
 Failure mode and effects analysis
 Fault tree analysis
 5 Whys
 Ishikawa diagram
 Pareto analysis
5 Whys: Example
 Problem Statement: You are on your way home from work and
your car stops in the middle of the road.
1. Why did your car stop?
- Because it ran out of gas.
2. Why did it run out of gas?
- Because I didn't buy any gas on my way to work.
3. Why didn't you buy any gas this morning?
- Because I didn't have any money.
4. Why didn't you have any money?
- Because I lost it all last night in a poker game.
5. Why did you lose your money in last night's poker game?
- Because I'm not very good at "bluffing" when I don't have a good
hand.
Ishikawa Diagram: Principles
 Causes are grouped into categories and linked together
(primary and secondary causes)
 The list of categories is not definite, the figure shows the
“typical”
• Relationships are used to
backtrack the cause of a
particular problem.
• The analysis requires
more effort than 5 whys
but still no statistics is
necessary.
Example
Exercise
 Imagine the following situation: You are a
quality manager in a software development
project in a new version of the Hyunday i30
car. A new version of the software for the
ABS (Anti-Block System) brakes has been
delivered and it does not work. Please draw
the Ishikawa diagram that would help you do
Root Cause Analysis.
Pareto Analysis: Principles
 Pareto analysis is based on the assumption
that 20% of the units contributes with 80% of
the effect, e.g.:
 20% of the modules contain 80% of errors
 80% of failures are caused by 20% of the defects
 The basis of Pareto Analysis is Pareto
diagram
Pareto Diagram: Example
Absence of defects = good quality?
 What is a quality process?
 How would you recognize a quality process in
a restaurant?
 How about software development?
Rational Unified Process (RUP)
RUP is a quality process…
Well defined phases
Well defined activites
Well defined tasks
Well defined deliverables
Templates
Team support
Tool support
…
Team Software Process (TSP)
 is a detailed process description for small
teams, containing:
 details of activities
 QA
 …
 Organizations implementing TSP announced:
 productivity improvements of 25% or more
 reductions in cost and schedule variance to less than +/-
10%
 testing costs and schedule reductions of up to 80%
Capability Maturity Model Integration
(CMMI)
 CMMI can be used to guide process improvement across a project, a division, or
an entire organization
 Processes are rated according to their maturity levels
 CMMI best practices are published in documents called models, each of which
addresses a different area of interest: development, acquisition, services
 Capability Maturity Model describes how good an organization is in its
processes
 Starts from unpredictable and reactive (ad-hoc) processes
 Ends with processes focused on the continuous improvement
 http://www.sei.cmu.edu/cmmi/
CMM Levels
Key Process Area (KPA)
 Each maturity level
has some associated
KPAs
 KPAs are from 4
categories: project
management, process
management,
engineering, support
 The relationship is:
 Maturity level =>
KPA
 Not vice versa!!!
•The assumption is that the more
advanced the organization is =>
the more mature its processes
are => the more difficult KPAs it
implements
CMMI’s relationship to quality
 Level 1 “expects” the following process areas
 Quality assurance (PPQA)
 Measurement and analysis
 Level 2 “expects” the following process areas
 Verification
 Validation
 Level 3 “expects”
 Automation, including automated measurement
processes
PPQA’s main specific goals related to QA
 SG1: Objectively Evaluate Processes and Work
Products
 SP1.1: Objectively Evaluate processes
 SP1.2: Objectively evaluate work products and services
 SG2: Provide objective insight
 SP2.1: Communicate and Ensure Resolution of
Noncompliance issues
 SP2.2: Establish records
Objectivity: Examples
 Examples of measurement data
 Estimated/planned vs. actual data on software size, cost,
and schedule
 Productivity data
 Coverage and efficiency of peer reviews
 Organization’s measurement program includes
 Definition of the organization-wide measurements
 Collection of the organization’s measurement data
 Analysis of the organization’s measurement data
 Quantitative measurement goals for the organization
CMMI Assessment
 Checking the CMMI level is done ‘manually’ during an
assessment
 Has to be done by an accredited auditor
 Is supported by methods like SCAMPI (Standard CMMI Appraisal
Method for Process Improvement)
 Capability vs. maturity – continuous representation vs. staged
one
Practical considerations about CMMI
 CMMI is a comparison framework and a descriptive maturity level
framework
 If you want to improve your organization, CMMI does not tell you
HOW to do it
 CMMI describes areas which the organizations should consider
 CMMI level 5 does NOT guarantee that the software will be free
of errors
 The projects might be on budget, requirements correct, testing
correct, but…
 … one needs to know the “Garbage in – garbage out” principle
 CMMI is very good and well-known, but not the only framework
like this
 CMMI is very high level
 If an organization wants to focus on a specific area, say QM, then
CMMI is not very helpful
Process Management Maturity Levels
 There are several Process Management Maturity Models
 Process Maturity Models define levels of awareness for business process best
practices and automation with some assessing the management of operational
processes
SPICE
 SPICE is a major international initiative to support the
development of an International Standard for Software Process
Assessment
• http://www.sqi.gu.edu.au/spice/what.html
Deming’s PDCA: Plan-Do-Check-Act
• Iterative problem
solving process
used for process
improvement
How to improve processes?
 Rational Unified Process has its own
improvement framework:
 http://www-01.ibm.com/software/rational/mcif/
 Deming’s PDCA: Plan-Do-Check-Act:
 iterative problem solving process
Measures of Software Process Quality:
Example
 Fault-Slip
Through:
 this measure
helps to
understand the
efficiency of
testing in each
phase
Conclusions so-far…
 “The quality of a product is largely determined
by the quality of the process that is used to
develop and maintain it.” (Shewhart, Juran,
Deming and Humphrey), but…
 Once the process is of a good quality this does
not mean that the product is of a good quality
 No product QA -> no quality
 Process is not followed -> no quality
Quality Metrics
 According to standard ISO/IEC 15939, measure (i.e. metric) is
a
 ”variable to which a value is assigned as the result of
measurement”
 “Categories” of metrics:
 Simple
 Statistics
 Key performance indicators (KPI)
 Measurement Systems: set of metrics that present the status
and/or progress of a specific area
 Can anything/everything be measured?
 Can we trust metrics/statistics?
ISO/IEC 15939 (1)
 an international standard that defines a
measurement process for software
development and systems engineering:
 ”This international standard identifies the activities
and tasks that are necessary to successfully
identify, define, select, apply and improve
measurement within an overall project or
organizational measurement structure.”
ISO/IEC 15939 (2)
Measurement System: the Principles
Measurement System: the Conceptual
Model
An optimal
measurement
information model
has to be defined!!!
Measurement Information Model
 “is a structure linking information needs to the
relevant entities and attributes of concern” –
from Annex A (ISO/IEC 15939)
 defines measurement constructs which link
information needs with attributes of entities
Ericsson Example (*)
(*) A framework for developing
measurement systems and its industrial
evaluation - Miroslaw Staron , Wilhelm
Meding, Christer Nilsson
Main Benefices of Using Measurement
Systems
 New means of communication: common
language, based on an ISO standard
 Automation (data collection, analysis,
presentation)
 Reliability (assured by check-indicators)
More on: “Ensuring Reliability of Information Provided by Measurement Systems” –
M. Staron, W. Meding
9. Process Management Organisation
Process Management Organisation
Cross Functional Processes – Crossing “Vertical”
Operational Organisational Units
Enterprise Process Management
 Assures alignment of the portfolio of end-to-end business
processes and process architecture with the organisation’s
business strategy and resource allocation
 Provides a governance model for the management and
evaluation of initiatives
 Involves the deliberate, collaborative and increasingly
technology-aided definition, improvement, innovation and
management of end-to-end business processes that drives
business agility
10. Enterprise Process Management
11. Process Management Technology
Process Management Technology
 Increasing use of computer applications to assist with the analysis,
design, implementation, execution, management and monitoring of
business processes
 Business Process Management Systems (BPMS) include a large
number of computer applications that continue to evolve as our
understanding of business processes matures and requirements
for handling complex issues and large volumes of information
increase
 All studies of successful BPM programs have found that BPM
Systems are important and necessary components of any BPM
effort
 BPM technology can encompass some or all of BPM lifecycle:
modelling and design, simulation, implementation - publish
designed processes to controlling platform, management and
control
Software Components Supporting BPM Activities
Free BPM Software
 ADONIS
 ARIS Express
 BonitaSoft
 BizAgi
 Intalio
 ProcessMaker
Process Management Conclusions
Examples of processes you can model (1)
 Launch Voyager
space craft, in
order to to
extend the
exploration of the
solar system
beyond the
furthest point that
has ever been
reached
Examples of processes you can model (2)
 Control a smart home
Examples of processes you can model (3)
 Buy
something
Examples of processes you can model (4)
 Print a 3D
object with
a bio-printer
Examples of processes you can model (5)
 Print a 3D object with a bio-printer

2014-Dascalu_BPM.ppt

  • 1.
  • 2.
    Information  Instructor:  Assist.Prof. Maria-Iuliana Dascalu, PhD, FILS-UPB  Contact address:  maria.dascalu@upb.ro  The course material will be available on:  www.mariaiulianadascalu.com/teaching  Schedule:  Friday, 9th of May, 18-21, room 2103  Saturday, 16th of May, 9-18 , room 2017  Sunday, 17th of May, 9-18 , room 2017  Grading:  10%: written exam (18 multiple-choice qs and an open qs), 24th of May, 9-9.50 , room 2017  20%: research presentation on a given subject (in teams) in-class on Sunday, 17th of May  70%: project presentation (in teams), 24th of May, 10-12
  • 7.
    The bottom lineis…  Clean kitchen does not necessarily produce tasty food, but  we’d rather eat a so-so tasty food from a clean kitchen.  Good processes does not necessarily develop quality software, but  we’d rather fly in Airbus with a software from a well-known company than a small software development house.  So, there is a need for quality processes, since they decrease the risk of companies producing low quality products.  Process management ensure qualitative processes.
  • 8.
    Outline  Definitions  Coreconcepts and their descriptions  Components  Lifecycle  Examples  Advanced concepts
  • 9.
    Definitions (1)  Business= person/ corporation engaged in commerce, manufacturing, or a service; profit-seeking enterprise (people/teams are involved for a specific outcome; refers to individuals, interacting together, to perform a set of activities to deliver value to customers and a return on investment to the stakeholders)  Process= a systematic series of actions directed to some end; a continuous set of actions, operations or series of changes taking place in a definite manner  Management = the act or manner of managing; handling, direction or control; executive ability; the person or persons controlling and directing the affairs of a business or institution (it requires handling exceptions, providing directions, controlling variables to achieve desirable outcomes; it requires skills and involves people and executives)
  • 10.
  • 11.
    Definitions (3)  BusinessProcess Management:  Disciplined approach to identify, design, execute, document,measure, monitor and control both automated and nonautomated business processes to achieve consistent, targeted results aligned with an organisation’s strategic goals  Involves the deliberate, collaborative and increasingly technology aided definition, improvement, innovation and management of end-to-end business processes that drive business results, create value and enable an organisation to meet its business objectives with more agility  Enables an enterprise to align its business processes to its business strategy, leading to effective overall company performance through improvements of specific work activities either within a specific department, across the enterprise or between organisations (Association of Business Process Management Professionals-ABPMP)
  • 12.
    Outline  Definitions  Coreconcepts and their descriptions  Components  Lifecycle  Examples  Advanced concepts
  • 13.
    Core Concepts •Thedefining characteristic of process vs. project is repeatability vs. uniqueness. •Process is a repetitive collection of interrelated tasks aimed at achieving a certain goal. •Project is a unique endeavour with a beginning and an end undertaken to achieve a goal.
  • 14.
    Management Discipline andEnabling Technologies  Enabling technology is meaningless without the management disciplines and processes for exploiting the technology  Vendors have created application suites which help enable organisations to better manage their business processes  Tools to visually design and model business processes  Simulate and test business processes, automate, control and measure business processes  Provide feedback and reporting on process performance  Some vendors have combined these into integrated business process management suites
  • 15.
    Addresses End-To-End Work Business functions are typically defined by a group of activities related by a particular skill or goal such (i.e. sales, finance, manufacturing)  Business processes focus on the end-to-end work, i.e., tasks and activities, across functional boundaries to deliver customer value  Business processes have defined inputs and outputs and functions have not
  • 16.
    Ongoing Management ofProcesses  BPM involves a permanent ongoing organisational commitment to managing the organisations processes  Includes:  Modelling  Analysis  Process design  Performance measurement
  • 17.
    Modelling, Analysis, Designand Measurement of Processes  Practice of BPM requires the measurement and supervision of process performance  Setting process performance goals  Measuring actual performance, the efficiency of the business processes (“doing the thing right“)  Reviewing the effectiveness of business processes (“doing the right thing“)  Providing information, insight and feedback to other primary activities such as process analysis, design and transformation  Gather information at key points in the process to support decisions regarding cost or timing
  • 18.
    Organisational Commitment  Managementof end-to-end business process crosses organisational boundaries  New roles and responsibilities are introduced, such as process owners, designers and architects  Individuals responsible for end-to-end process design must interact with traditional functionally based managers  New governance structures need to be introduced which may change the way organisations make decisions and allocate resources  Practice of BPM requires a significant organisational commitment: without organisational commitment, the practice and benefits of BPM is unlikely to mature within an organisation  • Without supporting leadership, values, beliefs and culture, BPM is unlikely to successfully take hold within an organisation
  • 19.
    BPM Technology  BPMis a technology enabled and supported management discipline  Wide range of technologies available to support the planning, design, analysis, operation and monitoring of business processes  Application suites available which help enable organisations to better manage their business processes  BPM systems must be able to integrate with legacy systems in order to control work and get information or measure performance  Common framework for how these technologies are deployed is most often referred to as a Service Oriented Architecture (SOA)
  • 20.
    Outline  Definitions  Coreconcepts and their descriptions  Components  Lifecycle  Examples  Advanced concepts
  • 21.
    Components  A managementapproach to continuously improve processes and archive organizational objectives through a set of methodologies and technologies  People and processes are a key part
  • 22.
    Input •An input canbe a form, a document, an image, an approval from a person (employee/customer/ manager can trigger an event), data, alert, mail from a person or a system.
  • 23.
    Process Participants From the sameteam project, but also cross-functional
  • 24.
    Process Activities  Types: Value Added - contribute to the process output in a positive way  Handoff - pass control of the process to another department or organisation  Control - assure that the processes behave within desired tolerances or specify a validity checkpoint  Examples:  Planning & strategy  Analysis  Design & modeling  Implementation  Monitoring & controlling  Refinement
  • 25.
    Output •Management dashboard, reports, phones, e-mailalerts from key participants and reviewers •Good outcomes for participants and organization + bring the process to an end
  • 26.
    Outline  Definitions  Coreconcepts and their descriptions  Components  Lifecycle  Examples  Advanced concepts
  • 27.
    BPM Lifecycle (1) •The BPM activities are affected by several factors: leadership, values, culture and beliefs factors
  • 28.
    BPM Lifecycle (2) •Iterative,phased set of activities
  • 29.
    Process Planning andStrategy  Sets the strategy and direction for the BPM process  Plan starts with an understanding of organisational strategies and goals  Provides a foundation for a holistic BPM approach to ensure the alignment with organisational strategy and the integration of strategy, people, processes and systems across functional boundaries  Identifies appropriate BPM organisational roles and responsibilities, executive sponsorship, goals and expected performances measures and methodologies
  • 30.
    Analysis of BusinessProcesses  Takes information from strategic plans, process models, performance measurements, changes in the environment and other factors in order to fully understand the business processes in the context of the overall organisation
  • 31.
    Design and Modellingof Business Processes  Document the sequence of activities, including the design of what work is performed, at what time, in what location, by what process actors using what methodology  Defines what the organisation wants the process to be and answers the what, when, where, who and how questions of how end-to-end work is executed  Ensures that the proper management controls and metrics are in place for compliance and performance measurement
  • 32.
    Process Monitoring andControlling  Continuous measuring and monitoring of business processes provides the information necessary to adjust resources in order to meet process objectives  Measuring and monitoring also provides critical process performance information through key measurements related to goals and value to the organisation  Analysis of process performance information can result in improvement, redesign or reengineering activates
  • 33.
    Process Refinement  Implementsthe output of the iterative analysis and design cycle  Addresses organisational change management challenges  Aimed at continuous improvement and process optimisation
  • 34.
    Outline  Definitions  Coreconcepts and their descriptions  Components  Lifecycle  Examples  Advanced concepts
  • 35.
  • 36.
    Simple vs. Complex:number of steps, number of participants, number of people/systems involved, number of exceptions
  • 37.
    Other examples…  Managementprocesses:  used to measure, monitor and control business activities  ensure that a primary or supporting process meets operational, financial, regulatory and legal goals  Primary (core) processes:  end-to-end, cross-functional processes which directly deliver value  represent the essential activities an organisation performs to fulfill its mission  Support processes:  support primary processes, often by managing resources and/or infrastructure required by primary processes  not directly deliver value (does not mean that they are unimportant to an organisation); e.g. information technology management and human resource management
  • 38.
    Example: Request toIT Department
  • 39.
    Outline  Definitions  Coreconcepts and their descriptions  Components  Lifecycle  Examples  Advanced concepts
  • 40.
    Advanced Concepts 1. ProcessOwnership 2. Process Modelling 3. Process Analysis 4. Process Design 5. Process Performance Measurement 6. Process Transformation 7. Process Implementation 8. Process Quality 9. Process Management Organisation 10. Enterprise Process Management 11. Process Management Technology
  • 41.
  • 42.
    Process Ownership  SuccessfulBPM implementations recognise that the role of a process owner is critical  Process owner is responsible for the entire end-to- end process across functional departments  Success of this role depends on the authority the individual has to control the budget and make decisions that effect the development, maintenance and improvement of the business process
  • 43.
  • 44.
  • 45.
    Process Diagrams, Mapsand Models  Diagrams:  Process diagram often depicts simple notation of the basic workflow of a process  Depicts the major elements of a process flow, but omits the minor details which are not necessary for understanding the overall flow of work  Maps:  More precision than a diagram  More detail about process and important relationships to other elements such as performers (actors), events, results  Provide a comprehensive view of all of the major components of the process  Models:  Represents the performance of what is being modelled  Needs greater precision, data about the process and about the factors that affect its performance  Often done using tools that provide simulation and reporting capability to analyse and understand the process
  • 46.
    Process Attributes andCharacteristics  describe the properties, behaviour, purpose and other elements of the process  are captured in a tool in order to organise, analyse and manage an organisation’s portfolio of processes  examples:  Inputs/Outputs, Events/Results, Value Add, Roles/Organisations, Data/Information, Probabilities, Queuing, Transmission Time, Wait Time, Arrival Patterns/Distributions, Costs (indirect and direct), Entry Rules, Exit Rules, Branching Rules, Join Rules, Work/Handling Time, Batching, Servers (number of people available to perform tasks)
  • 47.
    Purpose of ProcessModelling (1)  A model is rarely a complete and full representation of the actual process  Objective is to create a representation of the process that describes it accurately and sufficiently for the task at hand  Models are simplified representations that facilitate understanding of that which is being studied and making decisions about it
  • 48.
    Purpose of ProcessModelling (2)  Focus on representing those attributes of the process that support continued analysis from one or more perspectives  Understanding the business process through the creation of the model  Creating a visible representation and establishing a commonly shared rerspective  Process models are the primary means for  Measuring performance against standards  Determining opportunities for change  Expressing the desired end state preceding a change effort  Benefits of Modelling:  Models are relatively fast, easy and inexpensive to complete  Models are easy to understand (when compared to other forms of documentation)  Models provide a baseline for measurement  Models facilitate process simulation and impact analysis
  • 49.
    Modelling Standards andNotations  Range of number of modelling and notational standards and Techniques  Models provide a language for describing and communicating as-is and to-be process information  Like all new languages must be learned  Examples:  Business Process Modelling Notation (BPMN)  Flow Charting  Event Process Chain (EPC)  Value Chain  Unified Modelling Language (UML)  IDEF-0 (Integration Definition for Function Modelling)  LOVEM-E (Line of Visibility Engineering Method - Enhanced)  SIPOC (Supplier, Input, Process, Output and Customer)  Systems Dynamics  Value Stream Mapping
  • 50.
    Business Process ModellingNotation (BPMN)  Widely used and supported standard for business process modelling  Provides a graphical notation for specifying business processes in a Business Process Diagram (BPD)  Uses a flowcharting technique similar to activity diagrams from Unified Modelling Language (UML)  Can output BPMN to Business Process Execution Language (BPEL)  Standard executable language for specifying interactions with Web Services  Emerging standard
  • 51.
  • 52.
     BPMN –Events: denote something that happens  Classifications: Catching – triggered by external event or Throwing – generating an output  Types: Start Event - acts as a trigger for the process, End Event - represents the result of a process, Intermediate Event - represents something that happen between the start and end events  BPMN – Activities: describe the kind of work that must be done  Types: Task - represents a single unit of work that is not or cannot be broken down to a further level of business process detail, Sub-Process - used to hide or reveal additional levels of business process detail, Transaction - a form of sub-process in which all contained activities must be treated as a whole  BPMN – Gateway: determines forking and merging of paths depending on the conditions expressed  BPMN – Flow objects are connected to each other using connecting objects.  Types: Sequence Flow - shows in which order the activities will be performed, Message Flow - shows what messages flow across organisational boundaries, Association - associate an Artefact to a Flow Object and can indicate directionality  BPMN - Swim Lanes: visual mechanism of organising and categorising activities, based on cross functional flowcharting  Types: Pool - represents major participants in a process and contains one or more lanes, Lane - used to organise and categorise activities within a pool according to function or role  BPMN – Artefacts: used to bring some more information into the model/diagram  Types: Data Objects - show the data is required or produced in an activity, Group - used to group different activities but does not affect the flow in the diagram, Annotation - used to provide the model/diagram with understandable details
  • 55.
    References  Association ofBusiness Process Management Professionals (ABPMP) Business Process Management Common Body of Knowledge (CBOK)  Alan McSweeney, “Introduction to Business Process Management”, 2010  M. Staron, W. Meding, “Ensuring Reliability of Information Provided by Measurement Systems”, Ericsson  M. Staron, “Software Leadership and Quality Assurance”, Gothenburg University, 2010
  • 56.
  • 57.
    Process Modelling Quality Most process analysis and design efforts require the use of models to describe what is happening during the process  Useful to have some standards and measures of quality as it relates to process modeling  Quality of model defined by its accuracy, amount of detail and completeness
  • 58.
    Requirements of aProcess Model  Business environment  Organisational structure  Business rules  Process structure
  • 59.
    Model Validation andSimulation  Useful or necessary to validate the model through simulation  Validate the model through simulation is to compare simulated outputs to real-world results
  • 60.
    Modelling Perspectives  Processescan be modelled from many perspectives  All perspectives are maintained in a process repository
  • 61.
  • 62.
    Capturing Information forProcess Modelling  Direct Observation  Interviews  Survey/Written Feedback  Structured Workshops  Web-Based Conferencing
  • 63.
    Modelling Participants  Businessstrategists  Business managers  Financial analysts  Auditors  Compliance analysts  Process performance analysts  Requirements analysts  Systems analysts  Business analysts
  • 64.
    Modelling Techniques andTools  White Boarding and Flip Charts  Paper and Post-Its  Drawing Tools and Reports (e.g. Visio, PowerPoint)  Electronic Modelling and Projection:  Repository-based tools allow the reuse of objects or patterns that have already been defined in previous efforts
  • 65.
    Process Simulation  Formof models which provide valuable insight to process dynamics  Simulations require sufficient data which typically allows the process to be mathematically simulated under various scenarios, loads, etc.  Simulations can be manual or electronic using process simulation tools  Various benefits
  • 66.
  • 67.
  • 68.
    Purpose of ProcessAnalysis  Process analysis is an essential tool to show how well the business is meeting its objectives  Due to business change the processes of an organisation can quickly become inconsistent to their original design and no longer meet the needs of the business  Analysis generates an understanding and measurement of process effectiveness and its efficiency  Information generated from analysis includes:  Strategy, culture and environment of the organisation that uses the process (why the process exists)  Inputs and outputs of the process  Stakeholders, both internal and external, including suppliers, customers and their needs and expectations  Inefficiencies within the current process  Scalability of the process to meet customer demands  Business rules that control the process and why they must exist  What performance metrics should monitor the process, who is interested in those metrics and what they mean  What activities make up the process and their dependencies across departments and business functions  Improved resource utilisation  Opportunities to reduce constraints and increase capacity
  • 69.
    When to PerformProcess Analysis  Can be the result of continuous monitoring of processes or can be triggered by specific events, such as:  Strategic Planning  Performance Issues  New Technologies  Startup Venture  Merger/Acquisition  Regulatory Requirements
  • 70.
    Process Analysis Roles Performed by a single individual or by a cross-functional team  Analyst  Decide the depth and scope of the analysis  How it is analysed  Perform the analysis  Provide documentation and final reports to the stakeholders and executive leadership  Facilitator  Lead process analysis teams with an unbiased view  Subject Matter Experts  Individuals closest to the process with knowledge and expertise  Familiar with both the business and technical infrastructure that supports the process
  • 71.
    Preparing the Analysis Choose the process  Determine the scope of the depth of analysis  Choose analytical frameworks
  • 72.
  • 73.
  • 74.
  • 75.
    Process Design Principles(1)  Design around customer interactions  Design around value-adding activities  Minimise/ automate handoffs  Work is performed where it makes the most sense  Provide a single point of contact  Ensure a continuous flow  Reduce batch size: batching causes wait time for items at the end of the batch  Capture information once at the source and share it: eliminate data redundancy  Involve as few as possible  Redesign, then automate  Ensure quality at the beginning
  • 76.
    Process Design Principles(2)  Standardise processes: when there is no standardisation there cannot be process control  Use co-located or networked teams for complex issues  If complex problems occur regularly, consider co-locating team members  If co-location does not make sense, then network the team so information can smoothly flow  Consider outsourcing business processes  Compare to the costs of designing the process in-house as well as compared to the risks associated with outsourcing  Process Compliance  Process Design Considerations
  • 77.
  • 78.
  • 79.
  • 80.
  • 81.
    Key Process PerformanceDefinitions  All processes have a metric or measurement associated with the work or output of the process that is performed  Metrics are based on the following fundamental metric dimensions: time, cost, capacity, quality  When a process is value-added?  When it is required to generate the output required by the customer of the process  When the customer is willing to pay for the process  When it enhances customer experience
  • 82.
  • 83.
  • 84.
    Measurement Methods  Severalcommon measurement methodologies used in BPM implementations  Value Stream Mapping  Activity Based Costing (ABC)  Statistical Methods
  • 85.
  • 86.
  • 87.
    BPM Improvement Methodologies An approach with principles, procedures and practices that provide guidelines for designing and executing the different components within BPM
  • 91.
    Other Methodologies  Lean: originated by Toyota  Focus on reduction of process wastes  TQM (Total Quality Management)  focus on process measurement and controls as a megans of continuous improvement  statistical analysis  Performance Improvement Model  developed in the early 1990s  framework aligns processes at three distinct three levels of performance: organisational, process and job/ performer  Redesign  although it may lead to significant changes, these changes continue to be based on the fundamental concepts of the existing process  Reengineering  Mike Hammer’s 1993 book Reengineering the Corporation  radical change of process
  • 92.
  • 93.
  • 94.
    Activity Specification  Eachimplementation activity specification should include:  Objectives, performance metrics and list of deliverables— all related to delivering improved customer value  Risks for completion and how to be minimised  Accountability for completion  Financial, personnel, any IT support and other resources required  Length of time for completion  Any implementation task cross-functional interdependencies
  • 95.
  • 96.
  • 97.
    Are these allof the same quality? Do they cost the same?
  • 98.
    What is goodquality?  Please list 3 characteristics of a good quality car.
  • 99.
  • 100.
    What is a“good quality” mobile phone?  List 3 characteristics of a good quality phone.  How about the characteristics of a process to make a phone?
  • 101.
    Definition of Quality IEEE (IEEE_Std_610.12-1990) :  the degree to which a system, component, or process meets specified requirements/ customer or user needs or expectations  Fault (according to ISO/CD 10303-226):  “an abnormal condition or defect at the component, equipment, or sub-system level which may lead to a failure”  Failure:  the state or condition of not meeting a desirable or intended objective  Defect:  see fault
  • 102.
    Root Cause Analysis(RCA)  RCA is used to find the root causes of defects – what is the cause of the failure  RCA can be done using a number of methods:  Barrier analysis  Causal factor tree analysis  Change analysis  Failure mode and effects analysis  Fault tree analysis  5 Whys  Ishikawa diagram  Pareto analysis
  • 103.
    5 Whys: Example Problem Statement: You are on your way home from work and your car stops in the middle of the road. 1. Why did your car stop? - Because it ran out of gas. 2. Why did it run out of gas? - Because I didn't buy any gas on my way to work. 3. Why didn't you buy any gas this morning? - Because I didn't have any money. 4. Why didn't you have any money? - Because I lost it all last night in a poker game. 5. Why did you lose your money in last night's poker game? - Because I'm not very good at "bluffing" when I don't have a good hand.
  • 104.
    Ishikawa Diagram: Principles Causes are grouped into categories and linked together (primary and secondary causes)  The list of categories is not definite, the figure shows the “typical” • Relationships are used to backtrack the cause of a particular problem. • The analysis requires more effort than 5 whys but still no statistics is necessary.
  • 105.
  • 106.
    Exercise  Imagine thefollowing situation: You are a quality manager in a software development project in a new version of the Hyunday i30 car. A new version of the software for the ABS (Anti-Block System) brakes has been delivered and it does not work. Please draw the Ishikawa diagram that would help you do Root Cause Analysis.
  • 107.
    Pareto Analysis: Principles Pareto analysis is based on the assumption that 20% of the units contributes with 80% of the effect, e.g.:  20% of the modules contain 80% of errors  80% of failures are caused by 20% of the defects  The basis of Pareto Analysis is Pareto diagram
  • 108.
  • 109.
    Absence of defects= good quality?  What is a quality process?  How would you recognize a quality process in a restaurant?  How about software development?
  • 110.
    Rational Unified Process(RUP) RUP is a quality process… Well defined phases Well defined activites Well defined tasks Well defined deliverables Templates Team support Tool support …
  • 111.
    Team Software Process(TSP)  is a detailed process description for small teams, containing:  details of activities  QA  …  Organizations implementing TSP announced:  productivity improvements of 25% or more  reductions in cost and schedule variance to less than +/- 10%  testing costs and schedule reductions of up to 80%
  • 112.
    Capability Maturity ModelIntegration (CMMI)  CMMI can be used to guide process improvement across a project, a division, or an entire organization  Processes are rated according to their maturity levels  CMMI best practices are published in documents called models, each of which addresses a different area of interest: development, acquisition, services  Capability Maturity Model describes how good an organization is in its processes  Starts from unpredictable and reactive (ad-hoc) processes  Ends with processes focused on the continuous improvement  http://www.sei.cmu.edu/cmmi/
  • 113.
  • 114.
    Key Process Area(KPA)  Each maturity level has some associated KPAs  KPAs are from 4 categories: project management, process management, engineering, support  The relationship is:  Maturity level => KPA  Not vice versa!!! •The assumption is that the more advanced the organization is => the more mature its processes are => the more difficult KPAs it implements
  • 115.
    CMMI’s relationship toquality  Level 1 “expects” the following process areas  Quality assurance (PPQA)  Measurement and analysis  Level 2 “expects” the following process areas  Verification  Validation  Level 3 “expects”  Automation, including automated measurement processes
  • 116.
    PPQA’s main specificgoals related to QA  SG1: Objectively Evaluate Processes and Work Products  SP1.1: Objectively Evaluate processes  SP1.2: Objectively evaluate work products and services  SG2: Provide objective insight  SP2.1: Communicate and Ensure Resolution of Noncompliance issues  SP2.2: Establish records
  • 117.
    Objectivity: Examples  Examplesof measurement data  Estimated/planned vs. actual data on software size, cost, and schedule  Productivity data  Coverage and efficiency of peer reviews  Organization’s measurement program includes  Definition of the organization-wide measurements  Collection of the organization’s measurement data  Analysis of the organization’s measurement data  Quantitative measurement goals for the organization
  • 118.
    CMMI Assessment  Checkingthe CMMI level is done ‘manually’ during an assessment  Has to be done by an accredited auditor  Is supported by methods like SCAMPI (Standard CMMI Appraisal Method for Process Improvement)  Capability vs. maturity – continuous representation vs. staged one
  • 119.
    Practical considerations aboutCMMI  CMMI is a comparison framework and a descriptive maturity level framework  If you want to improve your organization, CMMI does not tell you HOW to do it  CMMI describes areas which the organizations should consider  CMMI level 5 does NOT guarantee that the software will be free of errors  The projects might be on budget, requirements correct, testing correct, but…  … one needs to know the “Garbage in – garbage out” principle  CMMI is very good and well-known, but not the only framework like this  CMMI is very high level  If an organization wants to focus on a specific area, say QM, then CMMI is not very helpful
  • 120.
    Process Management MaturityLevels  There are several Process Management Maturity Models  Process Maturity Models define levels of awareness for business process best practices and automation with some assessing the management of operational processes
  • 121.
    SPICE  SPICE isa major international initiative to support the development of an International Standard for Software Process Assessment • http://www.sqi.gu.edu.au/spice/what.html
  • 122.
    Deming’s PDCA: Plan-Do-Check-Act •Iterative problem solving process used for process improvement
  • 123.
    How to improveprocesses?  Rational Unified Process has its own improvement framework:  http://www-01.ibm.com/software/rational/mcif/  Deming’s PDCA: Plan-Do-Check-Act:  iterative problem solving process
  • 125.
    Measures of SoftwareProcess Quality: Example  Fault-Slip Through:  this measure helps to understand the efficiency of testing in each phase
  • 126.
    Conclusions so-far…  “Thequality of a product is largely determined by the quality of the process that is used to develop and maintain it.” (Shewhart, Juran, Deming and Humphrey), but…  Once the process is of a good quality this does not mean that the product is of a good quality  No product QA -> no quality  Process is not followed -> no quality
  • 127.
    Quality Metrics  Accordingto standard ISO/IEC 15939, measure (i.e. metric) is a  ”variable to which a value is assigned as the result of measurement”  “Categories” of metrics:  Simple  Statistics  Key performance indicators (KPI)  Measurement Systems: set of metrics that present the status and/or progress of a specific area  Can anything/everything be measured?  Can we trust metrics/statistics?
  • 128.
    ISO/IEC 15939 (1) an international standard that defines a measurement process for software development and systems engineering:  ”This international standard identifies the activities and tasks that are necessary to successfully identify, define, select, apply and improve measurement within an overall project or organizational measurement structure.”
  • 129.
  • 130.
  • 131.
    Measurement System: theConceptual Model An optimal measurement information model has to be defined!!!
  • 132.
    Measurement Information Model “is a structure linking information needs to the relevant entities and attributes of concern” – from Annex A (ISO/IEC 15939)  defines measurement constructs which link information needs with attributes of entities
  • 133.
    Ericsson Example (*) (*)A framework for developing measurement systems and its industrial evaluation - Miroslaw Staron , Wilhelm Meding, Christer Nilsson
  • 135.
    Main Benefices ofUsing Measurement Systems  New means of communication: common language, based on an ISO standard  Automation (data collection, analysis, presentation)  Reliability (assured by check-indicators)
  • 136.
    More on: “EnsuringReliability of Information Provided by Measurement Systems” – M. Staron, W. Meding
  • 137.
  • 138.
  • 139.
    Cross Functional Processes– Crossing “Vertical” Operational Organisational Units
  • 140.
    Enterprise Process Management Assures alignment of the portfolio of end-to-end business processes and process architecture with the organisation’s business strategy and resource allocation  Provides a governance model for the management and evaluation of initiatives  Involves the deliberate, collaborative and increasingly technology-aided definition, improvement, innovation and management of end-to-end business processes that drives business agility
  • 141.
  • 142.
  • 143.
    Process Management Technology Increasing use of computer applications to assist with the analysis, design, implementation, execution, management and monitoring of business processes  Business Process Management Systems (BPMS) include a large number of computer applications that continue to evolve as our understanding of business processes matures and requirements for handling complex issues and large volumes of information increase  All studies of successful BPM programs have found that BPM Systems are important and necessary components of any BPM effort  BPM technology can encompass some or all of BPM lifecycle: modelling and design, simulation, implementation - publish designed processes to controlling platform, management and control
  • 144.
  • 145.
    Free BPM Software ADONIS  ARIS Express  BonitaSoft  BizAgi  Intalio  ProcessMaker
  • 146.
  • 147.
    Examples of processesyou can model (1)  Launch Voyager space craft, in order to to extend the exploration of the solar system beyond the furthest point that has ever been reached
  • 148.
    Examples of processesyou can model (2)  Control a smart home
  • 149.
    Examples of processesyou can model (3)  Buy something
  • 150.
    Examples of processesyou can model (4)  Print a 3D object with a bio-printer
  • 151.
    Examples of processesyou can model (5)  Print a 3D object with a bio-printer

Editor's Notes

  • #10 process is a defined set of activities or behaviours performed by humans or machines to achieve one or more goal triggered by specific events and have one or more outcome that may result in the termination of the process or a handoff to another process composed of a collection of interrelated tasks or activities which solve a particular issue
  • #14 • BPM addresses end-to-end work and distinguishes between sets of subprocesses, tasks, activities and functions • BPM requires a significant organisational commitment, often introducing new roles, responsibilities and structures to traditional functionally oriented organisations • BPM is technology enabled with tools for visual modelling, simulation, automation, integration, control and monitoring of business processes and the information systems which support these processes
  • #15 Most large organisations have a significant investment into a number of legacy systems: Designed to support specific functions A BPMS must be able to integrate with legacy systems in order to control work, get information or measure performance Common framework for how these technologies are deployed is most often referred to as a Service Oriented Architecture (SOA)
  • #45 Set of activities involved in creating representations of an existing (as-is) or proposed (to-be) business process • Provides an end-to-end perspective of an organisations primary, supporting and management processes • Modelling is a means to an end and not an end in itself − You model to get results and reach conclusions
  • #50 Flow charting: simple type of diagram that represents a process, showing the steps as boxes of various kinds and their order by connecting these with arrows Swim lanes: an addition to the boxes and arrows process flow view of flow-charting that show how the work flows across organisational units or is handed-off from one role to another Overall process is divided into lanes, with one lane for each person, group or subprocess. Processes and decisions are grouped by placing them in lanes. Event process chain (EPC): an ordered graph of events and functions An EPC provides various connectors that allow alternative and parallel execution of processes EPC method was developed within the framework of ARIS (BPM toolset) Value chain:is used to demonstrate a single continuous flow from left to right of the sub-processes that directly contribute to producing value for the organisation’s customers Chain of activities gives the products more added value than the sum of added values of all activities Unified Modelling Language (UML) activity diagrams IDEF-0: developed by the US Air Force for documenting manufacturing processes; part of the IDEF family of modelling languages in software engineering: IDEF0 produces a function model that is structured representation of the functions, activities or processes IDEF1 produces an information model that represents structure and semantics of information IDEF2 produces a dynamics model that represents time-varying behavioural characteristics LOVEM-E was developed as part of IBM’s Business Process Reengineering Methodology SIPOC - style of process documentation used in Six Sigma Systems Dynamics - approach to understanding the behaviour of complex systems over time; Deals with internal feedback loops and time delays that affect the behaviour of the entire system Systems Dynamics models are “activity on arrow” diagrams rather than “activity on node” diagrams
  • #54 Pentru a ilustra modul în care se aplică BPMN în cadrul unui scenariu de business complet, se va analiza următoarea situaţie: se face o cerere de concediu de către un angajat către superiorul său ierarhic, care aprobă sau nu cererea. Actorii implicaţi în proces sunt angajatul, superiorul ierarhic şi sistemul. Setul de activităţi este definit de: (a) angajatul solicită concediu şi îşi notifică superiorul; (b) superiorul ierarhic procesează cererea, decide dacă o aprobă sau nu şi îl notifică pe angajat; (c) sistemul respinge automat cererea, în cazul în care superiorul nu răspunde în timp de o zi. BPD-ul este creat prin intermediul unui pool cu două lane-uri, unul pentru angajat şi celălalt pentru superiorul ierarhic. Următorul pas este plasarea elementelor BPMN pe BPD: evenimentele de start, atât pentru angajat cât şi pentru superiorul ierarhic, activităţile, evenimentele de stop.
  • #55 Modelarea achiziţionării unui produs Un alt proces este modelat în figura de mai jos. Situaţia este una clasică: clientul doreşte să comande prânzul. Sunt modelate interacţiunile dintre client şi casier, casier şi bucătar, bucătar şi curier. Actorii implicaţi sunt: clientul, casierul, bucătarul şi curierul. Setul de activităţi este definit de: (a) clientul alege prânzul şi comandă, plăteşte şi mănâncă comanda primită; în cazul în care nu primeşte ce a comandat după 60 minute, clientul ii va cere explicaţii casierului; (b) casierul primeşte comanda şi are rolul de a oferi explicaţii clientului dacă acesta le cere; (c) bucătarul pregăteste comanda; (d) curierul livrează prânzul şi primeşte plata. BPD-ul este creat prin intermediul unui lane separat pentru client şi al unui pool cu trei lane-uri pentru casier, bucătar, respectiv curier.
  • #59 The business environment including the customers, suppliers, external events or market pressures that effect or interact with the process The organisational structure which includes the hierarchical or functional view of the organisation and how the people work together (this information helps) The functional or departmental structure of the organisation which explains how the functions or departments work together in the process The business rules which control the decisions that are made during the process and workflow The activities or actions that take place within the process and who does those actions
  • #60 Significant differences should be understood and corrected before the model is used for detailed analysis
  • #61 Enterprise Perspective − See how the enterprise operates overall and that the primary processes are arranged in some category that gives a sense of their interaction − View supports those who must align overall enterprise strategy with aggregated process performance Business Perspective − Supports each of the process owners who is accountable for and has the authority to address overall process performance − Required as the business context that describes each major business process and defines the scope and reach of major transformation efforts Operations Perspective − More detailed models support the perspectives of those managers who are responsible for monitoring performance and look for ways to continuously improve operational performance System Design Perspective − Identifies how work gets done − Describes requirements for systems support and performance in support of tasks and procedures System Build Perspective − Support the individuals who have to build the system Systems Operations Perspective − Support the individuals who have to build all of the support systems to enable work and to operate the systems that are required to continue to perform that work
  • #62 Bottom-up approaches, centered on very detailed activity and task oriented work flows, work best for projects aimed at improving narrowly focused functions within a single department or operation Top-down methods work well for projects aimed at improving and innovating large scale, end-to-end, cross-functional business processes Develop a new business model first and then determine what needs to be done to be capable of its implementation Approach used varies depending on the purpose and the scope of the effort
  • #63 Direct Observation Can be effective in identifying variations and deviations that occur in day-to-day work However limited to a relatively small sample size Direct observation also entails the risk of the performers doing what they think you want to see rather than what they normally do (Hawthorne effect) Interviews Can create a sense of ownership and participation in the process of modelling and documenting business processes Requires follow up Survey/Written Feedback Time spent reconciling differences of opinion Where the same work has just been described differently by different people, it may require follow up Structured Workshops may be more costly than other methods require less follow up and generate a commonly agreed upon description of a process faster and with higher quality than other techniques Web-Based Conferencing Gain similar benefits to face-to-face workshops, but work best with smaller groups
  • #65 Paper and Post-Its: Have workshop participants put removable sticky-notes on the paper until they have arranged the activities into the sequence on which they agree
  • #66 Benefits: Validate a model by demonstrating that real transaction sets, when run through the model exhibit, produce the same performance characteristics as those in the actual process Predict the process design’s performance under differing scenarios (vary the number of transactions over time, the number of workers, etc.) Determine which variables have the greatest affect on process performance Compare performance of different process designs under the same sets of circumstances
  • #68 Process analysis is the first step in establishing a new process or updating an existing process, in creating a common understanding of the current state of the process and its alignment with the business objectives Accomplished through various techniques including mapping, interviewing, simulations and various other analytical techniques and methodologies May include a study of the business environment and factors that contribute to or interact with the environment such as government or industry regulations, market pressures and competition Unbiased view without placing blame for existing inefficiencies: Should represent what is actually happening and not what is thought or wished to be happening Factors to be considered: - The context of the business − Business strategy − Supply chain (the inputs and outputs of the process), − Customer needs − Organisational culture − Business values − How the process will perform to achieve business goals
  • #69 Without it, decisions are made based on opinion or intuition rather than documented, validated facts Creates an understanding of how work (the transformation of inputs to outputs) happens in the organisation Effectiveness Meets the needs of the customer • Satisfies the objectives of the business • Is the right process for the current business environment or context Efficiency indicates the degree of resources utilised in performing the activities of the process
  • #70 Benefits of continuous analysis: real-time feedback Strategic Planning: Regular review and update of strategic plans Survey the market and competitive landscape for new opportunities and establish new goals Startup Venture When new ventures or businesses are anticipated need to identify the processes that will be required to successfully deliver the new products and services
  • #71 Communicate to the team their responsibilities according to the role that each will play in the process Have a thorough understanding of the expectations of each member
  • #72 Identify critical business goals Identify processes supporting those goals Process performance metrics
  • #73 Understanding the Unknown: generate data to ensure that any conclusions are based on facts extrapolated from the data Organisational Culture/Context Will individuals voluntarily leave the company as a result of the process change? If so, how will this disrupt the process? If the success of a process has been measured on quantity as opposed to quality, what will happen if the measurement is shifted to quality? Performance Metrics Performance issues can be defined as gaps between how a process is currently performing in relation to how it should be performing. identification of actionable and auditable metrics: Does the process take too long and if so, why and what is the measurement of “too long”? Customer Interactions The fewer the number of required interactions between the customer and a given service, the more satisfied the customer. How many times does a customer interact with the process? Is it too many? Are there redundancies in the interactions? Handoffs Any point in a process where work or information passes from one system, person or group to another is a handoff for that process. Typically, the fewer number of handoffs, the more successful the process. Business Rules create constraints that impact the nature and performance of the process Capacity Analysing the capacity of the process tests upper and lower limits If the process speeds up can the consumer of the process handle the increase in production? Bottlenecks is a constraint in the process that creates a backlog of work to be done Is it the bottleneck the result of handoffs or lack of information? Is the bottleneck the result of a resource constraint and what type of resource? Variation Variation in the process may not be good. Variation slows down the process and requires more resources to properly scale. Can automation help eliminate variation? Cost Understanding the cost of the process helps the team understand the value of the process in real money to the organisation Can the cost be reduced through automation or technology improvements? If so, how and by what extent? SWOT (Strengths, Weaknesses, Opportunities and Threats) Analysis
  • #75 Creation of specifications for new and modified business processes Should include both: − Logical design - what activities are performed − Physical design - how the activities are performed Defining Activities within the New Process: Keep the process as simple as possible − Order fulfillment process • Entering the order • Packing the order • Shipping the order • Billing for the order New process should also be compared to the existing state
  • #76 Not every design principle applies to every process. Always use common sense when applying them. Person can see his or her major contribution to the whole – can increases the desire to produce a quality product or service
  • #77 Process Design Considerations Direct involvement and leadership of the executive team Process Ownership Incentive and Rewards Encourage the adoption of the new process and changed roles and behaviours Cross-Functional Teams Continuous Improvement Alignment with Strategy
  • #79 If you cannot measure it, you cannot manage it
  • #81 Not everyone has the complete picture of what is happening
  • #82 Time - is a measurement of process duration Cost - is a measurement of the monetary value associated with a process Resource Cost, Opportunity Cost - It is the value that is lost from the process by not getting the resultant output of the process Capacity - this is an amount or volume of a feasible output associated with a process Quality - is usually expressed as a percentage of actual to optimal or maximum in process terms Customer satisfaction, Error or Defect Rate
  • #83 Used for Monitoring and Controlling Operations Alignment of Business Process and Enterprise Performance
  • #85 Value stream is simply all the things done to create value for the customer Value Stream Mapping Planning tool used to visualise the value stream of a process, department or organisation There are Value Adding Activity, Non-Value Adding Activity, Necessary Non-Value Adding Activity Seven types of waste in a process: Defects - Repair and rework Motion - Any time wasted to gather resources such as documents or requirements in multiple systems Overproduction Transportation -Wasted time to more resources between processes Inventory - Maintaining excess output Processing - Doing more work than is necessary Waiting - Any non-work time waiting for approval, resources,information, queueing time Activity Based Costing An accounting methodology that assigns costs to activities rather than products or services It provides data about how costs are actually consumed in a process
  • #87 Planned evolution of a business process using a clearly defined methodology and disciplined approach to ensure that the business process continues to meet business objectives Business processes are affected by many factors both in and out of the organisation’s control Process transformation is enabled by Business Process Management principles and governances adopted by the organisation Depending on the process maturity level of the organisation, it will adopt various methods to monitor and respond to these factors in the appropriate manner
  • #89 Improves the quality of process outputs by identifying and removing errors Originated in Motorola in the mid-1980’s
  • #90 1987-> Quality Management Systems and Standards, continuously improve processes to meet customers & auditors reqs
  • #92 Seven rules or principles of reengineering Organise around outcomes not tasks Have those who use the output of the process perform the process Merge information - processing work into the real work that produces the information - People collecting the work should be responsible for processing the work instead of handing over to some other individual or system Treat geographically dispersed resources as though they were centralised Link parallel activities instead of integration their results Put the decision point where the work is performed and build control into the process - empowers the performer of the work Capture information once - at the source
  • #94 Process Implementation is different from Process Management Implementation Business Process Implementation is transforming an approved business process design into operational enterprise (or lesser scope) processes and revised BPM policies and procedures that are accepted by the appropriately trained stakeholders
  • #96 Typically the most challenging aspect to a Business Process Implementation is reinforcing and finalising business process performer and process owner buy-in or acceptance of the changes Major challenge within a BPM project is motivating relevant BPM participants to adopt new behaviours
  • #119 http://www.royj.net/cms/node/3
  • #121 There are several Process Management Maturity Models
  • #140 Management of a company’s core business processes is likely to involve a new, horizontal dimension to the organisation structure Organizational chart
  • #141 Requires a shift in the traditional functional mindset which dominates management thinking in many organisations and the so-called “silo effect” in which each functional unit is only concerned with its processes and coordination is lacking
  • #144 Experience shows that the application of technology is effective when the complexity of the process or the amount of information to be processed is too great to manage with manual methods When there are members of geographically disperse work groups