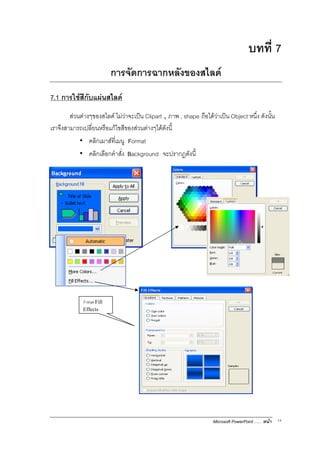
การจัดการฉากหลังของสไลด์
•
0 likes•285 views

คู่มือการใช้ MS Power Point 2003 การจัดการฉากหลังของสไลด์ เรียบเรียงโดย : ณัฐพร น้ำใจดี ที่มา : ศูนย์เทคโนโลศูนย์เทคโนโลยีสารสนเทศและการสื่อสาร สำนักงานปลัดกระทรวงสาธารณสุข
Report
Share
Report
Share
Download to read offline

Recommended
Morphological Image Processing
This document discusses morphological image processing using mathematical morphology. It begins with an introduction to morphology in biology and its application to image analysis using set theory. The key concepts of dilation, erosion, opening and closing are explained. Dilation expands object boundaries while erosion shrinks them. Opening performs erosion followed by dilation to smooth contours, and closing performs dilation followed by erosion to fill small holes. Structuring elements determine the shape and size of operations. Morphological operations are useful for tasks like boundary extraction, noise removal, and feature detection.
Assignment3
This document describes Assignment 3 for the CS193P class, which involves enhancing an MVC application that displays polygons. Students will create a custom view to draw the polygon shape based on a model class. They will also add functionality to save and restore the number of polygon sides using user defaults. The assignment tests that the application draws polygons correctly, updates dynamically, and preserves state as expected. Hints provide code to calculate polygon points given parameters.
Admission for b.tech
This document discusses how to find the composite of two functions and the resulting domain. It defines the composite function f o g(x) as the successive application of functions f and g, with f(g(x)). The domain of the composite function is the set of elements x in the domain of g where g(x) is in the domain of f, meaning the range of g must be within the domain of f. Several examples are provided of evaluating composite functions and finding their domains. Classwork and homework assignments are also listed.
Julia Set
Julia set is the boundary between points in the complex number plane or the Riemann sphere (the complex number plane plus the point at infinity) that diverge to infinity and those that remain finite under repeated iteration of some mapping (function).
Project2
The document describes a project involving image processing and boundary analysis. It includes:
1. Smoothing an image, thresholding it to binary, extracting the outer boundary, subsampling the boundary, and computing the Freeman chain code and descriptors of the subsampled boundary.
2. Extracting the boundary of an image of a chromosome, computing the Fourier descriptors of the boundary, and reconstructing the boundary using different percentages of the descriptors.
3. The provided code computes Freeman chain codes, Fourier descriptors, and performs other boundary analysis tasks like subsampling and reconstruction from descriptors.
C Graphics Functions
This document provides information about graphics functions in C. It begins by explaining graphics modes and how images are displayed on screens using pixels. It then provides details on the initgraph() function which initializes the graphics system. The rest of the document summarizes many common graphics functions like line(), rectangle(), circle(), putpixel(), getpixel() and more, explaining what they do and their parameters.
Graphics Programming in C
This document provides an overview of graphics programming in C using Turbo C++. It outlines the course content which includes drawing points, lines, polygons, circles and filling areas. It also discusses geometric transformations in 2D and 3D as well as line clipping algorithms. It provides details on setting up the integrated development environment and creating a graphics header file to initialize and exit graphics mode. It includes code examples to display a single point on the screen by approximating pixel coordinates as integers.
Introduction to graphics programming in c
This document provides an introduction to graphics programming in C. It discusses setting up graphics using GCC, basic concepts of graphics programming in C, common graphics functions like line(), circle(), rectangle(), and text functions like outtext() and outtextxy(). It also includes a short example program to demonstrate drawing various shapes and text.
Programming Assignment Help
I am Gill H. I am a Programming Assignment Expert at programminghomeworkhelp.com. I hold a Ph.D. in Electronics Engineering from, the University of Texas, USA. I have been helping students with their homework for the past 8 years. I solve assignments related to Programming.
Visit programminghomeworkhelp.com or email support@programminghomeworkhelp.com. You can also call on +1 678 648 4277 for any assistance with Programming Assignments.
Basics of Computer graphics lab
This document provides instructions for drawing basic shapes in graphics mode in Turbo C++. It explains how to enable the graphics library, initialize graphics mode, and use functions like putpixel, line, rectangle, circle, ellipse, arc, bar and bar3d to draw pixels, lines, rectangles, circles, ellipses, arcs, filled rectangles and 3D filled rectangles. Examples of code are given to draw each shape. Programming assignments are provided to combine the shapes to draw a flag, hut, smiley face and fish.
Computer graphics
The document provides an algorithm and sample program to implement Bresenham's circle drawing algorithm in C.
The algorithm reads the radius of the circle, initializes the starting points and decision variable, and then uses a do-while loop to plot pixels on the circle by incrementing x and conditionally incrementing or decrementing y based on the decision variable.
The sample program includes code to read the radius, initialize graphics mode, set starting points, and implement the do-while loop to plot pixels and delay between each pixel for visualization. It plots all four quadrants of the circle.
Cgm Lab Manual
The document is a lab manual for a course on Computer Graphics and Multimedia. It contains:
1. A table of contents listing various sections like the time table, university scheme, syllabus, list of books, and list of programs.
2. The time table, university scheme, and syllabus provide details about the course schedule, assessment scheme, and topics to be covered.
3. The list of books and list of programs provide resources for students to refer to for the course and experiments to be performed in the lab.
Algebra 2 Notes 2-6
To add or subtract complex numbers, combine the real parts and combine the imaginary parts separately. For example, to add (2 + 3i) and (1 - 6i), the real parts (2 and 1) are added to give 3, and the imaginary parts (3i and -6i) are added to give -3i, so the sum is 3 - 3i. Complex numbers can also be represented as vectors in a complex plane, where the real part is the horizontal component and imaginary part is the vertical component, allowing geometric addition and subtraction of complex numbers as vector additions and subtractions.
Matlab Graphics Tutorial
This is the slides of the UCLA School of Engineering Matlab workshop on Matlab graphics.
Learning Matlab graphics by examples:
- In 2 hours, you will be able to create publication-quality plots.
- Starts from the basic 2D line plots to more advanced 3D plots.
- You will also learn some advanced topics like fine-tuning the appearance of your figure and the concept of handles.
- You will be able to create amazing animations: we use 2D wave equation and Lorentz attractor as examples.
Computer Graphics Practical
The document discusses computer graphics and provides examples of its applications. It discusses graphics inbuilt functions such as arc(), initgraph(), closegraph(), and line(). It provides code snippets and explanations for these functions. It also lists algorithms for direct and Bresenham lines, circles, ellipses, and their code programs. Finally, it mentions static and dynamic applications of computer graphics.
Computer graphics
This document contains information about computer graphics including:
1. An introduction to computer graphics, its applications, and basic functions like drawing lines, circles, rectangles.
2. Details of 4 assignments - the first involves studying graphics functions, the second develops a CPU architecture GUI, the third defines a point class, and the fourth defines line and circle drawing classes.
3. The last assignment involves writing C++ classes to draw lines using DDA and Bresenham's algorithms and inheriting from the point class, and a circle class inheriting from the line class.
Graph Plots in Matlab
This document discusses various plotting tools in Matlab, including:
- The plot and stem functions for plotting data values against their index or specified x-values.
- Tools for labeling axes, titles, legends, and setting axis properties.
- The subplot function for dividing the figure window into multiple plots.
- Functions for turning the grid on/off and holding plots.
- Examples of simple 2D and 3D function plots.
Lec 9 05_sept [compatibility mode]
The document discusses various math and string classes in Java. It covers:
- Constructing objects using the new operator and passing parameters.
- Using the Random class to generate random numbers.
- Declaring constants using final and static final.
- Basic arithmetic, increment/decrement, and math methods.
- Creating and manipulating strings using methods like length(), substring(), and concatenation.
- Drawing shapes on a frame using Graphics2D methods in a JComponent's paintComponent method.
Matlab Feature Extraction Using Segmentation And Edge Detection
This document discusses several image processing techniques in Matlab:
1) Edge detection using the edge function and Sobel and Canny edge detection algorithms.
2) The radon transform which computes projections of an image along specified directions and the inverse radon transform used to reconstruct images from projections.
3) Marker-controlled watershed segmentation which separates touching objects in an image using morphological operations like gradients and markers.
Computer graphics practical(jainam)
This file contains all the practicals with output regarding GTU syllabus. so it will help to IT and Computer engineering students. It is really knowledgeable so refer these for computer graphics practicals.
Graphics in C++
In this slides describe the use of C++ Graphics and basic graphics function are describe in this slides.
Advanced Concepts in Python
The document discusses advanced concepts in Python programming including scientific programming, graphics programming, network programming, GUI programming, and web programming. Scientific programming uses NumPy to work with multi-dimensional arrays and mathematical functions. Graphics programming draws shapes like circles using a graphics library. Network programming demonstrates a simple client-server program using sockets to send and receive data. GUI programming creates a button that displays a popup message when clicked. Web programming shows a simple form and CGI script to submit and display user input from the form.
Cgm Lab Manual
This document is a lab manual for a Computer Graphics and Multimedia course. It includes:
- An introduction and contact information for the instructor.
- A table of contents listing various sections such as the course timetable, syllabus, list of programs to be completed, and important exam questions.
- Details of the course syllabus which covers topics like raster graphics, 2D and 3D transformations, color models, multimedia systems, compression techniques and more.
- A list of 11 programming experiments related to computer graphics algorithms and multimedia, including DDA line drawing, Bresenham's circle algorithm, transformations and compression.
- Descriptions and code for the first 3 experiments - DDA line
C graphics programs file
The document contains programs for computer graphics concepts like drawing lines, circles, ellipses and implementing transformations using C programming language. It includes 27 programs - programs to draw lines using different algorithms, programs to draw circles using midpoint, polynomial and Bresenham's algorithm, programs to draw ellipses using different methods and programs to implement 2D transformations like translation, rotation, scaling, reflection, shearing on graphics objects. The programs take input coordinates, draw the graphics primitives and implement the transformations.
Image processing
This document provides an introduction and overview of image processing using Matlab. It discusses the basics of Matlab including its environment, syntax, variables, vectors and matrices. It then covers image processing topics such as importing and exporting images, viewing histograms, and applying filters like box filters and linear filters to images. The document is intended to teach the fundamentals of working with images in the Matlab programming language.
MLconf NYC Edo Liberty
This document discusses streaming data mining. It begins by explaining the difference between single machine and distributed data mining. It then introduces the streaming model for distributed data mining where data and computation are distributed across multiple machines in parallel. The document provides examples of algorithms for mining frequent items in data streams and maintaining approximate distributions. It also discusses using the streaming model for threading machine generated emails and mentions other types of mining that can be done in the streaming model like dimensionality reduction and clustering.
اضافة الخريطة
The document contains code to retrieve an image file name from a database table, concatenate the file extension, and load the image into a PictureBox control. It retrieves the file name from the first row and column of a DataTable, appends the ".png" extension, and loads the image from either a "flags" or "maps" folder using the PictureBox's Image property and the Image.FromFile method.
Rethinking metrics: metrics 2.0 @ Lisa 2014
As the amount of metrics, software that produce and process them, and people involved in them continue to increase, we need better ways to organize them, to make them self-describing, and do so in a way that is consistent. Leveraging this, we can then automatically build graphs and dashboards, given a query that represents an information need, even for complicated cases. We can build richer visualizations, alerting and fault detection. This talk will introduce the concepts and related tools, demonstrate possibilities using the Graph-Explorer interface, and lay the groundwork for future work.
Netspend1
We are here to help you in any way we can. Whether you need assistance with a project, have a question, or just want someone to listen, our team is ready to assist. Please let us know how we can support your needs.
Sesion 4 interpretacion metacognitiva
Este documento discute nuevos métodos para enseñar historia que motivan más a los estudiantes. Ahora, la enseñanza de la historia usa recursos como investigación en internet y entrevistas, en lugar de sólo libros de texto. Esto hace que el aprendizaje sea más interesante para los estudiantes. El uso de computadoras e internet en las escuelas también ayuda a los maestros a enseñar historia de manera más interactiva. Trabajar en equipo y visitar sitios históricos también motivan a los estudiantes a aprender
More Related Content
What's hot
Programming Assignment Help
I am Gill H. I am a Programming Assignment Expert at programminghomeworkhelp.com. I hold a Ph.D. in Electronics Engineering from, the University of Texas, USA. I have been helping students with their homework for the past 8 years. I solve assignments related to Programming.
Visit programminghomeworkhelp.com or email support@programminghomeworkhelp.com. You can also call on +1 678 648 4277 for any assistance with Programming Assignments.
Basics of Computer graphics lab
This document provides instructions for drawing basic shapes in graphics mode in Turbo C++. It explains how to enable the graphics library, initialize graphics mode, and use functions like putpixel, line, rectangle, circle, ellipse, arc, bar and bar3d to draw pixels, lines, rectangles, circles, ellipses, arcs, filled rectangles and 3D filled rectangles. Examples of code are given to draw each shape. Programming assignments are provided to combine the shapes to draw a flag, hut, smiley face and fish.
Computer graphics
The document provides an algorithm and sample program to implement Bresenham's circle drawing algorithm in C.
The algorithm reads the radius of the circle, initializes the starting points and decision variable, and then uses a do-while loop to plot pixels on the circle by incrementing x and conditionally incrementing or decrementing y based on the decision variable.
The sample program includes code to read the radius, initialize graphics mode, set starting points, and implement the do-while loop to plot pixels and delay between each pixel for visualization. It plots all four quadrants of the circle.
Cgm Lab Manual
The document is a lab manual for a course on Computer Graphics and Multimedia. It contains:
1. A table of contents listing various sections like the time table, university scheme, syllabus, list of books, and list of programs.
2. The time table, university scheme, and syllabus provide details about the course schedule, assessment scheme, and topics to be covered.
3. The list of books and list of programs provide resources for students to refer to for the course and experiments to be performed in the lab.
Algebra 2 Notes 2-6
To add or subtract complex numbers, combine the real parts and combine the imaginary parts separately. For example, to add (2 + 3i) and (1 - 6i), the real parts (2 and 1) are added to give 3, and the imaginary parts (3i and -6i) are added to give -3i, so the sum is 3 - 3i. Complex numbers can also be represented as vectors in a complex plane, where the real part is the horizontal component and imaginary part is the vertical component, allowing geometric addition and subtraction of complex numbers as vector additions and subtractions.
Matlab Graphics Tutorial
This is the slides of the UCLA School of Engineering Matlab workshop on Matlab graphics.
Learning Matlab graphics by examples:
- In 2 hours, you will be able to create publication-quality plots.
- Starts from the basic 2D line plots to more advanced 3D plots.
- You will also learn some advanced topics like fine-tuning the appearance of your figure and the concept of handles.
- You will be able to create amazing animations: we use 2D wave equation and Lorentz attractor as examples.
Computer Graphics Practical
The document discusses computer graphics and provides examples of its applications. It discusses graphics inbuilt functions such as arc(), initgraph(), closegraph(), and line(). It provides code snippets and explanations for these functions. It also lists algorithms for direct and Bresenham lines, circles, ellipses, and their code programs. Finally, it mentions static and dynamic applications of computer graphics.
Computer graphics
This document contains information about computer graphics including:
1. An introduction to computer graphics, its applications, and basic functions like drawing lines, circles, rectangles.
2. Details of 4 assignments - the first involves studying graphics functions, the second develops a CPU architecture GUI, the third defines a point class, and the fourth defines line and circle drawing classes.
3. The last assignment involves writing C++ classes to draw lines using DDA and Bresenham's algorithms and inheriting from the point class, and a circle class inheriting from the line class.
Graph Plots in Matlab
This document discusses various plotting tools in Matlab, including:
- The plot and stem functions for plotting data values against their index or specified x-values.
- Tools for labeling axes, titles, legends, and setting axis properties.
- The subplot function for dividing the figure window into multiple plots.
- Functions for turning the grid on/off and holding plots.
- Examples of simple 2D and 3D function plots.
Lec 9 05_sept [compatibility mode]
The document discusses various math and string classes in Java. It covers:
- Constructing objects using the new operator and passing parameters.
- Using the Random class to generate random numbers.
- Declaring constants using final and static final.
- Basic arithmetic, increment/decrement, and math methods.
- Creating and manipulating strings using methods like length(), substring(), and concatenation.
- Drawing shapes on a frame using Graphics2D methods in a JComponent's paintComponent method.
Matlab Feature Extraction Using Segmentation And Edge Detection
This document discusses several image processing techniques in Matlab:
1) Edge detection using the edge function and Sobel and Canny edge detection algorithms.
2) The radon transform which computes projections of an image along specified directions and the inverse radon transform used to reconstruct images from projections.
3) Marker-controlled watershed segmentation which separates touching objects in an image using morphological operations like gradients and markers.
Computer graphics practical(jainam)
This file contains all the practicals with output regarding GTU syllabus. so it will help to IT and Computer engineering students. It is really knowledgeable so refer these for computer graphics practicals.
Graphics in C++
In this slides describe the use of C++ Graphics and basic graphics function are describe in this slides.
Advanced Concepts in Python
The document discusses advanced concepts in Python programming including scientific programming, graphics programming, network programming, GUI programming, and web programming. Scientific programming uses NumPy to work with multi-dimensional arrays and mathematical functions. Graphics programming draws shapes like circles using a graphics library. Network programming demonstrates a simple client-server program using sockets to send and receive data. GUI programming creates a button that displays a popup message when clicked. Web programming shows a simple form and CGI script to submit and display user input from the form.
Cgm Lab Manual
This document is a lab manual for a Computer Graphics and Multimedia course. It includes:
- An introduction and contact information for the instructor.
- A table of contents listing various sections such as the course timetable, syllabus, list of programs to be completed, and important exam questions.
- Details of the course syllabus which covers topics like raster graphics, 2D and 3D transformations, color models, multimedia systems, compression techniques and more.
- A list of 11 programming experiments related to computer graphics algorithms and multimedia, including DDA line drawing, Bresenham's circle algorithm, transformations and compression.
- Descriptions and code for the first 3 experiments - DDA line
C graphics programs file
The document contains programs for computer graphics concepts like drawing lines, circles, ellipses and implementing transformations using C programming language. It includes 27 programs - programs to draw lines using different algorithms, programs to draw circles using midpoint, polynomial and Bresenham's algorithm, programs to draw ellipses using different methods and programs to implement 2D transformations like translation, rotation, scaling, reflection, shearing on graphics objects. The programs take input coordinates, draw the graphics primitives and implement the transformations.
Image processing
This document provides an introduction and overview of image processing using Matlab. It discusses the basics of Matlab including its environment, syntax, variables, vectors and matrices. It then covers image processing topics such as importing and exporting images, viewing histograms, and applying filters like box filters and linear filters to images. The document is intended to teach the fundamentals of working with images in the Matlab programming language.
MLconf NYC Edo Liberty
This document discusses streaming data mining. It begins by explaining the difference between single machine and distributed data mining. It then introduces the streaming model for distributed data mining where data and computation are distributed across multiple machines in parallel. The document provides examples of algorithms for mining frequent items in data streams and maintaining approximate distributions. It also discusses using the streaming model for threading machine generated emails and mentions other types of mining that can be done in the streaming model like dimensionality reduction and clustering.
اضافة الخريطة
The document contains code to retrieve an image file name from a database table, concatenate the file extension, and load the image into a PictureBox control. It retrieves the file name from the first row and column of a DataTable, appends the ".png" extension, and loads the image from either a "flags" or "maps" folder using the PictureBox's Image property and the Image.FromFile method.
Rethinking metrics: metrics 2.0 @ Lisa 2014
As the amount of metrics, software that produce and process them, and people involved in them continue to increase, we need better ways to organize them, to make them self-describing, and do so in a way that is consistent. Leveraging this, we can then automatically build graphs and dashboards, given a query that represents an information need, even for complicated cases. We can build richer visualizations, alerting and fault detection. This talk will introduce the concepts and related tools, demonstrate possibilities using the Graph-Explorer interface, and lay the groundwork for future work.
What's hot (20)
Matlab Feature Extraction Using Segmentation And Edge Detection
Matlab Feature Extraction Using Segmentation And Edge Detection
Viewers also liked
Netspend1
We are here to help you in any way we can. Whether you need assistance with a project, have a question, or just want someone to listen, our team is ready to assist. Please let us know how we can support your needs.
Sesion 4 interpretacion metacognitiva
Este documento discute nuevos métodos para enseñar historia que motivan más a los estudiantes. Ahora, la enseñanza de la historia usa recursos como investigación en internet y entrevistas, en lugar de sólo libros de texto. Esto hace que el aprendizaje sea más interesante para los estudiantes. El uso de computadoras e internet en las escuelas también ayuda a los maestros a enseñar historia de manera más interactiva. Trabajar en equipo y visitar sitios históricos también motivan a los estudiantes a aprender
Diego casignia 7 c examen
Este documento presenta el reporte de calificaciones del primer quimestre del año lectivo 2010-2011 para Diego Casignia en la Unidad Educativa Municipal Experimental del Milenio "Bicentenario". Diego obtuvo las calificaciones más altas en Computación e Inglés y promedios superiores a 15 en la mayoría de las asignaturas.
A filosofia da natureza
O documento apresenta várias citações de filósofos e pensadores sobre a natureza. As citações destacam que a natureza nunca engana o homem, que existe beleza e maravilha na natureza, e que o homem deve viver de acordo com as leis da natureza.
IBMs view of an Entrepreneur ecosystem
A simple, printable illustrated story on IBM's entrepreneur initiative.
El jardín de lo simple
El documento argumenta que la sociedad se ha alejado de los valores espirituales y morales, promoviendo en cambio la mentira, el desamor y la violencia a través de los medios masivos. Propone que para mejorar el mundo y avanzar hacia sociedades más justas, es necesario reafirmar principios y valores como el temor a Dios, y buscar orientación en el Creador.
Presentación
Este documento proporciona información sobre un maestro, la escuela a la que pertenece, su clave, el grado y grupo que enseña, el director de la escuela y la clave presupuestal de la escuela.
Viewers also liked (20)
More from PomPam Comsci
พระราชบัญญัติว่าด้วยการกระทำความผิดเกี่ยวกับคอมพิวเตอร์ พ.ศ.2550 (ฉบับการ์ตูน) 2
พระราชบัญญัติว่าด้วยการกระทำความผิดเกี่ยวกับคอมพิวเตอร์ พ.ศ.2550 (ฉบับการ์ตูน) 2
ผู้ประกาศ : สำนักงานปลัดกระทรวง
กระทรวงเทคโนโลียีสารสนเทศและการสื่อสาร
พระราชบัญญัติว่าด้วยการกระทำความผิดเกี่ยวกับคอมพิวเตอร์ พ.ศ.2550 (ฉบับการ์ตูน)1
พระราชบัญญัติว่าด้วยการกระทำความผิดเกี่ยวกับคอมพิวเตอร์ พ.ศ.2550 (ฉบับการ์ตูน)1
ผู้ประกาศ : สำนักงานปลัดกระทรวง
กระทรวงเทคโนโลยีสารสนเทศและการสื่อสาร
การสร้างลำดับผังงาน
คู่มือการใช้ MS Power Point 2003
การสร้างลำดับผังงาน
เรียบเรียงโดย : ณัฐพร น้ำใจดี
ที่มา : ศูนย์เทคโนโลศูนย์เทคโนโลยีสารสนเทศและการสื่อสาร สำนักงานปลัดกระทรวงสาธารณสุข
การสร้าง Diagram Gallery
คู่มือการใช้ MS Power Point 2003
การสร้าง Diagram Gallery
เรียบเรียงโดย : ณัฐพร น้ำใจดี
ที่มา : ศูนย์เทคโนโลศูนย์เทคโนโลยีสารสนเทศและการสื่อสาร สำนักงานปลัดกระทรวงสาธารณสุข
การเชื่อมโยงหลายมิติและ URL
คู่มือการใช้ MS Power Point 2003
การเชื่อมโยงหลายมิติและ URL
เรียบเรียงโดย : ณัฐพร น้ำใจดี
ที่มา : ศูนย์เทคโนโลศูนย์เทคโนโลยีสารสนเทศและการสื่อสาร สำนักงานปลัดกระทรวงสาธารณสุข
การสร้างกราฟ
คู่มือการใช้ MS Power Point 2003
การสร้างกราฟ
เรียบเรียงโดย : ณัฐพร น้ำใจดี
ที่มา : ศูนย์เทคโนโลศูนย์เทคโนโลยีสารสนเทศและการสื่อสาร สำนักงานปลัดกระทรวงสาธารณสุข
การสร้าง Organization Chart
คู่มือการใช้ MS Power Point 2003
การสร้าง Organization Chart
เรียบเรียงโดย : ณัฐพร น้ำใจดี
ที่มา : ศูนย์เทคโนโลศูนย์เทคโนโลยีสารสนเทศและการสื่อสาร สำนักงานปลัดกระทรวงสาธารณสุข
การใช้ Text , Object
คู่มือการใช้ MS Power Point 2003
การใช้ Text , Object
เรียบเรียงโดย : ณัฐพร น้ำใจดี
ที่มา : ศูนย์เทคโนโลศูนย์เทคโนโลยีสารสนเทศและการสื่อสาร สำนักงานปลัดกระทรวงสาธารณสุข
การใช้เทคนิคกับแผ่นสไลด์
คู่มือการใช้ MS Power Point 2003
การใช้เทคนิคกับแผ่นสไลด์
เรียบเรียงโดย : ณัฐพร น้ำใจดี
ที่มา : ศูนย์เทคโนโลศูนย์เทคโนโลยีสารสนเทศและการสื่อสาร สำนักงานปลัดกระทรวงสาธารณสุข
การจัดทำสไลด์ต้นแบบ ( Master)
คู่มือการใช้ MS Power Point 2003
การจัดทำสไลด์ต้นแบบ ( Master)
เรียบเรียงโดย : ณัฐพร น้ำใจดี
ที่มา : ศูนย์เทคโนโลศูนย์เทคโนโลยีสารสนเทศและการสื่อสาร สำนักงานปลัดกระทรวงสาธารณสุข
การสั่งพิมพ์และตั้งค่าแผ่นสไลด์
คู่มือการใช้ MS Power Point 2003
การสั่งพิมพ์และตั้งค่าแผ่นสไลด์
เรียบเรียงโดย : ณัฐพร น้ำใจดี
ที่มา : ศูนย์เทคโนโลศูนย์เทคโนโลยีสารสนเทศและการสื่อสาร สำนักงานปลัดกระทรวงสาธารณสุข
การกำหนด Header / Footer
คู่มือการใช้ MS Power Point 2003
การกำหนด Header / Footer
เรียบเรียงโดย : ณัฐพร น้ำใจดี
ที่มา : ศูนย์เทคโนโลศูนย์เทคโนโลยีสารสนเทศและการสื่อสาร สำนักงานปลัดกระทรวงสาธารณสุข
การจัดทำบทบรรยายสำหรับผู้พูด
คู่มือการใช้ MS Power Point 2003
การจัดทำบทบรรยายสำหรับผู้พูด
เรียบเรียงโดย : ณัฐพร น้ำใจดี
ที่มา : ศูนย์เทคโนโลศูนย์เทคโนโลยีสารสนเทศและการสื่อสาร สำนักงานปลัดกระทรวงสาธารณสุข
การลบและเพิ่มสไลด์
คู่มือการใช้ MS Power Point 2003 : การลบและเพิ่มสไลด์
เรียบเรียงโดย : ณัฐพร น้ำใจดี
ที่มา : ศูนย์เทคโนโลศูนย์เทคโนโลยีสารสนเทศและการสื่อสาร สำนักงานปลัดกระทรวงสาธารณสุข
More from PomPam Comsci (20)
พระราชบัญญัติว่าด้วยการกระทำความผิดเกี่ยวกับคอมพิวเตอร์ พ.ศ.2550 (ฉบับการ์ตูน) 2
พระราชบัญญัติว่าด้วยการกระทำความผิดเกี่ยวกับคอมพิวเตอร์ พ.ศ.2550 (ฉบับการ์ตูน) 2
พระราชบัญญัติว่าด้วยการกระทำความผิดเกี่ยวกับคอมพิวเตอร์ พ.ศ.2550 (ฉบับการ์ตูน)1
พระราชบัญญัติว่าด้วยการกระทำความผิดเกี่ยวกับคอมพิวเตอร์ พ.ศ.2550 (ฉบับการ์ตูน)1
Recently uploaded
Hindi varnamala | hindi alphabet PPT.pdf
हिंदी वर्णमाला पीपीटी, hindi alphabet PPT presentation, hindi varnamala PPT, Hindi Varnamala pdf, हिंदी स्वर, हिंदी व्यंजन, sikhiye hindi varnmala, dr. mulla adam ali, hindi language and literature, hindi alphabet with drawing, hindi alphabet pdf, hindi varnamala for childrens, hindi language, hindi varnamala practice for kids, https://www.drmullaadamali.com
BÀI TẬP BỔ TRỢ TIẾNG ANH 8 CẢ NĂM - GLOBAL SUCCESS - NĂM HỌC 2023-2024 (CÓ FI...
BÀI TẬP BỔ TRỢ TIẾNG ANH 8 CẢ NĂM - GLOBAL SUCCESS - NĂM HỌC 2023-2024 (CÓ FI...Nguyen Thanh Tu Collection
https://app.box.com/s/y977uz6bpd3af4qsebv7r9b7s21935vdBBR 2024 Summer Sessions Interview Training
Qualitative research interview training by Professor Katrina Pritchard and Dr Helen Williams
BÀI TẬP DẠY THÊM TIẾNG ANH LỚP 7 CẢ NĂM FRIENDS PLUS SÁCH CHÂN TRỜI SÁNG TẠO ...
BÀI TẬP DẠY THÊM TIẾNG ANH LỚP 7 CẢ NĂM FRIENDS PLUS SÁCH CHÂN TRỜI SÁNG TẠO ...Nguyen Thanh Tu Collection
https://app.box.com/s/qhtvq32h4ybf9t49ku85x0n3xl4jhr15Mule event processing models | MuleSoft Mysore Meetup #47
Mule event processing models | MuleSoft Mysore Meetup #47
Event Link:- https://meetups.mulesoft.com/events/details/mulesoft-mysore-presents-mule-event-processing-models/
Agenda
● What is event processing in MuleSoft?
● Types of event processing models in Mule 4
● Distinction between the reactive, parallel, blocking & non-blocking processing
For Upcoming Meetups Join Mysore Meetup Group - https://meetups.mulesoft.com/mysore/YouTube:- youtube.com/@mulesoftmysore
Mysore WhatsApp group:- https://chat.whatsapp.com/EhqtHtCC75vCAX7gaO842N
Speaker:-
Shivani Yasaswi - https://www.linkedin.com/in/shivaniyasaswi/
Organizers:-
Shubham Chaurasia - https://www.linkedin.com/in/shubhamchaurasia1/
Giridhar Meka - https://www.linkedin.com/in/giridharmeka
Priya Shaw - https://www.linkedin.com/in/priya-shaw
Gender and Mental Health - Counselling and Family Therapy Applications and In...
A proprietary approach developed by bringing together the best of learning theories from Psychology, design principles from the world of visualization, and pedagogical methods from over a decade of training experience, that enables you to: Learn better, faster!
Solutons Maths Escape Room Spatial .pptx
Solutions of Puzzles of Mathematics Escape Room Game in Spatial.io
Leveraging Generative AI to Drive Nonprofit Innovation
In this webinar, participants learned how to utilize Generative AI to streamline operations and elevate member engagement. Amazon Web Service experts provided a customer specific use cases and dived into low/no-code tools that are quick and easy to deploy through Amazon Web Service (AWS.)
Chapter wise All Notes of First year Basic Civil Engineering.pptx
Chapter wise All Notes of First year Basic Civil Engineering
Syllabus
Chapter-1
Introduction to objective, scope and outcome the subject
Chapter 2
Introduction: Scope and Specialization of Civil Engineering, Role of civil Engineer in Society, Impact of infrastructural development on economy of country.
Chapter 3
Surveying: Object Principles & Types of Surveying; Site Plans, Plans & Maps; Scales & Unit of different Measurements.
Linear Measurements: Instruments used. Linear Measurement by Tape, Ranging out Survey Lines and overcoming Obstructions; Measurements on sloping ground; Tape corrections, conventional symbols. Angular Measurements: Instruments used; Introduction to Compass Surveying, Bearings and Longitude & Latitude of a Line, Introduction to total station.
Levelling: Instrument used Object of levelling, Methods of levelling in brief, and Contour maps.
Chapter 4
Buildings: Selection of site for Buildings, Layout of Building Plan, Types of buildings, Plinth area, carpet area, floor space index, Introduction to building byelaws, concept of sun light & ventilation. Components of Buildings & their functions, Basic concept of R.C.C., Introduction to types of foundation
Chapter 5
Transportation: Introduction to Transportation Engineering; Traffic and Road Safety: Types and Characteristics of Various Modes of Transportation; Various Road Traffic Signs, Causes of Accidents and Road Safety Measures.
Chapter 6
Environmental Engineering: Environmental Pollution, Environmental Acts and Regulations, Functional Concepts of Ecology, Basics of Species, Biodiversity, Ecosystem, Hydrological Cycle; Chemical Cycles: Carbon, Nitrogen & Phosphorus; Energy Flow in Ecosystems.
Water Pollution: Water Quality standards, Introduction to Treatment & Disposal of Waste Water. Reuse and Saving of Water, Rain Water Harvesting. Solid Waste Management: Classification of Solid Waste, Collection, Transportation and Disposal of Solid. Recycling of Solid Waste: Energy Recovery, Sanitary Landfill, On-Site Sanitation. Air & Noise Pollution: Primary and Secondary air pollutants, Harmful effects of Air Pollution, Control of Air Pollution. . Noise Pollution Harmful Effects of noise pollution, control of noise pollution, Global warming & Climate Change, Ozone depletion, Greenhouse effect
Text Books:
1. Palancharmy, Basic Civil Engineering, McGraw Hill publishers.
2. Satheesh Gopi, Basic Civil Engineering, Pearson Publishers.
3. Ketki Rangwala Dalal, Essentials of Civil Engineering, Charotar Publishing House.
4. BCP, Surveying volume 1
clinical examination of hip joint (1).pdf
described clinical examination all orthopeadic conditions .
ANATOMY AND BIOMECHANICS OF HIP JOINT.pdf
it describes the bony anatomy including the femoral head , acetabulum, labrum . also discusses the capsule , ligaments . muscle that act on the hip joint and the range of motion are outlined. factors affecting hip joint stability and weight transmission through the joint are summarized.
How to Setup Warehouse & Location in Odoo 17 Inventory
In this slide, we'll explore how to set up warehouses and locations in Odoo 17 Inventory. This will help us manage our stock effectively, track inventory levels, and streamline warehouse operations.
Recently uploaded (20)
BÀI TẬP BỔ TRỢ TIẾNG ANH 8 CẢ NĂM - GLOBAL SUCCESS - NĂM HỌC 2023-2024 (CÓ FI...
BÀI TẬP BỔ TRỢ TIẾNG ANH 8 CẢ NĂM - GLOBAL SUCCESS - NĂM HỌC 2023-2024 (CÓ FI...
BÀI TẬP DẠY THÊM TIẾNG ANH LỚP 7 CẢ NĂM FRIENDS PLUS SÁCH CHÂN TRỜI SÁNG TẠO ...
BÀI TẬP DẠY THÊM TIẾNG ANH LỚP 7 CẢ NĂM FRIENDS PLUS SÁCH CHÂN TRỜI SÁNG TẠO ...
NEWSPAPERS - QUESTION 1 - REVISION POWERPOINT.pptx
NEWSPAPERS - QUESTION 1 - REVISION POWERPOINT.pptx
Mule event processing models | MuleSoft Mysore Meetup #47
Mule event processing models | MuleSoft Mysore Meetup #47
Gender and Mental Health - Counselling and Family Therapy Applications and In...
Gender and Mental Health - Counselling and Family Therapy Applications and In...
Leveraging Generative AI to Drive Nonprofit Innovation
Leveraging Generative AI to Drive Nonprofit Innovation
B. Ed Syllabus for babasaheb ambedkar education university.pdf
B. Ed Syllabus for babasaheb ambedkar education university.pdf
Chapter wise All Notes of First year Basic Civil Engineering.pptx
Chapter wise All Notes of First year Basic Civil Engineering.pptx
How to Setup Warehouse & Location in Odoo 17 Inventory
How to Setup Warehouse & Location in Odoo 17 Inventory
การจัดการฉากหลังของสไลด์
- 1. 7 7.1 Clipart , , shape Object '( ) ) * + ' + ,(- + . , ) ,* • / 0 1,( 2 Format • / 0 / )( Background + 3 ) ,* Fill Effects Microsoft PowerPoint .. 14
- 2. 7.2 ! (Shawdow) • / 0 1,( 78 Shadow Setting 5 . 5 /+( Drawing • +/ 0 1,( 78 3-D Settings.. ( object G .55 3-D . 5 /+( ( 3-D . 5 /+( Shadow 1061 +1 ) 7 - . 5 /+( Shadow Settings 1061 +1 ) 7 (Object) - . 5 /+( 3-D ( G ) 7 .55 3 dimension ( 0 ) ) +2 0 +)5 ) ( 1,( -2 -G Shadow Settings , 3-D K +. + ) +,- G /L 7 -M , , 1061 , , +)5/ N N Microsoft PowerPoint .. 15