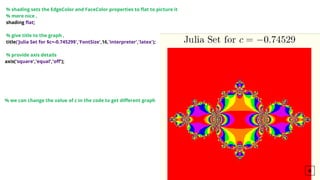
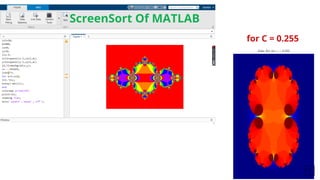
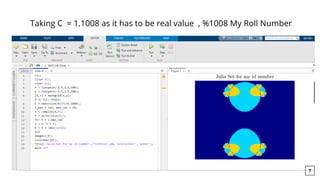
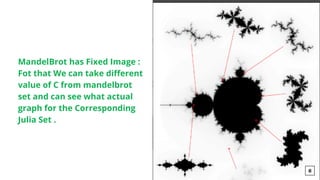
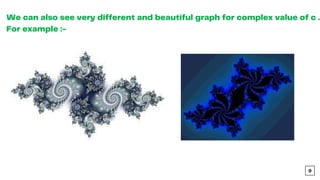
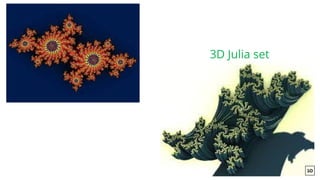
The document discusses the implementation of Julia sets using MATLAB, specifically for various complex numbers. It describes the process of generating fractals by iterating a complex function and provides sample code to visualize the Julia set for specific values of c. The document also mentions the connection to the Mandelbrot set and encourages experimentation with different parameters to create diverse graphics.

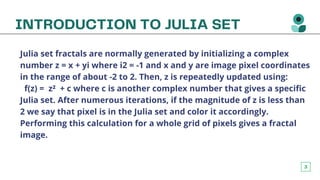
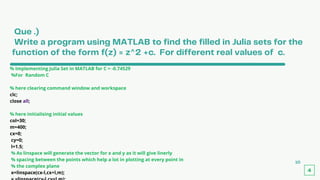
![% using meshgrid to convert out vector x and y into array for plotting
% purpose
[X,Y]=meshgrid(x,y);
% initialising C as it was asked for real value of c
c= -.745429;
% Initialising the Z complex variable as i in term of x and y .
Z=X+1i*Y;
% Iterates till col = 30
for k=1:col;
Z =Z.^2+c;
% finding absolute value of the complex variable for the c
W=exp(-abs(Z));
end
% using colormap to give colour to the graph as it was required for
% colourful images
colormap prism(415)
% pcolor because it create a colourful pseudo plot what we wanted;
pcolor(W);
5](https://image.slidesharecdn.com/ashishkumaramathematics-220328154610/85/Julia-Set-5-320.jpg)