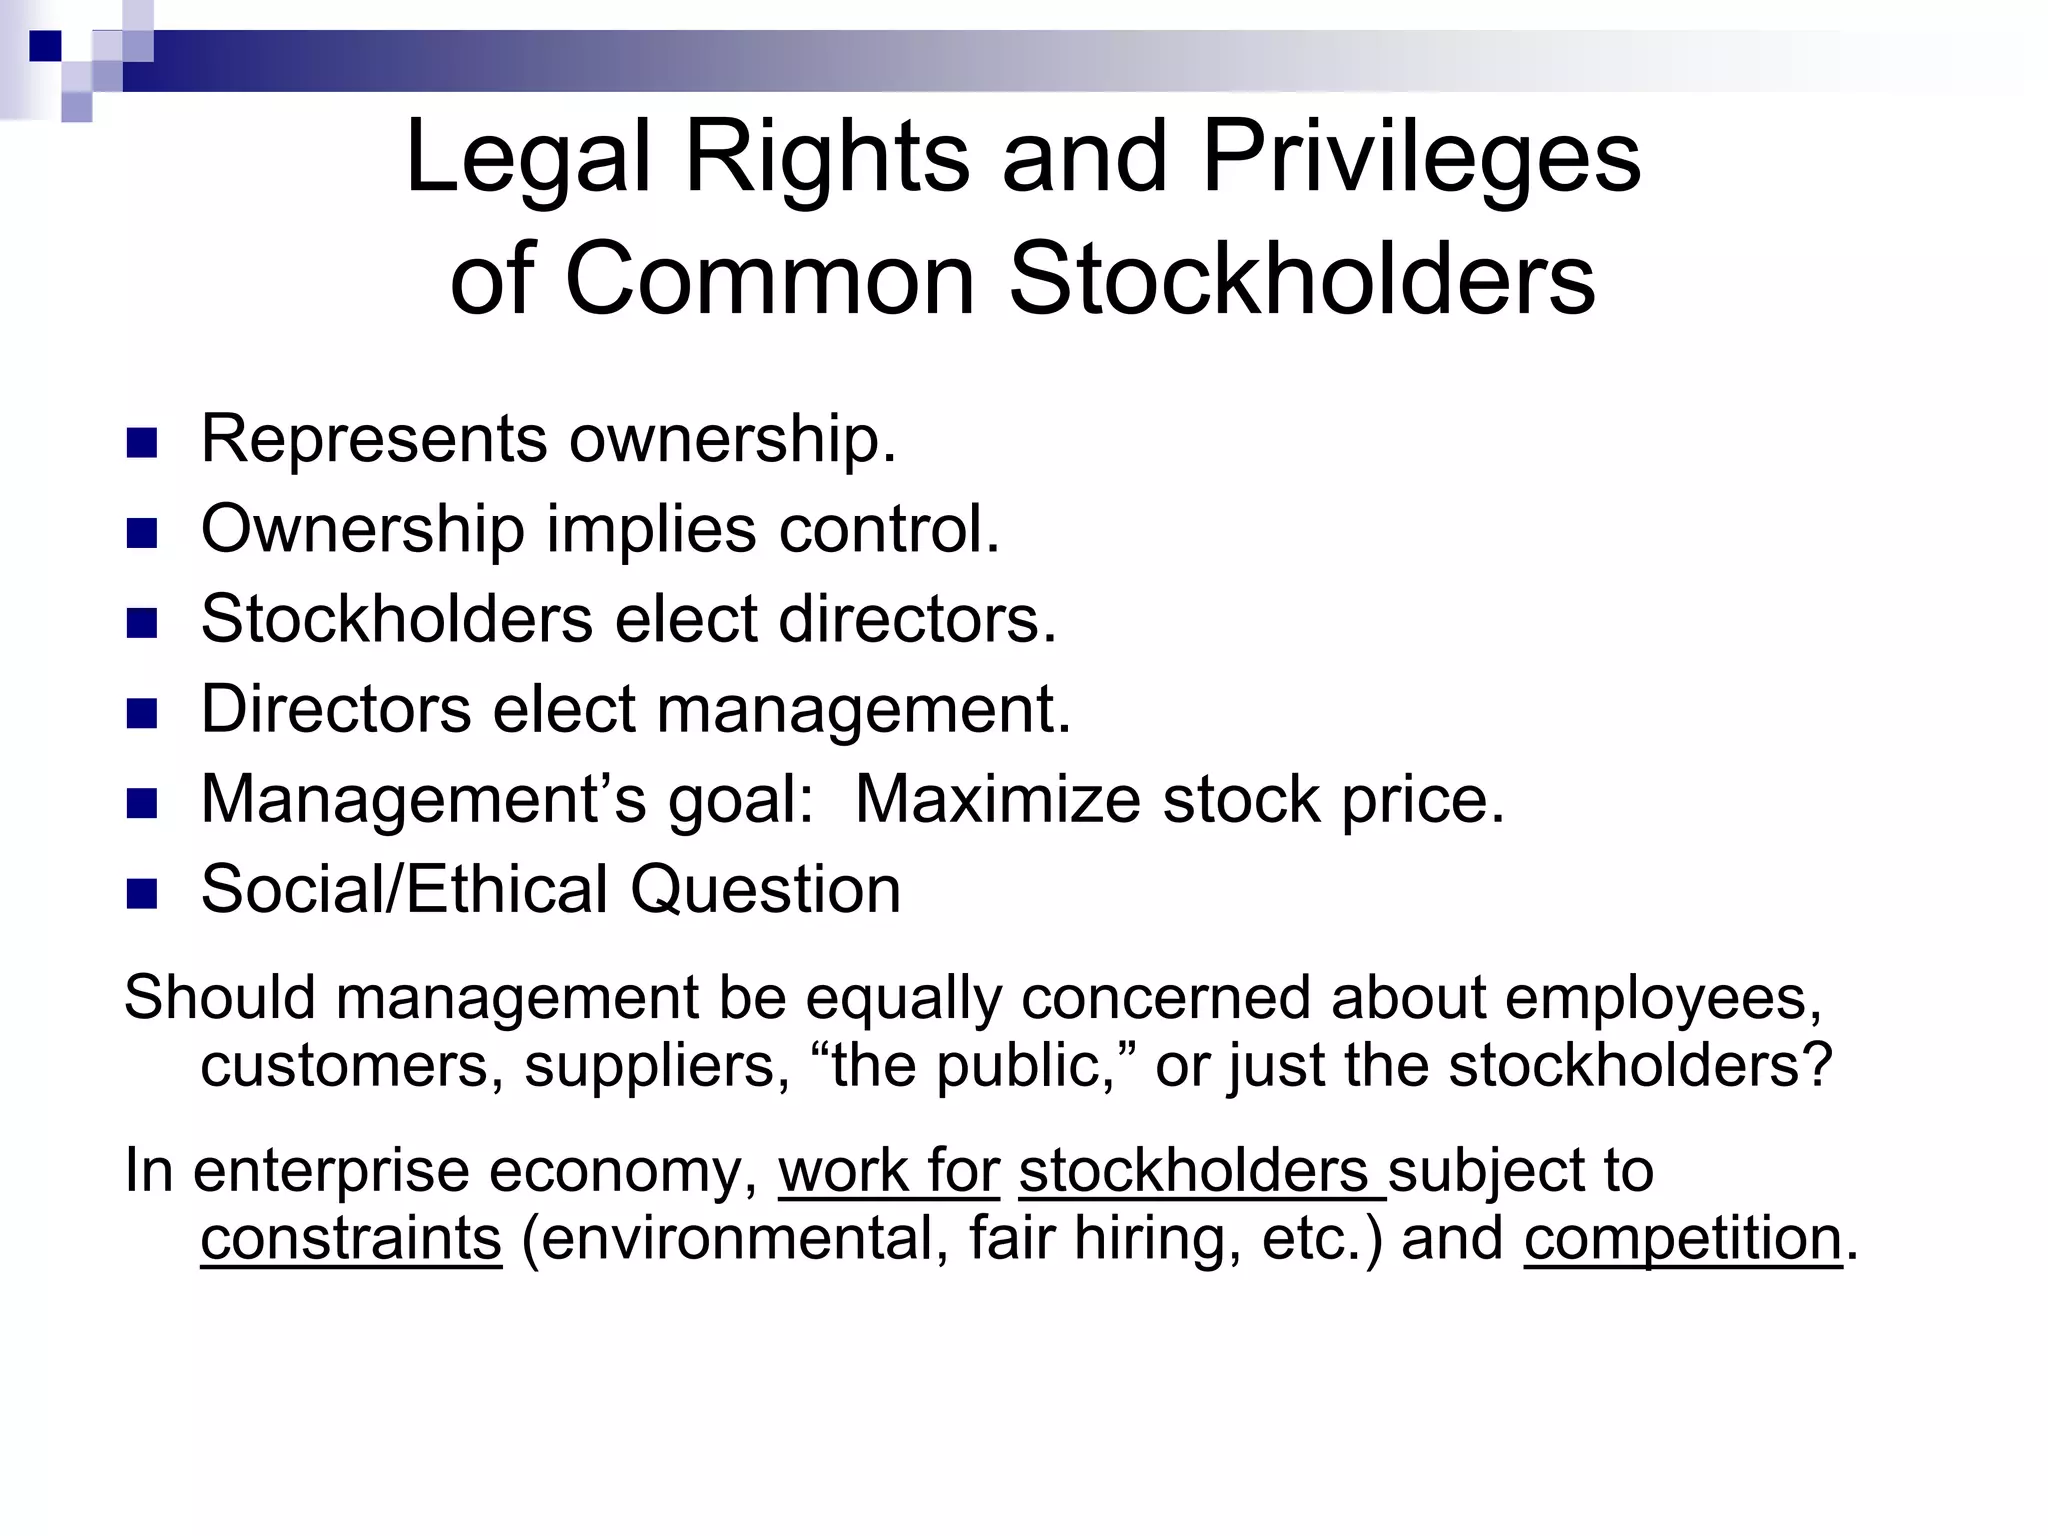
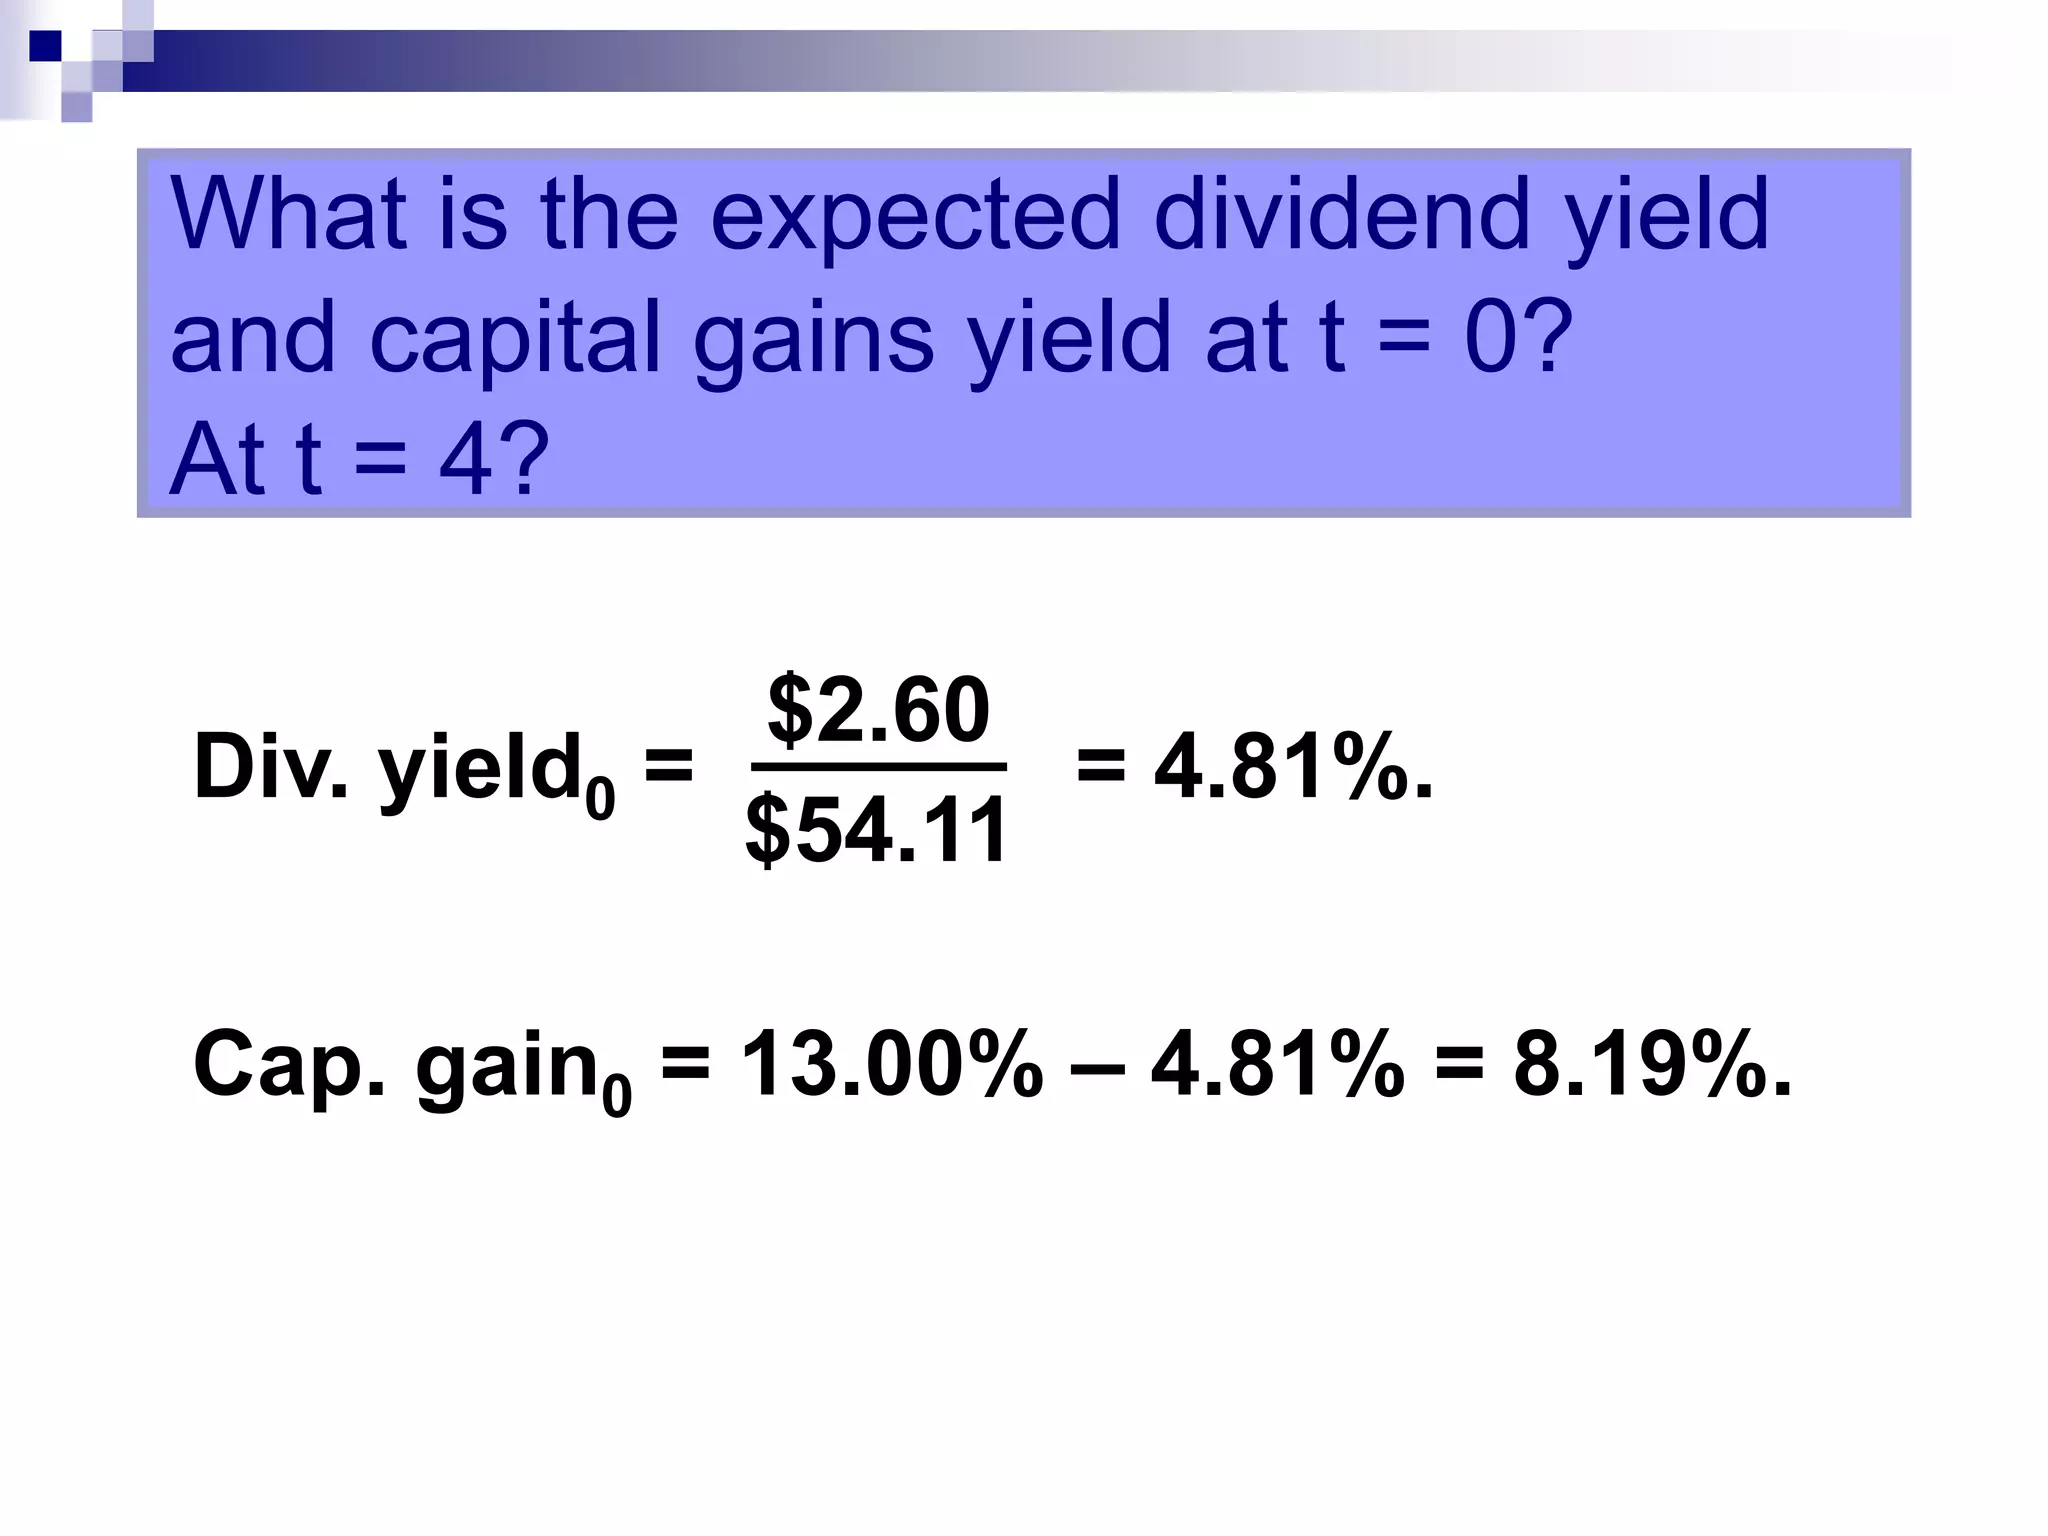
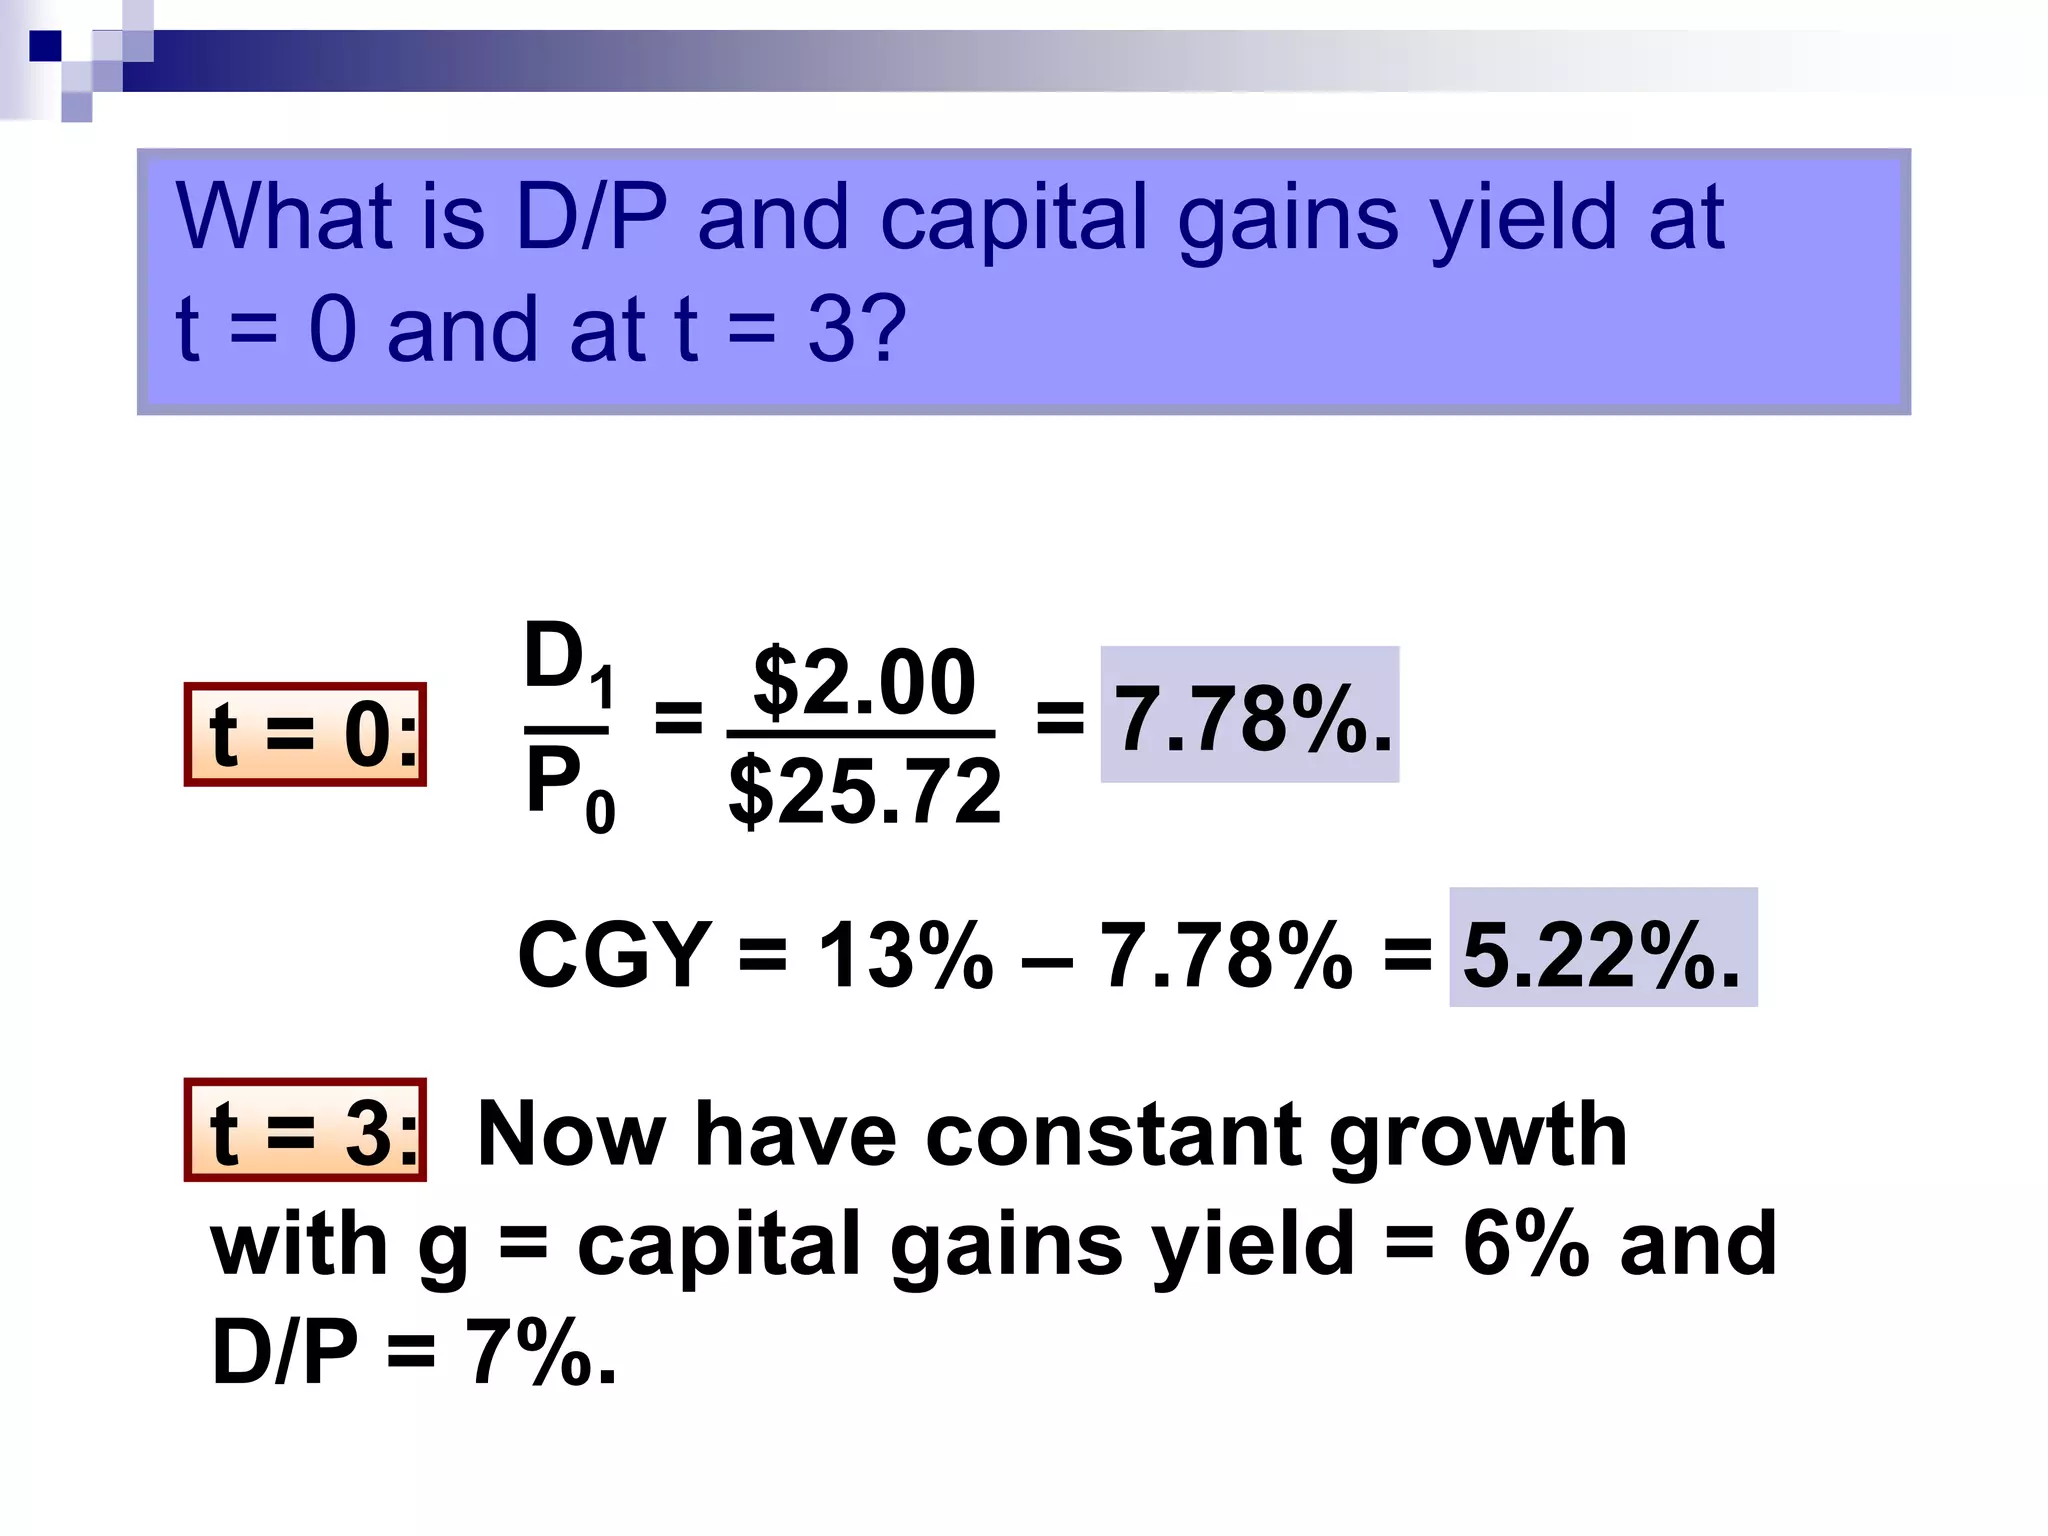
This document discusses common stock valuation models. It begins by explaining the dividend growth model and its assumptions for valuing constant growth stocks. It then discusses handling non-constant growth periods and the free cash flow method. It also covers market equilibrium, how it is established, and the efficient market hypothesis which suggests stock prices reflect all available information.
STOCKS, SHARES, EQUITY SHARES, PREFERENCE SHARES, BONDS, DEBENTURES, STOCK VALUATION, FEATURES OF COMMON STOCK, DETERMINING COMMON STOCK VALUES, EFFECTIVE MARKETS, etc.
Understand the role that financial institutions play in managerial
finance. Contrast the functions of financial institutions and financial markets.
Describe the differences between the capital markets and the
money markets.Discuss business taxes and their importance in financial decisions.
Partnerships generally are associated with the practice of law, medicine, public accounting and other professions, and also with small business enterprises
This presentation covers the basics of Dividend Discount Model (DDM). Firstly, fundamental formula for valuing a stock using DDM is discussed. After that, 3 cases i.e DDM for zero growth, constant growth, and variable growth stocks, are discussed.
The presentation slide is on stock valuation. We have tried to present the various techniques to stock valuation under which different methods are discussed with illustrations. Key concepts:
Zero Growth Model
Balance sheet Technique
Constant Growth Model
Two-stage growth Model
Feel Free to comment.
Risk Return Trade Off PowerPoint Presentation SlidesSlideTeam
Presenting this set of slides with name - Risk Return Trade Off Powerpoint Presentation Slides. This deck consists of total of twenty nine slides. It has PPT slides highlighting important topics of Risk Return Trade Off Powerpoint Presentation Slides. This deck comprises of amazing visuals with thoroughly researched content. Each template is well crafted and designed by our PowerPoint experts. Our designers have included all the necessary PowerPoint layouts in this deck. From icons to graphs, this PPT deck has it all. The best part is that these templates are easily customizable. Just click the DOWNLOAD button shown below. Edit the colour, text, font size, add or delete the content as per the requirement. Download this deck now and engage your audience with this ready made presentation.
risk and return. Defining Return, Return Example, Defining Risk,Determining Expected Return , How to Determine the Expected Return and Standard Deviation, Determining Standard Deviation (Risk Measure), Portfolio Risk and Expected Return Example, Determining Portfolio Expected Return, Determining Portfolio Standard Deviation, Summary of the Portfolio Return and Risk Calculation, Total Risk = Systematic Risk + Unsystematic Risk,
1CHAPTER 7Stocks, Stock Valuation, and Stock Market Equili.docxhyacinthshackley2629
1
CHAPTER 7
Stocks, Stock Valuation, and
Stock Market Equilibrium
2
Topics in Chapter
Features of common stock
Valuing common stock
Preferred stock
Stock market equilibrium
Efficient markets hypothesis
Implications of market efficiency for financial decisions
1
ValueStock = + + +
D1
D2
D∞
(1 + rs )1
(1 + rs)∞
(1 + rs)2
Dividends (Dt)
Market interest rates
Firm’s business risk
Market risk aversion
Firm’s debt/equity mix
Cost of
equity (rs)
Free cash flow
(FCF)
The Big Picture:
The Intrinsic Value of Common Stock
...
For value box in Ch 4 time value FM13.
4
Common Stock: Owners, Directors, and Managers
Represents ownership.
Ownership implies control.
Stockholders elect directors.
Directors hire management.
Since managers are “agents” of shareholders, their goal should be: Maximize stock price.
5
Classified Stock
Classified stock has special provisions.
Could classify existing stock as founders’ shares, with voting rights but dividend restrictions.
New shares might be called “Class A” shares, with voting restrictions but full dividend rights.
6
Tracking Stock
The dividends of tracking stock are tied to a particular division, rather than the company as a whole.
Investors can separately value the divisions.
Its easier to compensate division managers with the tracking stock.
But tracking stock usually has no voting rights, and the financial disclosure for the division is not as regulated as for the company.
7
Different Approaches for Valuing Common Stock
Dividend growth model
Constant growth stocks
Nonconstant growth stocks
Free cash flow method (covered in Chapter 11)
Using the multiples of comparable firms
8
Stock Value = PV of Dividends
What is a constant growth stock?
One whose dividends are expected to grow forever at a constant rate, g.
P0 =
^
(1 + rs)1 (1 + rs)2 (1 + rs)3 (1 + rs)∞
D1 D2 D3 D∞
+
+
+ … +
9
For a constant growth stock:
D1 = D0(1 + g)1
D2 = D0(1 + g)2
Dt = D0(1 + g)t
If g is constant and less than rs, then:
P0 =
^
D0(1 + g)
rs – g
=
D1
rs – g
10
Dividend Growth and PV of Dividends: P0 = ∑(PV of Dt)
$
0.25
Years (t)
Dt = D0(1 + g)t
PV of Dt =
Dt
(1 + r)t
If g > r, P0 = ∞ !
11
What happens if g > rs?
P0 =
^
(1 + rs)1 (1 + rs)2 (1 + rs)∞
D0(1 + g)1 D0(1 + g)2 D0(1 + rs)∞
+
+ … +
(1 + g)t
(1 + rs)t
P0 = ∞
^
> 1, and
So g must be less than rs for the constant growth model to be applicable!!
If g > rs, then
12
Required rate of return: beta = 1.2, rRF = 7%, and RPM = 5%.
rs = rRF + (RPM)bFirm
= 7% + (5%)(1.2)
= 13%.
Use the SML to calculate rs:
13
Projected Dividends
D0 = $2 and constant g = 6%
D1 = D0(1 + g) = $2(1.06) = $2.12
D2 = D1(1 + g) = $2.12(1.06) = $2.2472
D3 = D2(1 + g) = $2.2472(1.06) = $2.3820
11
14
Expected Div.
Slide 1
7-1
Cash Flows for Stockholders
• If you own a share of stock, you can receive
cash in two ways
The company pays dividends
You sell your shares, either to another investor in
the market or back to the company
• As with bonds, the price of the stock is the
present value of these expected cash flows
Dividends → cash income
Selling → capital gains
In this module, we turn to the other major source of financing for corporations, common and preferred stock.
The goal of financial management is to maximize stock prices, so an understanding of what determines
share values is obviously a key concern. The dividends currently being paid are one of the primary factors
we look at when we attempt to value common stocks. This module explores dividends, stock values, and
the connection between the two.
A share of common stock is more difficult to value in practice than a bond, for at least three reasons.
First, with common stock, not even the promised cash flows are known in advance.
Second, the life of the investment is essentially forever, since common stock has no maturity.
Third, there is no way to easily observe the rate of return that the market requires.
However, we can come up with the present value of the future cash flows for a share of stock making some
assumptions.
Slide 2
7-2
One Period Example
• Suppose you are thinking of purchasing the
stock of Moore Oil, Inc.
– You expect it to pay a $2 dividend in one year
– You believe you can sell the stock for $14 at that
time.
– You require a return of 20% on investments of this
risk
– What is the maximum you would be willing to
pay?
Slide 3
7-3
One Period Example
• D1 = $2 dividend expected in one year
• R = 20%
• P1 = $14
• CF1 = $2 + $14 = $16
• Compute the PV of the expected cash flows
33.13$
20.1
)142(
P
0
Note, the calculation can also be done as:
FV = 14; PMT = 2; I/Y = 20; N = 1; CPT PV = -13.33
Slide 4
7-4
Two Period Example
• What if you decide to hold the stock for two years?
– In addition to the dividend in one year, you expect a
dividend of $2.10 in two years and a stock price of
$14.70 at the end of year 2.
– Now how much would you be willing to pay?
33.13$
)20.1(
)70.1410.2(
20.1
2
P
20
Calculator: CF0 = 0; C01 = 2; F01 = 1; C02 = 16.80; F02 = 1; NPV; I =
20; CPT NPV = 13.33
We can use uneven cash flow keys.
Slide 5
7-5
Three Period Example
• What if you decide to hold the stock for three
years?
– In addition to the dividends at the end of years 1 and 2,
you expect to receive a dividend of $2.205 at the end of
year 3 and the stock price is expected to be $15.435.
– Now how much would you be willing to pay?
33.13$
)20.1(
)435.15205.2(
)20.1(
10.2
20.1
2
P
320
Calcultator: CF0 = 0; C01 = 2; F01 = 1; C02 = 2.10; F02 = 1; C03 = 17.64;
F03 = 1; NPV; I = 20; CPT NPV = 13.33
Slide 6
7-6
Devel.
Dividend policy
What is Dividend?
What is dividend policy?
Theories of Dividend Policy
Relevant Theory
Walter’s Model
Gordon’s Model
Irrelevant Theory
M-M’s Approach
Traditional Approach
Referred to:
Prasanna Chandra
Stock Valuation Key Concepts and SkillsUnderstand how sto.docxrjoseph5
Stock Valuation: Key Concepts and SkillsUnderstand how stock prices depend on future dividends and dividend growthBe able to compute stock prices using the dividend growth modelUnderstand how corporate directors are electedUnderstand how stock markets workUnderstand how stock prices are quoted
8-*
OutlineCommon Stock ValuationSome Features of Common and Preferred StocksThe Stock Markets
8-*
Cash Flows for StockholdersIf you buy a share of stock, you can receive cash in two waysThe company pays dividendsYou sell your shares, either to another investor in the market or back to the companyAs with bonds, the price of the stock is the present value of these expected cash flows
8-*
7.*
One-Period ExampleSuppose you are thinking of purchasing the stock of Moore Oil, Inc. You expect it to pay a $2 dividend in one year, and you believe that you can sell the stock for $14 at that time. If you require a return of 20% on investments of this risk, what is the maximum you would be willing to pay?Compute the PV of the expected cash flowsPrice = (14 + 2) / (1.2) = $13.33Or FV = 16; I/Y = 20; N = 1; CPT PV = -13.33
8-*
7.*
Two-Period ExampleNow, what if you decide to hold the stock for two years? In addition to the dividend in one year, you expect a dividend of $2.10 in two years and a stock price of $14.70 at the end of year 2. Now how much would you be willing to pay?PV = 2 / (1.2) + (2.10 + 14.70) / (1.2)2 = 13.33
8-*
7.*
Three-Period ExampleFinally, what if you decide to hold the stock for three years? In addition to the dividends at the end of years 1 and 2, you expect to receive a dividend of $2.205 at the end of year 3 and the stock price is expected to be $15.435. Now how much would you be willing to pay?PV = 2 / 1.2 + 2.10 / (1.2)2 + (2.205 + 15.435) / (1.2)3 = 13.33
8-*
7.*
Developing The ModelYou could continue to push back the year in which you will sell the stockYou would find that the price of the stock is really just the present value of all expected future dividendsSo, how can we estimate all future dividend payments?
8-*
7.*
Estimating Dividends:
Special CasesConstant dividendThe firm will pay a constant dividend foreverThis is like preferred stockThe price is computed using the perpetuity formulaConstant dividend growthThe firm will increase the dividend by a constant percent every periodThe price is computed using the growing perpetuity modelSupernormal growthDividend growth is not consistent initially, but settles down to constant growth eventuallyThe price is computed using a multistage model
8-*
Zero GrowthIf dividends are expected at regular intervals forever, then this is a perpetuity and the present value of expected future dividends can be found using the perpetuity formulaP0 = D / RSuppose stock is expected to pay a $0.50 dividend every quarter and the required return is 10% with quarterly compounding. What is the price?P0 = .50 / (.1 / 4) = $20
8-*
7.*
Dividend Growth ModelDividends are exp.
Similar to Ch 10 Stocks and Their Valuation.ppt (20)
Synthetic Fiber Construction in lab .pptxPavel ( NSTU)
Synthetic fiber production is a fascinating and complex field that blends chemistry, engineering, and environmental science. By understanding these aspects, students can gain a comprehensive view of synthetic fiber production, its impact on society and the environment, and the potential for future innovations. Synthetic fibers play a crucial role in modern society, impacting various aspects of daily life, industry, and the environment. ynthetic fibers are integral to modern life, offering a range of benefits from cost-effectiveness and versatility to innovative applications and performance characteristics. While they pose environmental challenges, ongoing research and development aim to create more sustainable and eco-friendly alternatives. Understanding the importance of synthetic fibers helps in appreciating their role in the economy, industry, and daily life, while also emphasizing the need for sustainable practices and innovation.
Francesca Gottschalk - How can education support child empowerment.pptxEduSkills OECD
Francesca Gottschalk from the OECD’s Centre for Educational Research and Innovation presents at the Ask an Expert Webinar: How can education support child empowerment?
Normal Labour/ Stages of Labour/ Mechanism of LabourWasim Ak
Normal labor is also termed spontaneous labor, defined as the natural physiological process through which the fetus, placenta, and membranes are expelled from the uterus through the birth canal at term (37 to 42 weeks
Safalta Digital marketing institute in Noida, provide complete applications that encompass a huge range of virtual advertising and marketing additives, which includes search engine optimization, virtual communication advertising, pay-per-click on marketing, content material advertising, internet analytics, and greater. These university courses are designed for students who possess a comprehensive understanding of virtual marketing strategies and attributes.Safalta Digital Marketing Institute in Noida is a first choice for young individuals or students who are looking to start their careers in the field of digital advertising. The institute gives specialized courses designed and certification.
for beginners, providing thorough training in areas such as SEO, digital communication marketing, and PPC training in Noida. After finishing the program, students receive the certifications recognised by top different universitie, setting a strong foundation for a successful career in digital marketing.
Operation “Blue Star” is the only event in the history of Independent India where the state went into war with its own people. Even after about 40 years it is not clear if it was culmination of states anger over people of the region, a political game of power or start of dictatorial chapter in the democratic setup.
The people of Punjab felt alienated from main stream due to denial of their just demands during a long democratic struggle since independence. As it happen all over the word, it led to militant struggle with great loss of lives of military, police and civilian personnel. Killing of Indira Gandhi and massacre of innocent Sikhs in Delhi and other India cities was also associated with this movement.
Embracing GenAI - A Strategic ImperativePeter Windle
Artificial Intelligence (AI) technologies such as Generative AI, Image Generators and Large Language Models have had a dramatic impact on teaching, learning and assessment over the past 18 months. The most immediate threat AI posed was to Academic Integrity with Higher Education Institutes (HEIs) focusing their efforts on combating the use of GenAI in assessment. Guidelines were developed for staff and students, policies put in place too. Innovative educators have forged paths in the use of Generative AI for teaching, learning and assessments leading to pockets of transformation springing up across HEIs, often with little or no top-down guidance, support or direction.
This Gasta posits a strategic approach to integrating AI into HEIs to prepare staff, students and the curriculum for an evolving world and workplace. We will highlight the advantages of working with these technologies beyond the realm of teaching, learning and assessment by considering prompt engineering skills, industry impact, curriculum changes, and the need for staff upskilling. In contrast, not engaging strategically with Generative AI poses risks, including falling behind peers, missed opportunities and failing to ensure our graduates remain employable. The rapid evolution of AI technologies necessitates a proactive and strategic approach if we are to remain relevant.
Exploiting Artificial Intelligence for Empowering Researchers and Faculty, In...Dr. Vinod Kumar Kanvaria
Exploiting Artificial Intelligence for Empowering Researchers and Faculty,
International FDP on Fundamentals of Research in Social Sciences
at Integral University, Lucknow, 06.06.2024
By Dr. Vinod Kumar Kanvaria
Biological screening of herbal drugs: Introduction and Need for
Phyto-Pharmacological Screening, New Strategies for evaluating
Natural Products, In vitro evaluation techniques for Antioxidants, Antimicrobial and Anticancer drugs. In vivo evaluation techniques
for Anti-inflammatory, Antiulcer, Anticancer, Wound healing, Antidiabetic, Hepatoprotective, Cardio protective, Diuretics and
Antifertility, Toxicity studies as per OECD guidelines
The French Revolution, which began in 1789, was a period of radical social and political upheaval in France. It marked the decline of absolute monarchies, the rise of secular and democratic republics, and the eventual rise of Napoleon Bonaparte. This revolutionary period is crucial in understanding the transition from feudalism to modernity in Europe.
For more information, visit-www.vavaclasses.com
A Strategic Approach: GenAI in EducationPeter Windle
Artificial Intelligence (AI) technologies such as Generative AI, Image Generators and Large Language Models have had a dramatic impact on teaching, learning and assessment over the past 18 months. The most immediate threat AI posed was to Academic Integrity with Higher Education Institutes (HEIs) focusing their efforts on combating the use of GenAI in assessment. Guidelines were developed for staff and students, policies put in place too. Innovative educators have forged paths in the use of Generative AI for teaching, learning and assessments leading to pockets of transformation springing up across HEIs, often with little or no top-down guidance, support or direction.
This Gasta posits a strategic approach to integrating AI into HEIs to prepare staff, students and the curriculum for an evolving world and workplace. We will highlight the advantages of working with these technologies beyond the realm of teaching, learning and assessment by considering prompt engineering skills, industry impact, curriculum changes, and the need for staff upskilling. In contrast, not engaging strategically with Generative AI poses risks, including falling behind peers, missed opportunities and failing to ensure our graduates remain employable. The rapid evolution of AI technologies necessitates a proactive and strategic approach if we are to remain relevant.
2. Legal Rights and Privileges
of Common Stockholders
Represents ownership.
Ownership implies control.
Stockholders elect directors.
Directors elect management.
Management’s goal: Maximize stock price.
Social/Ethical Question
Should management be equally concerned about employees,
customers, suppliers, “the public,” or just the stockholders?
In enterprise economy, work for stockholders subject to
constraints (environmental, fair hiring, etc.) and competition.
3. Types of Common Stocks
Classified stock has special provisions.
Could classify existing stock as founders’
shares, with voting rights but dividend
restrictions.
New shares might be called “Class A”
shares, with voting restrictions but full
dividend rights.
4. The Market for Common Stock
Closely Held Corporations
Publicly Owned Corporations
Types of Stocks Market Transaction
Secondary Market
Primary Market
Going Public
Initial Public Offering Market
5. Definitions of Terms Used in Stock Valuation Model
Stock market price
Intrinsic (theoretical) value of stock
Expected rate of growth in dividend per share g
Required rate of return
Expected rate of return
Expected Dividend yield
Expected Capital gain yield
Expected total return = +
P0
rs
^
rs D
1
P0
P1 – P0
P0
^
^
r s P1 – P0
P0
^
D
1
P0
P
0
^
6. ( ) ( ) ( )
D
k
D
k
D
k
s s s
P0
2
2
3
3
1 1 1
=
( )
D
ks
1
1
1+
+
+
+
+
+ +
+
. . .
One whose dividends are expected to
grow forever at a constant rate, g.
Stock Value = PV of Dividends
What is a constant growth stock?
Dividend growth model
^
7. For a Constant Growth Stock
(Constant Growth/Gordon Model)
D1 = D0(1 + g)1
D2 = D0(1 + g)2
Dt = D0(1 + g)t
P0 = = .
If g is constant, then:
D0(1 + g)
rs - g
D1
rs - g
^
8. Example
RT & T just paid a dividend of $1.15, its stock has a
required rate of return, ks, of 13,4%, and investors expect
the dividend to grow at a constant 8 % rate in the future.
The estimated dividend one year hence would be
D1 = $1.15(1.08) = $1.24
D2 = $1.34
D5 = $1.69
Using Gordon Model, we can know the intrinsic value of
stock (P0)=
P0 = $1.15 (1.08) = $23
0.134 – 0.08
^
^
9. ( )t
0
t g
1
D
D +
=
( )t
t
t
r
D
PVD
+
=
1
t
0
PVD
P
=
$
1.15
Years (t)
0
PV D1 = 1.10
Present Values of Dividends of a Constant Growth Stock
10. What happens if g > ks?
If rs< g, get negative stock price, which
is nonsense.
We can’t use model unless (1) rs> g and
(2) g is expected to be constant forever.
.
D
r g
g
s
1
=
-
>
requires r s
P0
^
11. Assume beta = 1.2, rRF = 7%, and rM =
12%. What is the required rate of return
on the firm’s stock?
rs= rRF + (rM – rRF)bFirm
= 7% + (12% – 7%) (1.2)
= 13%.
Use the SML to calculate ks:
12. D0 was $2.00 and g is a constant 6%.
Find the expected dividends for the
next 3 years, and their PVs. ks = 13%.
0 1
2.247
2
2.382
3
g = 6%
1.8761
1.7599
D0 = 2.00
1.6509
13%
2.12
14. D1 will have been paid, so expected dividends
are D2, D3, D4 and so on. Thus,
Could also find P1 as follows:
ks – g 0.13 – 0.06
P1 = =
What is the stock’s market value
one year from now, P1?
^
^
^
D2 $2.247
^
= $32.10.
P1 = P0(1.06) = $32.10.
15. Find the expected dividend yield,
capital gains yield, and total return
during the first year.
Dividend yld = = =
Cap gains yld = =
Total return = 7.0% + 6.0% = 13.0%.
D1
P0
P1 – P0
P0
^
$30.29
$2.12
7.0%.
$32.10 – $30.29
$30.29
= 6.0%.
16. Rearrange model to rate of return form:
.
P
D
r g
D
P
g
s
0
1 1
0
=
-
= +
to r s
Then, rs = $2.12/$30.29 + 0.06
= 0.07 + 0.06 = 13%.
^
^ ^
17. P0 = = = $15.38.
What would P0 be if g = 0?
The dividend stream would be a
perpetuity.
2.00 2.00
2.00
0 1 2 3
13% ...
^ PMT
r
$2.00
0.13
^
18. For a Constant Growth Stock
The following conditions must hold:
1. The dividend is expected to grow forever at a
constant rate, g
2. The stock price is expected to grow at this same
rate
3. The expected dividend yield is a constant
4. The expected capital gain yield is also a constant,
and it is equal to g
5. The expected total rate of return, , is equal to the
expected dividend yield plus the expected growth
rate: = dividend yield + g
^
r s
^
r s
19. Can no longer use constant growth model.
However, growth becomes constant after 3 years
(terminal/horizon date: the date when the growth rate
becomes constant)
3 Steps for nonconstant growth:
Find the PV of the dividends during the period of
nonconstant growth
Find the price of the stock at the end of the noncontstant
growth period, at which point has become a constant
growth stock, and discount this price back to the present
Add this two components to find the intrinsic value of the
stock, P0
If we have supernormal growth of 30%
for 3 years, then a long-run constant
g = 6%, what is P0? k is still 13%.
^
^
20. Nonconstant growth followed by constant
growth:
0
2.301
2.647
3.045
46.116
1 2 3 4
rs = 13%
54.109 = P0
g = 30% g = 30% g = 30% g = 6%
D0 = 2.00 2.600 3.380 4.394 4.658
$ .
. .
$66.54
P3
4.658
13 0 06
=
-
=
0
...
^
21. What is the expected dividend yield
and capital gains yield at t = 0?
At t = 4?
Div. yield0 = = 4.81%.
Cap. gain0 = 13.00% – 4.81% = 8.19%.
$2.60
$54.11
22. During nonconstant growth, D/P and
capital gains yield are not constant, and
capital gains yield is less than g.
After t = 3, g = constant = 6% = capital
gains yield; r = 13%; so D/P = 13% –
6% = 7%.
23. 25.72
Suppose g = 0 for t = 1 to 3, and then
g is a constant 6%. What is P0?
0
1.77
1.57
1.39
20.99
1 2 3 4
ks=13%
g = 0% g = 0% g = 0% g = 6%
2.00 2.00 2.00 2.00 2.12
.
$
P3
2.12
0 07
30.29.
= =
^
...
24. t = 3: Now have constant growth
with g = capital gains yield = 6% and
D/P = 7%.
$2.00
$25.72
What is D/P and capital gains yield at
t = 0 and at t = 3?
t = 0:
D1
P0
= = 7.78%.
CGY = 13% – 7.78% = 5.22%.
25. If g = -6%, would anyone buy the
stock? If so, at what price?
Firm still has earnings and still pays
dividends, so P0 > 0:
( )
$
P
D
r g
D g
r g
s s
0
1 0 1
=
-
=
+
-
$2.00(0.94) $1.88
0.13 – (-0.06) 0.19
= = = $9.89.
26. What is the annual D/P and capital
gains yield?
Capital gains yield = g = -6.0%,
Dividend yield= 13.0% – (-6.0%) = 19%.
D/P and cap. gains yield are constant,
with high dividend yield (19%) offsetting
negative capital gains yield.
27. Free Cash Flow Method
The free cash flow method suggests
that the value of the entire firm equals
the present value of the firm’s free cash
flows (calculated on an after-tax basis).
Recall that the free cash flow in any
given year can be calculated as:
NOPAT – Net capital investment.
28. Once the value of the firm is estimated, an
estimate of the stock price can be found
as follows:
MV of common stock (market capitalization) =
MV of firm – MV of debt and preferred stock.
P = MV of common stock/number of shares.
Using the Free Cash Flow Method
^
29. Free cash flow method is often preferred
to the dividend growth model--
particularly for the large number of
companies that don’t pay a dividend, or
for whom it is hard to forecast dividends.
Issues Regarding the Free Cash
Flow Method
(More...)
30. Similar to the dividend growth model,
the free cash flow method generally
assumes that at some point in time, the
growth rate in free cash flow will
become constant.
Terminal value represents the value of
the firm at the point in which growth
becomes constant.
FCF Method Issues Continued
31. 416.942
FCF estimates for the next 3 years are
-$5, $10, and $20 million, after which the
FCF is expected to grow at 6%. The
overall firm cost of capital is 10%.
0
-4.545
8.264
15.026
398.197
1 2 3 4
r = 10%
g = 6%
-5 10 20 21.20
21.20
0.04
...
*TV3 represents the terminal value of
the firm, at t = 3.
530 = = *TV3
32. If the firm has $40 million in debt and has
10 million shares of stock, what is the
price per share?
Value of equity = Total value – Value of debt
= $416.94 – $40
= $376.94 million.
Price per share = Value of equity/number of shares
= $376.94/10
= $37.69.
33. In equilibrium, stock prices are stable.
There is no general tendency for
people to buy versus to sell.
In equilibrium, expected returns must
equal required returns:
What is market equilibrium?
rs = D1/P0 + g = rs = rRF + (rM – rRF)b.
^
34. rs = D1/P0 + g = rs = rRF + (rM – rRF)b.
^
Expected returns are obtained by
estimating dividends and expected
capital gains (which can be found
using any of the three common stock
valuation approaches).
Required returns are obtained from
the CAPM.
35. How is equilibrium established?
If ks = + g > ks, then
P0 is “too low” (a bargain).
Buy orders > sell orders;
P0 bid up; D1/P0 falls until
D1/P0 + g = ks = ks.
^
^
D1
P0
36. Why do stock prices change?
1. ki could change:
ki = rRF + (rM – rRF )bi.
rRF = k* + IP.
2. g could change due to
economic or firm situation.
P0 =
^ D1
ri – g
37. What’s the Efficient Market Hypothesis?
EMH: Securities are normally in
equilibrium and are “fairly
priced.” One cannot “beat the
market” except through good
luck or better information.
The Price: reflects all publicly
available information on each
security
38. 1. Weak-form EMH:
Can’t profit by looking at past
trends. A recent decline is no
reason to think stocks will go up
(or down) in the future.
Evidence supports weak-form
EMH, but “technical analysis” is
still used.
39. 2. Semistrong-form EMH:
All publicly available
information is reflected in
stock prices, so doesn’t pay to
pore over annual reports
looking for undervalued
stocks. Largely true, but
superior analysts can still
profit by finding and using new
information.
40. 3. Strong-form EMH:
All information, even inside
information, is embedded in
stock prices. Not true--insiders
can gain by trading on the basis
of insider information, but that’s
illegal.
41. Markets are generally efficient because:
1. 15,000 or so trained analysts; MBAs,
CFAs, Technical PhDs.
2. Work for firms like Merrill, Morgan,
Prudential, which have a lot of money.
3. Have similar access to data.
4. Thus, news is reflected in P0 almost
instantaneously.
42. Preferred Stock
Hybrid security.
Similar to bonds in that preferred stockholders
receive a fixed dividend that must be paid before
dividends can be paid on common stock.
However, unlike interest payments on bonds,
companies can omit dividend payments on
preferred stock without fear of pushing the firm
into bankruptcy.
43. What’s the expected return of preferred
stock with Vp = $50 and annual dividend =
$5?
%.
0
.
10
10
.
0
50
$
5
$
5
$
50
$
=
=
=
=
=
p
p
p
r
r
V