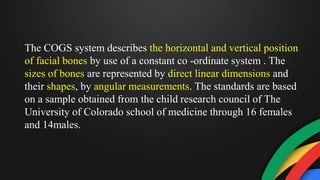
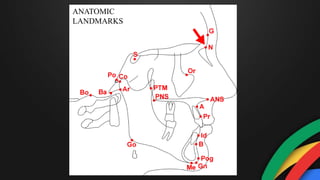
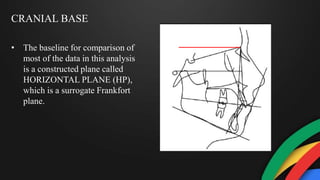
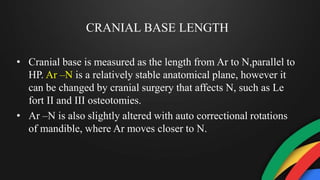
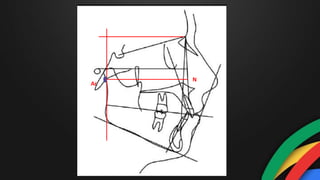
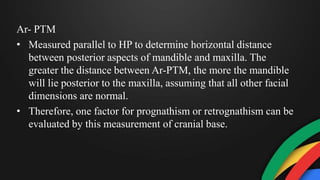
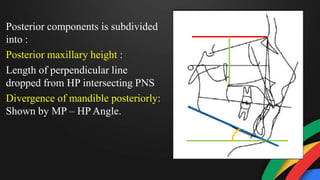
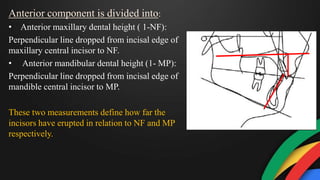
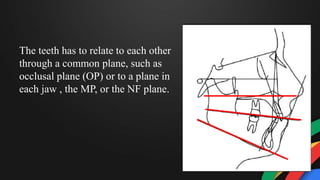
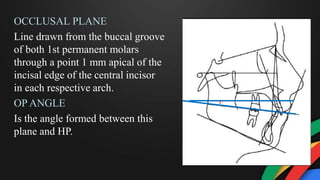
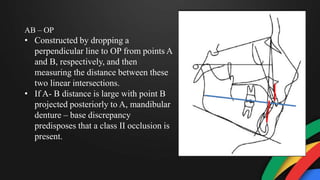
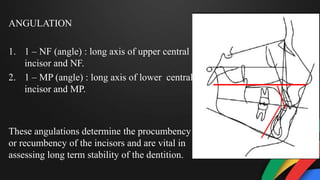
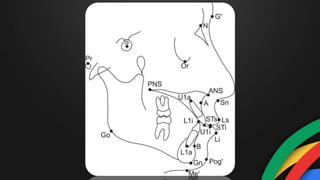
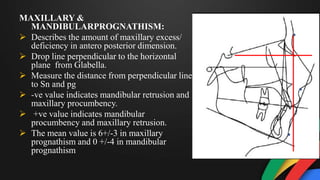
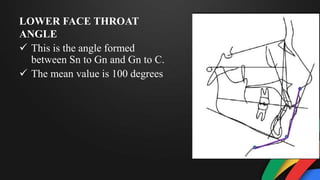
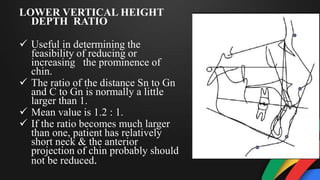
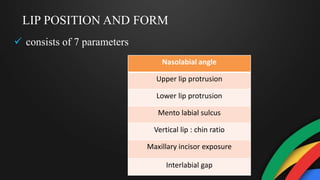
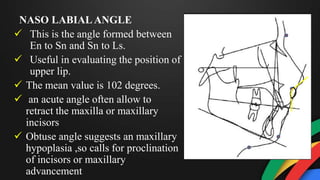
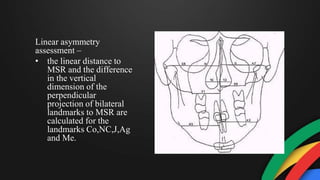
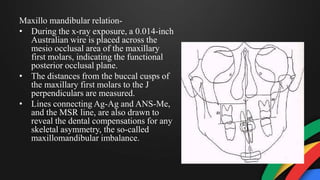
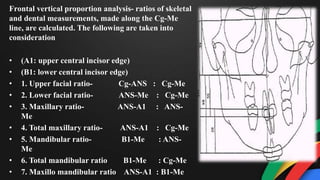
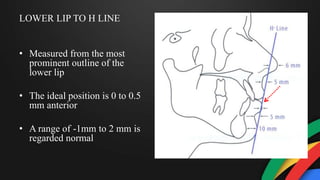
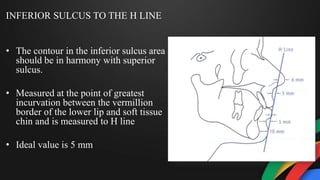
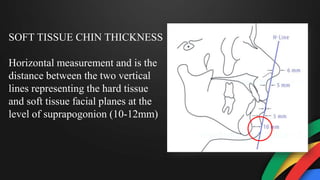
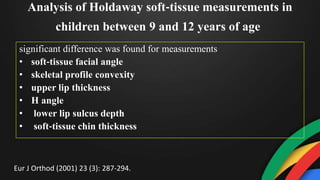
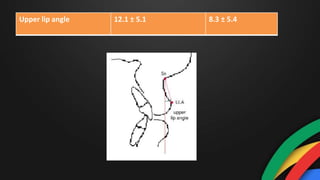
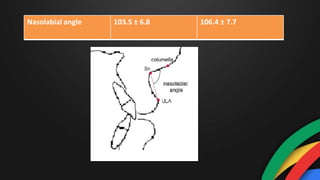
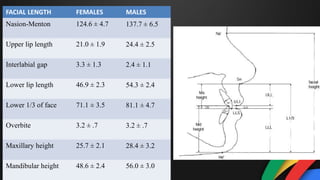
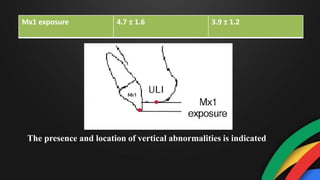
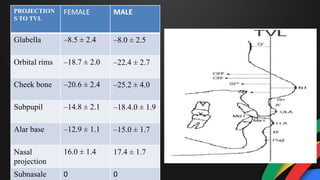
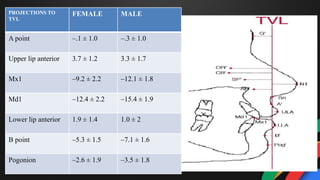
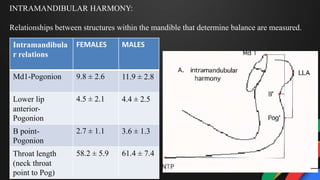
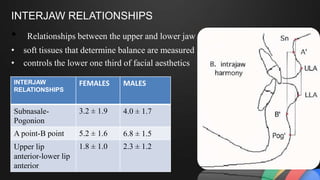
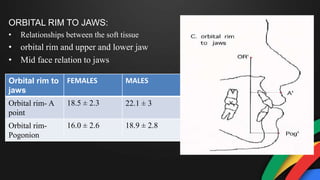
CEPHALOMETRIC ANALYSIS
CONTENTS
• COGS ANALYSIS
• GRUMMONS ANALYSIS
• HOLDAWAY ANALYSIS
• ARNNET AND BREGMAN ANALYSIS
COGS ANALYSIS
CEPHALOMETRICS FOR ORTHOGNATHIC SURGERY (COGS)
The COGS system describes the horizontal and vertical position
of facial bones by use of a constant co -ordinate system . The
sizes of bones are represented by direct linear dimensions and
their shapes, by angular measurements. The standards are based
on a sample obtained from the child research council of The
University of Colorado school of medicine through 16 females
and 14males.
DENTAL
SKELETAL
SOFT TISSUE
VARIATIONS
ANATOMIC
LANDMARKS
CRANIAL BASE
• The baseline for comparison of
most of the data in this analysis
is a constructed plane called
HORIZONTAL PLANE (HP),
which is a surrogate Frankfort
plane.
CRANIAL BASE LENGTH
• Cranial base is measured as the length from Ar to N,parallel to
HP. Ar –N is a relatively stable anatomical plane, however it
can be changed by cranial surgery that affects N, such as Le
fort II and III osteotomies.
• Ar –N is also slightly altered with auto correctional rotations
of mandible, where Ar moves closer to N.
Ar
N
Ar- PTM
• Measured parallel to HP to determine horizontal distance
between posterior aspects of mandible and maxilla. The
greater the distance between Ar-PTM, the more the mandible
will lie posterior to the maxilla, assuming that all other facial
dimensions are normal.
• Therefore, one factor for prognathism or retrognathism can be
evaluated by this measurement of cranial base.
Ar PTM N
HORIZONTAL SKELETAL PROFILE
The measurements are made parallel to HP, since most surgical
corrections are primarily done in anteroposterior direction. These
include:
• Degree of Skeletal Convexity
• N-B
• N- PG
Degree of Skeletal Convexity
• The N-A –Pg (Angle)gives an
indication of the overall facial
convexity. A positive (+) angle of
convexity denotes a convex face;
a negative (-) angle denotes a
concave face. A perpendicular
from HP is dropped through N.
The horizontal position of A is
measured to this perpendicular
line ( N-A).
N
A
POG
N-B
• Also measured in a plane parallel to HP from the
perpendicular line dropped from N. This measurement
describes the horizontal position of the apical base of
mandible in relation to N.
• Useful in planning the treatment of anterior mandibular
horizontal advancement or reduction and the total
mandibular horizontal advancement or reduction
N- PG
Measured in the same manner as N-A and N-B and
indicates the prominence of the chin. This
measurement helps to determine if there is a
horizontal genial hyperplasia or hypoplasia.
Useful in the planning of treatment augmentation or
reduction genioplasty, or anterior mandibular
horizontal advancement or reduction, and of total
mandibular horizontal advancement or reduction.
Thus we can see that the measurements of the horizontal skeletal
profile represents:
• Facial convexity
• Horizontal relationship of apical base A and B points
• And the chin positions related to N.
VERTICAL SKELETALAND DENTAL
PARAMETERS
SKELETAL
• A vertical skeletal discrepancy may reflect an anterior,
posterior or complex dysplasia of face. Vertical skeletal
cephalometric measurements are divided into
• Anterior components
• Posterior components
• Anterior components is
subdivided into
Middle third facial height :
• Distance from N to ANS is
measured perpendicular to
HP.
Lower third facial height :
• ANS – GN, measured
perpendicular to HP
Posterior components is subdivided
into :
Posterior maxillary height :
Length of perpendicular line
dropped from HP intersecting PNS
Divergence of mandible posteriorly:
Shown by MP – HP Angle.
Surgical correction of these problems include total maxillary
vertical advancement or reduction, anterior maxillary vertical
augmentation or reduction, posterior maxillary vertical
augmentation or reduction, combinations of the above two and
mandibular ramus rotation and ramus height reduction.
DENTAL
Assessment of vertical dental dysplasia is also
divided into
 Anterior component
 Posterior component
Anterior component is divided into:
• Anterior maxillary dental height ( 1-NF):
Perpendicular line dropped from incisal edge of
maxillary central incisor to NF.
• Anterior mandibular dental height (1- MP):
Perpendicular line dropped from incisal edge of
mandible central incisor to MP.
These two measurements define how far the
incisors have erupted in relation to NF and MP
respectively.
Posterior component is divided into:
• Posterior maxillary dental height :
Perpendicular line through
maxillary 1st molar mesiobuccal
cusp tip to NF
• Posterior mandibular dental height :
Perpendicular line through
mandibular 1st molar mesiobuccal
cusp tip to MP.
MAXILLARY LENGTH
• Distance from PNS– ANS
that is projected on a line
parallel to the HP.
• This measurement
alongwith the N-ANS and
PNS– N gives a quantitative
description of the maxilla in
the skull complex.
MANDIBULAR LENGTH
Ar - Go : Length of Mandibular ramus
Go - Pg : Length of Mandibular body
Ar - Go - Gn Angle : Gonial angle that
represents the relationship between
ramal plane and MP.
B - Pg : Distance from B point to line
perpendicular to MP through Pg
describes chin prominence
These measurements are helpful in the diagnosis of variations in
ramus height, that effect open bite or deep bite problems,
increased or diminished mandibular body length, acute or obtuse
Go angles that also contribute to skeletal open or closed bite, and
finally, as an assessment of chin prominence.
The teeth has to relate to each other
through a common plane, such as
occlusal plane (OP) or to a plane in
each jaw , the MP, or the NF plane.
OCCLUSAL PLANE
Line drawn from the buccal groove
of both 1st permanent molars
through a point 1 mm apical of the
incisal edge of the central incisor
in each respective arch.
OP ANGLE
Is the angle formed between this
plane and HP.
INCREASED OP- HP
• Skeletal open bite
• Lip incompetence
• Increased facial height
• Retrognathia
• Increased MP angle
DECREASED OP- HP
• Deep bite
• Decreased facial height
• Lip redundancy
AB – OP
• Constructed by dropping a
perpendicular line to OP from points A
and B, respectively, and then
measuring the distance between these
two linear intersections.
• If A- B distance is large with point B
projected posteriorly to A, mandibular
denture – base discrepancy
predisposes that a class II occlusion is
present.
ANGULATION
1. 1 – NF (angle) : long axis of upper central
incisor and NF.
2. 1 – MP (angle) : long axis of lower central
incisor and MP.
These angulations determine the procumbency
or recumbency of the incisors and are vital in
assessing long term stability of the dentition.
SOFT TISSUE ANALYSIS
FACIAL
FORM
LIP POSITION
&
FORM
FACIAL FORM
• Describes the overall horizontal soft tissue profile
• Consists of 5 parameters
FACIAL CONVEXITY ANGLE (G- Sn – Pg)
MAXILLARY PROGNATHISM G – Sn (ll HP)
MANDIBULAR PROGNATHISM G – Pg (ll HP)
LOWER FACE THROAT ANGLE Sn – Gn - C
LOWER VERTICAL HEIGHT – DEPTH RATIO Sn – Gn
FACIAL CONVEXITY ANGLE:-
• This is the angle formed between
the G-Sn to Sn-Pog line.
• To analyse the soft tissue profile.
• The mean value is 12 degrees.
• + ve value indicate convex
profile and – ve value indicate
concave profile
MAXILLARY &
MANDIBULARPROGNATHISM:
 Describes the amount of maxillary excess/
deficiency in antero posterior dimension.
 Drop line perpendicular to the horizontal
plane from Glabella.
 Measure the distance from perpendicular line
to Sn and pg
 -ve value indicates mandibular retrusion and
maxillary procumbency.
 +ve value indicates mandibular
procumbency and maxillary retrusion.
 The mean value is 6+/-3 in maxillary
prognathism and 0 +/-4 in mandibular
prognathism
LOWER FACE THROAT
ANGLE
 This is the angle formed
between Sn to Gn and Gn to C.
 The mean value is 100 degrees
LOWER VERTICAL HEIGHT
DEPTH RATIO
 Useful in determining the
feasibility of reducing or
increasing the prominence of
chin.
 The ratio of the distance Sn to Gn
and C to Gn is normally a little
larger than 1.
 Mean value is 1.2 : 1.
 If the ratio becomes much larger
than one, patient has relatively
short neck & the anterior
projection of chin probably should
not be reduced.
LIP POSITION AND FORM
 consists of 7 parameters
Nasolabial angle
Upper lip protrusion
Lower lip protrusion
Mento labial sulcus
Vertical lip : chin ratio
Maxillary incisor exposure
Interlabial gap
NASO LABIALANGLE
 This is the angle formed between
En to Sn and Sn to Ls.
 Useful in evaluating the position of
upper lip.
 The mean value is 102 degrees.
 an acute angle often allow to
retract the maxilla or maxillary
incisors
 Obtuse angle suggests an maxillary
hypoplasia ,so calls for proclination
of incisors or maxillary
advancement
UPPER & LOWER LIP
PROTRUSION
• Evaluates the antero posterior lip
position.
• Drawing a line from Sn to Pog.
• Ls to Sn-Pog line gives the amount of
upper lip protrusion. The mean value
should be 3 mm.
• Li to Sn-Pog line will give the
amount of lower lip protrusion. The
mean value is 2mm
MENTO LABIAL SULCUS:-
 To assess the chin prominence
 Depth is measured from the line
Li –Pg
 The average value is 4 mm.
VERTICAL LIP-CHIN RATIO
 To assess the lower 3rd face.
 This is the ratio of Sn-Sts and
Sti-Me.
 Mean value is 1 : 2 ratio
 When the ratio become less than
normal ( one ½ ) - vertical
reduction genioplasty is
recommended.
Sts
Sti
MAXILLARY INCISOR EXPOSURE
 Key factor in determining the position of maxilla.
 It is measured from tip of the maxillary incisors to Stm.
 Drop a line parallel to HP from Stm and another line from
U1.
 2mm of incisor showing below the upper lip with lip at
rest is normal.
 Pt with VME tend to show large amount of incisor
exposure.
Analysis of cephalometrics for orthognathic surgery:
Determination of norms applicable to Rajasthani
population
• Comparison between Rajasthani males and females revealed
males had increased anterior cranial base length. Females had increased
middle and lower third facial height, anterior divergence of mandible, Females
also had decreased maxillary and mandibular anterior and posterior dental
height, which is in agreement with the Burstone analysis. Rajasthani males had
proclined upper anteriors and females had proclined lower anteriors.
• To compare the craniofacial pattern of Rajasthani population with Caucasian norms.
• To evaluate the skeletal, dental variation between Rajasthani males and females
• COGS analysis comparison between Rajasthani population with Caucasian
population revealed an increase in the anterior cranial base length, length
of maxilla, mandibular ramus and body of mandible in Rajasthani females
compared with the Caucasian females. They represent increased middle and
lower third facial height, posterior maxillary height and anterior divergence
of the mandible.
• In dental parameters, Rajasthani males had decreased mandibular dental
height in anterior and posterior regions. Rajasthani females had increased
maxillary dental height in both anterior and posterior regions and decreased
mandibular anterior dental height.
• Rajasthanis had proclined and forwardly placed upper and lower incisors,
which was indicative of bimaxillary protrusion as compared with
Caucasian
Natl J Maxillofac Surg. 2010 Jul-Dec; 1(2): 102–107.
GRUMMON’S ANALYSIS
• It is a comparative and quantitative PA analysis ,not related to
any normative data.
• Comprehensive frontal asymmetry
analysis
• Summary frontal asymmetry
analysis
Antegonion( ag)
The highest point in the
antegonial notch
Condylion(co)- the most superior
point of condylar head
Anterior nasal spine(ans)-tip of
nasal spine below nasal cavity
and above hard palate
Incision inferior frontale(iif)-
The midpoint between the
mandibular central incisors at the
level of the incisal edges
The midpoint between the
maxillary central incisors at the
level of the incisal edges
Incision superior frontale(isf)
It is located by projecting
the mental spine on the
lower mandibular border,
perpendicular to the line
ag-ag
Mandibular midpoint(m)-
The most prominent lateral point
on the buccal surface of the
second deciduous or first
permanent mandibular molar
Mandibular molar (lm)
Jugal process
The point at which the temporal and
frontal processes of the zygomatic bone
meet
The most prominent lateral point
on the buccal surface of the
second deciduous or first
maxillary molar
Maxillary molar (um)
The analysis consists of different components including
• Horizontal planes,
• Mandibular morphology,
• Volumetric comparison,
• Maxillomandibular comparison of asymmetry,
• Linear asymmetry assessment,
• Maxillo mandibular relation and
• Frontal vertical proportions
Construction of horizontal planes- 4
horizontal planes are constructed:
• one connecting the medial aspects of
the zygomatico frontal sutures(Z)
• one connecting the centres of the
zygomatic arches (ZA)
• one connecting the medial aspects of
the jugal processes (J)
• one parallel to the Z- Plane through
the menton.
Z Z
ZA ZA
J J
• A mid saggital reference line
(MSR) is constructed from crista
galli (Cg) through the anterior
nasal spine (ANS) to the chin
area.
Mandibular morphology analysis
• Left sided and right sided
triangles are formed between
the head of the condyle (Co) to
the antegonial notch (Ag) and
menton (Me).
• A vertical line from the ANS to
the menton (Me) visualizes the
mid saggital plane in the lower
face.
Volumetric comparison- four
connected points determine an
area , and here a connection is
made between the points:
• condylion (Co)
• antegonial notch (Ag)
• menton (Me)
• the intersection with a
perpendicular from Co to
MSR.
Maxillomandibular comparison
of asymmetry-
4 lines are constructed
• perpendicular to MSR from
Ag and from J, bilaterally
• lines connecting Cg and J
• lines from Cg to Ag.
• Two pairs of
triangles are formed
in this way and each
pair is bisected by
MSR.
• If symmetry is
present, the
constructed lines
also form the two
triangles, namely J-
Cg-J and Ag-Cg-Ag.
Linear asymmetry
assessment –
• the linear distance to
MSR and the difference
in the vertical
dimension of the
perpendicular
projection of bilateral
landmarks to MSR are
calculated for the
landmarks Co,NC,J,Ag
and Me.
Maxillo mandibular relation-
• During the x-ray exposure, a 0.014-inch
Australian wire is placed across the
mesio occlusal area of the maxillary
first molars, indicating the functional
posterior occlusal plane.
• The distances from the buccal cusps of
the maxillary first molars to the J
perpendiculars are measured.
• Lines connecting Ag-Ag and ANS-Me,
and the MSR line, are also drawn to
reveal the dental compensations for any
skeletal asymmetry, the so-called
maxillomandibular imbalance.
Frontal vertical proportion analysis- ratios of skeletal
and dental measurements, made along the Cg-Me
line, are calculated. The following are taken into
consideration
• (A1: upper central incisor edge)
• (B1: lower central incisor edge)
• 1. Upper facial ratio- Cg-ANS : Cg-Me
• 2. Lower facial ratio- ANS-Me : Cg-Me
• 3. Maxillary ratio- ANS-A1 : ANS-
Me
• 4. Total maxillary ratio- ANS-A1 : Cg-Me
• 5. Mandibular ratio- B1-Me : ANS-
Me
• 6. Total mandibular ratio B1-Me : Cg-Me
• 7. Maxillo mandibular ratio ANS-A1 : B1-Me
Volume 1987 Jul(448 - 465): A Frontal Asymmetry Analysis - DUANE C.
GRUMMONS, DDS, MSD, MA
HOLDAWAY’S ANALYSIS
Dr. Reed A. Holdaway
(1917 – 2009)
PARAMETERS OF SOFT TISSUE BALANCE
• SOFT TISSUE FACIAL ANGLE
• NOSE PROMINENCE
• UPPER LIP CURVATURE
• UPPER SULCUS DEPTH
• SKELETAL PROFILE CONVEXITY
• UPPER LIP THICKNESS
• UPPER LIP STRAIN
• H- LINE ANGLE
• LOWER LIP TO H LINE
• INFERIOR SULCUS TO THE H LINE
• SOFT TISSUE CHIN THICKNESS
SOFT TISSUE FACIAL
ANGLE
• Formed by intersection of
Frankforts horizontal plane
with soft tissue N-Pog
• The ideal angle is 91 with a
range of 7 degrees
NOSE PROMINENCE
• Measured by a line perpendicular
to frankfort horizontal plane and
running tangent to the vermilion
border of the upper lip
• The values under 14 mm are
considered small and those above
24mm are large /prominent
UPPER LIP CURVATURE
• Depth of the sulcus from a
reference line drawn tangent from
FH Plane to vermilion border to
the upper lip.
• AVG VALUE – 1 to 4.0 mm
UPPER SULCUS DEPTH
• Measurement of soft tissue
subnasale to H line.
• Ideal 5mm
• Ranges from 3 to 7
SKELETAL PROFILE
CONVEXITY
• Hard tissue measurement
• Skeletal convexity at point
A is measured from N-pog
Line to Point A
• Avg value - +2 TO -2 mm
UPPER LIP THICKNESS
• Located near the base of alveolar
process,3mm below point A
• It is below the influence of nasal
structures
• Helps in determining the amount of
lip strain or incompetency present
UPPER LIP STRAIN
• The measurement extends horizontally
from the vermilion border of the upper lip
to the labial surface of the maxillary
central incisor
• Ideally it should be approximately same
as the upper lip thickness(within 1 mm)
• If the measurement is less than upper lip
thickness the lips are considered strained
H- LINE ANGLE
• H line angle formed between
H-line and Line Joining soft
tissue N to Pog / facial plane
• Avg Value- 7- 15 Degrees
• Measures upper lip
prominence
RELATIONSHIP
BETWEEN H-LINE AND
SKELETAL CONVEXITY
AT POINT A
Volume 84, Number I July, 1983
LOWER LIP TO H LINE
• Measured from the most
prominent outline of the
lower lip
• The ideal position is 0 to 0.5
mm anterior
• A range of -1mm to 2 mm is
regarded normal
INFERIOR SULCUS TO THE H LINE
• The contour in the inferior sulcus area
should be in harmony with superior
sulcus.
• Measured at the point of greatest
incurvation between the vermillion
border of the lower lip and soft tissue
chin and is measured to H line
• Ideal value is 5 mm
SOFT TISSUE CHIN THICKNESS
Horizontal measurement and is the
distance between the two vertical
lines representing the hard tissue
and soft tissue facial planes at the
level of suprapogonion (10-12mm)
Analysis of Holdaway soft‐tissue measurements in
children between 9 and 12 years of age
significant difference was found for measurements
• soft‐tissue facial angle
• skeletal profile convexity
• upper lip thickness
• H angle
• lower lip sulcus depth
• soft‐tissue chin thickness
Eur J Orthod (2001) 23 (3): 287-294.
ARNNET AND BREGMAN
ANALYSIS
• A soft tissue cephalometric analysis for diagnosis and a
method for cephalometric treatment planning for aesthetic
correction of facial imbalance in a patient.
Dentoskeletal
factors
Soft tissue
structures
Facial lengths
TVL
projections
Harmony
values
The line passing through subnasale , perpendicular to
the natural head position
• When midface retrusion is diagnosed the TVL
is moved 1-2 mm anterior.
• These are anteroposterior measurements of soft
tissue overlying a hard tissue landmark.
• The horizontal distance for each individual
landmark, measured perpendicular to the TVL,
is termed the landmark’s absolute value
True
Vertical
Line
Am J Orthod Dentofacial Orthop 1999;116:239-53)
Dentoskeletal
factors
FEMALES MALES
Mx occlusal plane 95.6 ± 1.8 95.0 ±
1.4
Mx1 to Mx occlusal
plane
56.8 ± 2.5 57.8 ±
3.0
Md1 to Md occlusal
plane
64.3 ± 3.2 64.0 ±
4.0
Overjet 3.2 ± .4 3.2 ± .6
Overbite 3.2 ± .7 3.2 ± .7
SOFT
TISSUE
STRUCTURS
FEMALES MALES
Upper lip
thickness
12.6 ± 1.8 14.8 ± 1.4
Lower lip
thickness
13.6 ± 1.4 15.1 ± 1.2
Pogonion-
Pogonion’
11.8 ± 1.5 13.5 ± 2.3
Menton-
Menton’
7.4 ± 1.6 8.8 ± 1.3
Upper lip angle 12.1 ± 5.1 8.3 ± 5.4
Nasolabial angle 103.5 ± 6.8 106.4 ± 7.7
FACIAL LENGTH FEMALES MALES
Nasion-Menton 124.6 ± 4.7 137.7 ± 6.5
Upper lip length 21.0 ± 1.9 24.4 ± 2.5
Interlabial gap 3.3 ± 1.3 2.4 ± 1.1
Lower lip length 46.9 ± 2.3 54.3 ± 2.4
Lower 1/3 of face 71.1 ± 3.5 81.1 ± 4.7
Overbite 3.2 ± .7 3.2 ± .7
Maxillary height 25.7 ± 2.1 28.4 ± 3.2
Mandibular height 48.6 ± 2.4 56.0 ± 3.0
The presence and location of vertical abnormalities is indicated
Mx1 exposure 4.7 ± 1.6 3.9 ± 1.2
PROJECTION
S TO TVL
FEMALE MALE
Glabella –8.5 ± 2.4 –8.0 ± 2.5
Orbital rims –18.7 ± 2.0 –22.4 ± 2.7
Cheek bone –20.6 ± 2.4 –25.2 ± 4.0
Subpupil –14.8 ± 2.1 –18.4.0 ± 1.9
Alar base –12.9 ± 1.1 –15.0 ± 1.7
Nasal
projection
16.0 ± 1.4 17.4 ± 1.7
Subnasale 0 0
PROJECTIONS TO
TVL
FEMALE MALE
A point –.1 ± 1.0 –.3 ± 1.0
Upper lip anterior 3.7 ± 1.2 3.3 ± 1.7
Mx1 –9.2 ± 2.2 –12.1 ± 1.8
Md1 –12.4 ± 2.2 –15.4 ± 1.9
Lower lip anterior 1.9 ± 1.4 1.0 ± 2
B point –5.3 ± 1.5 –7.1 ± 1.6
Pogonion –2.6 ± 1.9 –3.5 ± 1.8
HARMONY VALUES
Measures facial structure’s balance and harmony
Harmony values examine four areas of balance:
• Intramandibular parts
• Interjaw relationships
• Orbits to jaws
• Total face
INTRAMANDIBULAR HARMONY:
Relationships between structures within the mandible that determine balance are measured.
Intramandibula
r relations
FEMALES MALES
Md1-Pogonion 9.8 ± 2.6 11.9 ± 2.8
Lower lip
anterior-
Pogonion
4.5 ± 2.1 4.4 ± 2.5
B point-
Pogonion
2.7 ± 1.1 3.6 ± 1.3
Throat length
(neck throat
point to Pog)
58.2 ± 5.9 61.4 ± 7.4
INTERJAW RELATIONSHIPS
• Relationships between the upper and lower jaw
• soft tissues that determine balance are measured
• controls the lower one third of facial aesthetics
INTERJAW
RELATIONSHIPS
FEMALES MALES
Subnasale-
Pogonion
3.2 ± 1.9 4.0 ± 1.7
A point-B point 5.2 ± 1.6 6.8 ± 1.5
Upper lip
anterior-lower lip
anterior
1.8 ± 1.0 2.3 ± 1.2
ORBITAL RIM TO JAWS:
• Relationships between the soft tissue
• orbital rim and upper and lower jaw
• Mid face relation to jaws
Orbital rim to
jaws
FEMALES MALES
Orbital rim- A
point
18.5 ± 2.3 22.1 ± 3
Orbital rim-
Pogonion
16.0 ± 2.6 18.9 ± 2.8
TOTAL FACE HARMONY:
• Relationships between the forehead, upper jaw,
and lower jaw are measured to get the facial
balance
Total face harmony FEMALES MALES
Facial angle 169.3 ± 3.4 169.4 ± 3.2
Glabella-A point 8.4 ± 2.7 7.8 ± 2.8
Glabella-Pogonion 5.9 ± 2.3 4.6 ± 2.2
CONCLUSION
For a successful orthodontic treatment a harmony between the
soft tissue structure and hard tissue structure should be present.To
achevie this harmony we should determine before hand that the
proposed orthodontic treatment will not result in adverse facial
change and the soft tissue cephalometrics plays a major role in it.
REFERENCES
• Holdaway RA (1983). A Soft Tissue Cephalometric Analysis and its Use in
Orthodontic Planning, Part I. American Journal of Orthodontics, 84: 1-28.
• Holdaway RA (1984). A Soft Tissue Cephalometric Analysis and its Use in
Orthodontic Planning, Part II. American Journal of Orthodontics, 85: 279-293
• Grummons DC, Kappeneye van de Coppelo MA (1987). A Frontal Asymmetrical
Analysis
• Soft tissue cephalometric analysis: Diagnosis and treatment planning of dentofacial
deformity(Am J Orthod Dentofacial Orthop 1999;116:239-53)
• Analysis of Holdaway soft‐tissue measurements in children between 9 and 12 years
of age ;Eur J Orthod (2001) 23 (3): 287-294
• Natl J Maxillofac Surg. 2010 Jul-Dec; 1(2): 102–107
• Radiographic Cephalometry; Alexander Jacobson and Richard Jacobson
THANKYOU

Cephalometric analysis

  • 1.
  • 2.
    CONTENTS • COGS ANALYSIS •GRUMMONS ANALYSIS • HOLDAWAY ANALYSIS • ARNNET AND BREGMAN ANALYSIS
  • 3.
  • 4.
  • 5.
    The COGS systemdescribes the horizontal and vertical position of facial bones by use of a constant co -ordinate system . The sizes of bones are represented by direct linear dimensions and their shapes, by angular measurements. The standards are based on a sample obtained from the child research council of The University of Colorado school of medicine through 16 females and 14males.
  • 6.
  • 7.
  • 8.
    CRANIAL BASE • Thebaseline for comparison of most of the data in this analysis is a constructed plane called HORIZONTAL PLANE (HP), which is a surrogate Frankfort plane.
  • 9.
    CRANIAL BASE LENGTH •Cranial base is measured as the length from Ar to N,parallel to HP. Ar –N is a relatively stable anatomical plane, however it can be changed by cranial surgery that affects N, such as Le fort II and III osteotomies. • Ar –N is also slightly altered with auto correctional rotations of mandible, where Ar moves closer to N.
  • 10.
  • 11.
    Ar- PTM • Measuredparallel to HP to determine horizontal distance between posterior aspects of mandible and maxilla. The greater the distance between Ar-PTM, the more the mandible will lie posterior to the maxilla, assuming that all other facial dimensions are normal. • Therefore, one factor for prognathism or retrognathism can be evaluated by this measurement of cranial base.
  • 12.
  • 13.
    HORIZONTAL SKELETAL PROFILE Themeasurements are made parallel to HP, since most surgical corrections are primarily done in anteroposterior direction. These include: • Degree of Skeletal Convexity • N-B • N- PG
  • 14.
    Degree of SkeletalConvexity • The N-A –Pg (Angle)gives an indication of the overall facial convexity. A positive (+) angle of convexity denotes a convex face; a negative (-) angle denotes a concave face. A perpendicular from HP is dropped through N. The horizontal position of A is measured to this perpendicular line ( N-A). N A POG
  • 15.
    N-B • Also measuredin a plane parallel to HP from the perpendicular line dropped from N. This measurement describes the horizontal position of the apical base of mandible in relation to N. • Useful in planning the treatment of anterior mandibular horizontal advancement or reduction and the total mandibular horizontal advancement or reduction
  • 16.
    N- PG Measured inthe same manner as N-A and N-B and indicates the prominence of the chin. This measurement helps to determine if there is a horizontal genial hyperplasia or hypoplasia. Useful in the planning of treatment augmentation or reduction genioplasty, or anterior mandibular horizontal advancement or reduction, and of total mandibular horizontal advancement or reduction.
  • 17.
    Thus we cansee that the measurements of the horizontal skeletal profile represents: • Facial convexity • Horizontal relationship of apical base A and B points • And the chin positions related to N.
  • 18.
    VERTICAL SKELETALAND DENTAL PARAMETERS SKELETAL •A vertical skeletal discrepancy may reflect an anterior, posterior or complex dysplasia of face. Vertical skeletal cephalometric measurements are divided into • Anterior components • Posterior components
  • 19.
    • Anterior componentsis subdivided into Middle third facial height : • Distance from N to ANS is measured perpendicular to HP. Lower third facial height : • ANS – GN, measured perpendicular to HP
  • 20.
    Posterior components issubdivided into : Posterior maxillary height : Length of perpendicular line dropped from HP intersecting PNS Divergence of mandible posteriorly: Shown by MP – HP Angle.
  • 21.
    Surgical correction ofthese problems include total maxillary vertical advancement or reduction, anterior maxillary vertical augmentation or reduction, posterior maxillary vertical augmentation or reduction, combinations of the above two and mandibular ramus rotation and ramus height reduction.
  • 22.
    DENTAL Assessment of verticaldental dysplasia is also divided into  Anterior component  Posterior component
  • 23.
    Anterior component isdivided into: • Anterior maxillary dental height ( 1-NF): Perpendicular line dropped from incisal edge of maxillary central incisor to NF. • Anterior mandibular dental height (1- MP): Perpendicular line dropped from incisal edge of mandible central incisor to MP. These two measurements define how far the incisors have erupted in relation to NF and MP respectively.
  • 24.
    Posterior component isdivided into: • Posterior maxillary dental height : Perpendicular line through maxillary 1st molar mesiobuccal cusp tip to NF • Posterior mandibular dental height : Perpendicular line through mandibular 1st molar mesiobuccal cusp tip to MP.
  • 25.
    MAXILLARY LENGTH • Distancefrom PNS– ANS that is projected on a line parallel to the HP. • This measurement alongwith the N-ANS and PNS– N gives a quantitative description of the maxilla in the skull complex.
  • 26.
    MANDIBULAR LENGTH Ar -Go : Length of Mandibular ramus Go - Pg : Length of Mandibular body Ar - Go - Gn Angle : Gonial angle that represents the relationship between ramal plane and MP. B - Pg : Distance from B point to line perpendicular to MP through Pg describes chin prominence
  • 27.
    These measurements arehelpful in the diagnosis of variations in ramus height, that effect open bite or deep bite problems, increased or diminished mandibular body length, acute or obtuse Go angles that also contribute to skeletal open or closed bite, and finally, as an assessment of chin prominence.
  • 28.
    The teeth hasto relate to each other through a common plane, such as occlusal plane (OP) or to a plane in each jaw , the MP, or the NF plane.
  • 29.
    OCCLUSAL PLANE Line drawnfrom the buccal groove of both 1st permanent molars through a point 1 mm apical of the incisal edge of the central incisor in each respective arch. OP ANGLE Is the angle formed between this plane and HP.
  • 30.
    INCREASED OP- HP •Skeletal open bite • Lip incompetence • Increased facial height • Retrognathia • Increased MP angle DECREASED OP- HP • Deep bite • Decreased facial height • Lip redundancy
  • 31.
    AB – OP •Constructed by dropping a perpendicular line to OP from points A and B, respectively, and then measuring the distance between these two linear intersections. • If A- B distance is large with point B projected posteriorly to A, mandibular denture – base discrepancy predisposes that a class II occlusion is present.
  • 32.
    ANGULATION 1. 1 –NF (angle) : long axis of upper central incisor and NF. 2. 1 – MP (angle) : long axis of lower central incisor and MP. These angulations determine the procumbency or recumbency of the incisors and are vital in assessing long term stability of the dentition.
  • 33.
  • 35.
  • 36.
    FACIAL FORM • Describesthe overall horizontal soft tissue profile • Consists of 5 parameters FACIAL CONVEXITY ANGLE (G- Sn – Pg) MAXILLARY PROGNATHISM G – Sn (ll HP) MANDIBULAR PROGNATHISM G – Pg (ll HP) LOWER FACE THROAT ANGLE Sn – Gn - C LOWER VERTICAL HEIGHT – DEPTH RATIO Sn – Gn
  • 37.
    FACIAL CONVEXITY ANGLE:- •This is the angle formed between the G-Sn to Sn-Pog line. • To analyse the soft tissue profile. • The mean value is 12 degrees. • + ve value indicate convex profile and – ve value indicate concave profile
  • 38.
    MAXILLARY & MANDIBULARPROGNATHISM:  Describesthe amount of maxillary excess/ deficiency in antero posterior dimension.  Drop line perpendicular to the horizontal plane from Glabella.  Measure the distance from perpendicular line to Sn and pg  -ve value indicates mandibular retrusion and maxillary procumbency.  +ve value indicates mandibular procumbency and maxillary retrusion.  The mean value is 6+/-3 in maxillary prognathism and 0 +/-4 in mandibular prognathism
  • 39.
    LOWER FACE THROAT ANGLE This is the angle formed between Sn to Gn and Gn to C.  The mean value is 100 degrees
  • 40.
    LOWER VERTICAL HEIGHT DEPTHRATIO  Useful in determining the feasibility of reducing or increasing the prominence of chin.  The ratio of the distance Sn to Gn and C to Gn is normally a little larger than 1.  Mean value is 1.2 : 1.  If the ratio becomes much larger than one, patient has relatively short neck & the anterior projection of chin probably should not be reduced.
  • 41.
    LIP POSITION ANDFORM  consists of 7 parameters Nasolabial angle Upper lip protrusion Lower lip protrusion Mento labial sulcus Vertical lip : chin ratio Maxillary incisor exposure Interlabial gap
  • 42.
    NASO LABIALANGLE  Thisis the angle formed between En to Sn and Sn to Ls.  Useful in evaluating the position of upper lip.  The mean value is 102 degrees.  an acute angle often allow to retract the maxilla or maxillary incisors  Obtuse angle suggests an maxillary hypoplasia ,so calls for proclination of incisors or maxillary advancement
  • 43.
    UPPER & LOWERLIP PROTRUSION • Evaluates the antero posterior lip position. • Drawing a line from Sn to Pog. • Ls to Sn-Pog line gives the amount of upper lip protrusion. The mean value should be 3 mm. • Li to Sn-Pog line will give the amount of lower lip protrusion. The mean value is 2mm
  • 44.
    MENTO LABIAL SULCUS:- To assess the chin prominence  Depth is measured from the line Li –Pg  The average value is 4 mm.
  • 45.
    VERTICAL LIP-CHIN RATIO To assess the lower 3rd face.  This is the ratio of Sn-Sts and Sti-Me.  Mean value is 1 : 2 ratio  When the ratio become less than normal ( one ½ ) - vertical reduction genioplasty is recommended. Sts Sti
  • 46.
    MAXILLARY INCISOR EXPOSURE Key factor in determining the position of maxilla.  It is measured from tip of the maxillary incisors to Stm.  Drop a line parallel to HP from Stm and another line from U1.  2mm of incisor showing below the upper lip with lip at rest is normal.  Pt with VME tend to show large amount of incisor exposure.
  • 47.
    Analysis of cephalometricsfor orthognathic surgery: Determination of norms applicable to Rajasthani population • Comparison between Rajasthani males and females revealed males had increased anterior cranial base length. Females had increased middle and lower third facial height, anterior divergence of mandible, Females also had decreased maxillary and mandibular anterior and posterior dental height, which is in agreement with the Burstone analysis. Rajasthani males had proclined upper anteriors and females had proclined lower anteriors. • To compare the craniofacial pattern of Rajasthani population with Caucasian norms. • To evaluate the skeletal, dental variation between Rajasthani males and females
  • 48.
    • COGS analysiscomparison between Rajasthani population with Caucasian population revealed an increase in the anterior cranial base length, length of maxilla, mandibular ramus and body of mandible in Rajasthani females compared with the Caucasian females. They represent increased middle and lower third facial height, posterior maxillary height and anterior divergence of the mandible. • In dental parameters, Rajasthani males had decreased mandibular dental height in anterior and posterior regions. Rajasthani females had increased maxillary dental height in both anterior and posterior regions and decreased mandibular anterior dental height. • Rajasthanis had proclined and forwardly placed upper and lower incisors, which was indicative of bimaxillary protrusion as compared with Caucasian Natl J Maxillofac Surg. 2010 Jul-Dec; 1(2): 102–107.
  • 49.
  • 51.
    • It isa comparative and quantitative PA analysis ,not related to any normative data. • Comprehensive frontal asymmetry analysis • Summary frontal asymmetry analysis
  • 53.
    Antegonion( ag) The highestpoint in the antegonial notch
  • 54.
    Condylion(co)- the mostsuperior point of condylar head
  • 55.
    Anterior nasal spine(ans)-tipof nasal spine below nasal cavity and above hard palate
  • 56.
    Incision inferior frontale(iif)- Themidpoint between the mandibular central incisors at the level of the incisal edges
  • 57.
    The midpoint betweenthe maxillary central incisors at the level of the incisal edges Incision superior frontale(isf)
  • 58.
    It is locatedby projecting the mental spine on the lower mandibular border, perpendicular to the line ag-ag Mandibular midpoint(m)-
  • 59.
    The most prominentlateral point on the buccal surface of the second deciduous or first permanent mandibular molar Mandibular molar (lm)
  • 60.
    Jugal process The pointat which the temporal and frontal processes of the zygomatic bone meet
  • 61.
    The most prominentlateral point on the buccal surface of the second deciduous or first maxillary molar Maxillary molar (um)
  • 62.
    The analysis consistsof different components including • Horizontal planes, • Mandibular morphology, • Volumetric comparison, • Maxillomandibular comparison of asymmetry, • Linear asymmetry assessment, • Maxillo mandibular relation and • Frontal vertical proportions
  • 63.
    Construction of horizontalplanes- 4 horizontal planes are constructed: • one connecting the medial aspects of the zygomatico frontal sutures(Z) • one connecting the centres of the zygomatic arches (ZA) • one connecting the medial aspects of the jugal processes (J) • one parallel to the Z- Plane through the menton. Z Z ZA ZA J J
  • 64.
    • A midsaggital reference line (MSR) is constructed from crista galli (Cg) through the anterior nasal spine (ANS) to the chin area.
  • 65.
    Mandibular morphology analysis •Left sided and right sided triangles are formed between the head of the condyle (Co) to the antegonial notch (Ag) and menton (Me). • A vertical line from the ANS to the menton (Me) visualizes the mid saggital plane in the lower face.
  • 66.
    Volumetric comparison- four connectedpoints determine an area , and here a connection is made between the points: • condylion (Co) • antegonial notch (Ag) • menton (Me) • the intersection with a perpendicular from Co to MSR.
  • 67.
    Maxillomandibular comparison of asymmetry- 4lines are constructed • perpendicular to MSR from Ag and from J, bilaterally • lines connecting Cg and J • lines from Cg to Ag.
  • 68.
    • Two pairsof triangles are formed in this way and each pair is bisected by MSR. • If symmetry is present, the constructed lines also form the two triangles, namely J- Cg-J and Ag-Cg-Ag.
  • 69.
    Linear asymmetry assessment – •the linear distance to MSR and the difference in the vertical dimension of the perpendicular projection of bilateral landmarks to MSR are calculated for the landmarks Co,NC,J,Ag and Me.
  • 70.
    Maxillo mandibular relation- •During the x-ray exposure, a 0.014-inch Australian wire is placed across the mesio occlusal area of the maxillary first molars, indicating the functional posterior occlusal plane. • The distances from the buccal cusps of the maxillary first molars to the J perpendiculars are measured. • Lines connecting Ag-Ag and ANS-Me, and the MSR line, are also drawn to reveal the dental compensations for any skeletal asymmetry, the so-called maxillomandibular imbalance.
  • 71.
    Frontal vertical proportionanalysis- ratios of skeletal and dental measurements, made along the Cg-Me line, are calculated. The following are taken into consideration • (A1: upper central incisor edge) • (B1: lower central incisor edge) • 1. Upper facial ratio- Cg-ANS : Cg-Me • 2. Lower facial ratio- ANS-Me : Cg-Me • 3. Maxillary ratio- ANS-A1 : ANS- Me • 4. Total maxillary ratio- ANS-A1 : Cg-Me • 5. Mandibular ratio- B1-Me : ANS- Me • 6. Total mandibular ratio B1-Me : Cg-Me • 7. Maxillo mandibular ratio ANS-A1 : B1-Me
  • 73.
    Volume 1987 Jul(448- 465): A Frontal Asymmetry Analysis - DUANE C. GRUMMONS, DDS, MSD, MA
  • 74.
  • 75.
    Dr. Reed A.Holdaway (1917 – 2009)
  • 76.
    PARAMETERS OF SOFTTISSUE BALANCE • SOFT TISSUE FACIAL ANGLE • NOSE PROMINENCE • UPPER LIP CURVATURE • UPPER SULCUS DEPTH • SKELETAL PROFILE CONVEXITY • UPPER LIP THICKNESS • UPPER LIP STRAIN • H- LINE ANGLE • LOWER LIP TO H LINE • INFERIOR SULCUS TO THE H LINE • SOFT TISSUE CHIN THICKNESS
  • 78.
    SOFT TISSUE FACIAL ANGLE •Formed by intersection of Frankforts horizontal plane with soft tissue N-Pog • The ideal angle is 91 with a range of 7 degrees
  • 79.
    NOSE PROMINENCE • Measuredby a line perpendicular to frankfort horizontal plane and running tangent to the vermilion border of the upper lip • The values under 14 mm are considered small and those above 24mm are large /prominent
  • 80.
    UPPER LIP CURVATURE •Depth of the sulcus from a reference line drawn tangent from FH Plane to vermilion border to the upper lip. • AVG VALUE – 1 to 4.0 mm
  • 81.
    UPPER SULCUS DEPTH •Measurement of soft tissue subnasale to H line. • Ideal 5mm • Ranges from 3 to 7
  • 82.
    SKELETAL PROFILE CONVEXITY • Hardtissue measurement • Skeletal convexity at point A is measured from N-pog Line to Point A • Avg value - +2 TO -2 mm
  • 83.
    UPPER LIP THICKNESS •Located near the base of alveolar process,3mm below point A • It is below the influence of nasal structures • Helps in determining the amount of lip strain or incompetency present
  • 84.
    UPPER LIP STRAIN •The measurement extends horizontally from the vermilion border of the upper lip to the labial surface of the maxillary central incisor • Ideally it should be approximately same as the upper lip thickness(within 1 mm) • If the measurement is less than upper lip thickness the lips are considered strained
  • 85.
    H- LINE ANGLE •H line angle formed between H-line and Line Joining soft tissue N to Pog / facial plane • Avg Value- 7- 15 Degrees • Measures upper lip prominence
  • 86.
    RELATIONSHIP BETWEEN H-LINE AND SKELETALCONVEXITY AT POINT A Volume 84, Number I July, 1983
  • 87.
    LOWER LIP TOH LINE • Measured from the most prominent outline of the lower lip • The ideal position is 0 to 0.5 mm anterior • A range of -1mm to 2 mm is regarded normal
  • 88.
    INFERIOR SULCUS TOTHE H LINE • The contour in the inferior sulcus area should be in harmony with superior sulcus. • Measured at the point of greatest incurvation between the vermillion border of the lower lip and soft tissue chin and is measured to H line • Ideal value is 5 mm
  • 89.
    SOFT TISSUE CHINTHICKNESS Horizontal measurement and is the distance between the two vertical lines representing the hard tissue and soft tissue facial planes at the level of suprapogonion (10-12mm)
  • 90.
    Analysis of Holdawaysoft‐tissue measurements in children between 9 and 12 years of age significant difference was found for measurements • soft‐tissue facial angle • skeletal profile convexity • upper lip thickness • H angle • lower lip sulcus depth • soft‐tissue chin thickness Eur J Orthod (2001) 23 (3): 287-294.
  • 91.
  • 92.
    • A softtissue cephalometric analysis for diagnosis and a method for cephalometric treatment planning for aesthetic correction of facial imbalance in a patient. Dentoskeletal factors Soft tissue structures Facial lengths TVL projections Harmony values
  • 93.
    The line passingthrough subnasale , perpendicular to the natural head position • When midface retrusion is diagnosed the TVL is moved 1-2 mm anterior. • These are anteroposterior measurements of soft tissue overlying a hard tissue landmark. • The horizontal distance for each individual landmark, measured perpendicular to the TVL, is termed the landmark’s absolute value True Vertical Line Am J Orthod Dentofacial Orthop 1999;116:239-53)
  • 94.
    Dentoskeletal factors FEMALES MALES Mx occlusalplane 95.6 ± 1.8 95.0 ± 1.4 Mx1 to Mx occlusal plane 56.8 ± 2.5 57.8 ± 3.0 Md1 to Md occlusal plane 64.3 ± 3.2 64.0 ± 4.0 Overjet 3.2 ± .4 3.2 ± .6 Overbite 3.2 ± .7 3.2 ± .7
  • 95.
    SOFT TISSUE STRUCTURS FEMALES MALES Upper lip thickness 12.6± 1.8 14.8 ± 1.4 Lower lip thickness 13.6 ± 1.4 15.1 ± 1.2 Pogonion- Pogonion’ 11.8 ± 1.5 13.5 ± 2.3 Menton- Menton’ 7.4 ± 1.6 8.8 ± 1.3
  • 96.
    Upper lip angle12.1 ± 5.1 8.3 ± 5.4
  • 97.
    Nasolabial angle 103.5± 6.8 106.4 ± 7.7
  • 98.
    FACIAL LENGTH FEMALESMALES Nasion-Menton 124.6 ± 4.7 137.7 ± 6.5 Upper lip length 21.0 ± 1.9 24.4 ± 2.5 Interlabial gap 3.3 ± 1.3 2.4 ± 1.1 Lower lip length 46.9 ± 2.3 54.3 ± 2.4 Lower 1/3 of face 71.1 ± 3.5 81.1 ± 4.7 Overbite 3.2 ± .7 3.2 ± .7 Maxillary height 25.7 ± 2.1 28.4 ± 3.2 Mandibular height 48.6 ± 2.4 56.0 ± 3.0
  • 99.
    The presence andlocation of vertical abnormalities is indicated Mx1 exposure 4.7 ± 1.6 3.9 ± 1.2
  • 100.
    PROJECTION S TO TVL FEMALEMALE Glabella –8.5 ± 2.4 –8.0 ± 2.5 Orbital rims –18.7 ± 2.0 –22.4 ± 2.7 Cheek bone –20.6 ± 2.4 –25.2 ± 4.0 Subpupil –14.8 ± 2.1 –18.4.0 ± 1.9 Alar base –12.9 ± 1.1 –15.0 ± 1.7 Nasal projection 16.0 ± 1.4 17.4 ± 1.7 Subnasale 0 0
  • 101.
    PROJECTIONS TO TVL FEMALE MALE Apoint –.1 ± 1.0 –.3 ± 1.0 Upper lip anterior 3.7 ± 1.2 3.3 ± 1.7 Mx1 –9.2 ± 2.2 –12.1 ± 1.8 Md1 –12.4 ± 2.2 –15.4 ± 1.9 Lower lip anterior 1.9 ± 1.4 1.0 ± 2 B point –5.3 ± 1.5 –7.1 ± 1.6 Pogonion –2.6 ± 1.9 –3.5 ± 1.8
  • 102.
    HARMONY VALUES Measures facialstructure’s balance and harmony Harmony values examine four areas of balance: • Intramandibular parts • Interjaw relationships • Orbits to jaws • Total face
  • 103.
    INTRAMANDIBULAR HARMONY: Relationships betweenstructures within the mandible that determine balance are measured. Intramandibula r relations FEMALES MALES Md1-Pogonion 9.8 ± 2.6 11.9 ± 2.8 Lower lip anterior- Pogonion 4.5 ± 2.1 4.4 ± 2.5 B point- Pogonion 2.7 ± 1.1 3.6 ± 1.3 Throat length (neck throat point to Pog) 58.2 ± 5.9 61.4 ± 7.4
  • 104.
    INTERJAW RELATIONSHIPS • Relationshipsbetween the upper and lower jaw • soft tissues that determine balance are measured • controls the lower one third of facial aesthetics INTERJAW RELATIONSHIPS FEMALES MALES Subnasale- Pogonion 3.2 ± 1.9 4.0 ± 1.7 A point-B point 5.2 ± 1.6 6.8 ± 1.5 Upper lip anterior-lower lip anterior 1.8 ± 1.0 2.3 ± 1.2
  • 105.
    ORBITAL RIM TOJAWS: • Relationships between the soft tissue • orbital rim and upper and lower jaw • Mid face relation to jaws Orbital rim to jaws FEMALES MALES Orbital rim- A point 18.5 ± 2.3 22.1 ± 3 Orbital rim- Pogonion 16.0 ± 2.6 18.9 ± 2.8
  • 106.
    TOTAL FACE HARMONY: •Relationships between the forehead, upper jaw, and lower jaw are measured to get the facial balance Total face harmony FEMALES MALES Facial angle 169.3 ± 3.4 169.4 ± 3.2 Glabella-A point 8.4 ± 2.7 7.8 ± 2.8 Glabella-Pogonion 5.9 ± 2.3 4.6 ± 2.2
  • 108.
    CONCLUSION For a successfulorthodontic treatment a harmony between the soft tissue structure and hard tissue structure should be present.To achevie this harmony we should determine before hand that the proposed orthodontic treatment will not result in adverse facial change and the soft tissue cephalometrics plays a major role in it.
  • 109.
    REFERENCES • Holdaway RA(1983). A Soft Tissue Cephalometric Analysis and its Use in Orthodontic Planning, Part I. American Journal of Orthodontics, 84: 1-28. • Holdaway RA (1984). A Soft Tissue Cephalometric Analysis and its Use in Orthodontic Planning, Part II. American Journal of Orthodontics, 85: 279-293 • Grummons DC, Kappeneye van de Coppelo MA (1987). A Frontal Asymmetrical Analysis • Soft tissue cephalometric analysis: Diagnosis and treatment planning of dentofacial deformity(Am J Orthod Dentofacial Orthop 1999;116:239-53) • Analysis of Holdaway soft‐tissue measurements in children between 9 and 12 years of age ;Eur J Orthod (2001) 23 (3): 287-294 • Natl J Maxillofac Surg. 2010 Jul-Dec; 1(2): 102–107 • Radiographic Cephalometry; Alexander Jacobson and Richard Jacobson
  • 110.

Editor's Notes

  • #5 The successful treatment of the orthognathic surgical patient is dependant on careful diagnosis.Cephalometric analysis can be an aid in the diagnosis of skeletal and dental problems and a tool for stimulating surgery and orthodontics by the use of acetate overlays. The first step in the diagnosis of the orthognathic surgical patient is to determine the nature of dental and skeletal defects. Patients who require orthognathic surgery usually have facial bones as well as tooth positions that must be modified by a combined orthodontic and surgical treatment. For this reason, a specialized cephalometric appraisal system, called CEPHALOMETRICS FOR ORTHOGNATHIC SURGERY (COGS) was developed at The University of Connecticut.
  • #8 SELLA (S) : Centre of pituitary fossa. NASION (N) : Most anterior point of nasofrontal suture in the midsagittal plane. ARTICULARE (Ar): Intersection of basisphenoid and posterior border of the condyle. PTERYGOMAXILLARY : Most posterior point on the FISURE (PTM) anterior contour of maxillary tuberosity. SUB SPINALE (A) : Deepest point in midsagital plane between ANS and Prosthion POGONION (Pg) : Most anterior point in midsagittal plane of the contour of the chin. SUPRAMENTALE (B) :Deepest point in the midsagittal plane between Infradentale and Pg. ANS : Most anterior point of nasal floor. MENTON (Me) : Lowest point of the contour of mandibular symphysis. GNATHION (Gn) : Mid point between Pg and Me. MANDIBULAR PLANE : Plane constructed(MP) from Me to the angle of Mandible (Go) NASAL FLOOR (NF) : Plane constructed from PNS to ANS GONION (Go) : Located by bisecting posterior ramal plane and MPA
  • #9 constructed by drawing a line 7 o from the line S to N.
  • #11 Ar –N is a relatively stable anatomical plane, however it can be changed by cranial surgery that affects N, such as Le fort II and III osteotomies. Ar –N is also slightly altered with auto correctional rotations of mandible, where Ar moves closer to N.
  • #15 This measurement describes the apical base of maxilla in relation to N and enables the clinician to determine if the anterior part of maxilla is protrusive or retrusive. Useful in planning treatment of anterior maxillary horizontal advancement or reduction, and of total maxillary horizontal advancement or reductions.
  • #21 Vertical skeletal measurements of the anterior and posterior components of the face will help in the diagnosis of anterior, posterior, or total vertical maxillary hyperplasia or hypoplasia, and clockwise or counter - clockwise rotations of the maxilla and mandible.
  • #30 If the teeth over lap anteriorly to produce an overbite, the OP can be drawn as a single line.
  • #34 The soft tissue covering the teeth and bone is highly variable in it’s thickness and this variation may be greater than the variation found in hard tissues. treatment planning should include the soft tissue analysis.
  • #35 Soft tissue landmark
  • #40 An obtuse lower face angle indicates that any procedure that reduce the prominence should not be done
  • #46 stomion inferiusStiHighest midline point of lower lip stomion superiusStsHighest midline point of upper lip
  • #47 Burstone analysis will definitely help the orthodontist and the maxillofacial surgeon in successfully treating orthognathic surgery patients and in establishing an esthetic, harmonious and stable relationship of the cranial base, jaws and teeth.
  • #48 To compare the craniofacial pattern of Rajasthani population with Caucasian norms. To evaluate the skeletal, dental variation between Rajasthani males and females
  • #51 Since the advent of cephalometric radiography, orthodontists have focused on the lateral x-ray as their primary source of patient skeletal and data. However, the frontal (PA) and basilar views also contain valuable information for diagnosis and treatment procedures. Various dental and skeletal widths and skeletal asymmetries that are not available from the lateral cephalogram can be quantified from a frontal radiograph.
  • #65 An alternative way of constructing the MSR line, if anatomical variations in the upper and middle facial regions exist, is to draw a line from the midpoint of Z- plane either through ANS or through the midpoint of both foramen rotundum (Fr-Fr) line.
  • #74 This analysis is intended to provide a practical, functional method of determining the locations and amounts of facial asymmetry. It is of greatest clinical value when integrated with data from lateral and submental vertex radiographs.
  • #78 Reference lines used are:
  • #82 H line-tangent to the chin and upper lip
  • #91 43 lateral cephalometric radiographs from 20 boys and 23 girls subjects were used to determine the Holdaway soft tissue growth changes. Subjects with Class I occlusions, balanced skeletal profiles, normal growth and development, and no orthodontic treatment history were included in the investigation  The following measurements during the observation period were statistically different: soft‐tissue facial angle (P < 0.01 in girls, P < 0.05 boys), nose prominence (P < 0.001 in girls and boys), skeletal profile convexity (P < 0.001 in girls, P < 0.01 in boys), basic upper lip thickness (P < 0.001 in girls and boys), upper lip thickness (P < 0.05 in girls, P < 0.001 in boys), H angle (P < 0.001 in girls), lower lip sulcus depth (P < 0.001 in girls and boys), and soft‐tissue chin thickness (P < 0.001 in girls, P < 0.001 in boys).
  • #93 The STCA can be used to diagnose the patient in five different but interrelated areas
  • #96 Soft tissue thickness in combination with dentoskeletal factors largely control lower facial aesthetic balance