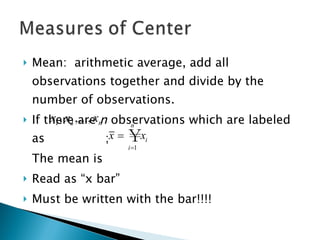
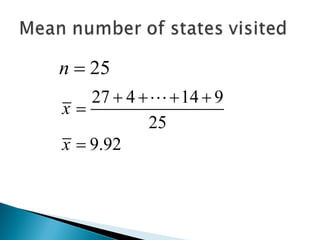
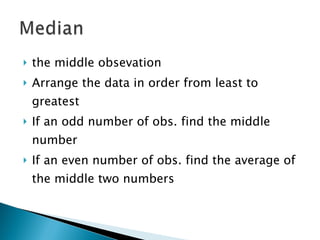
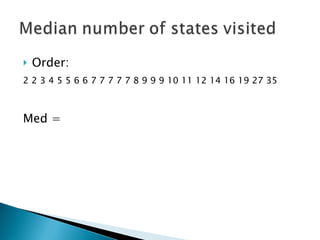
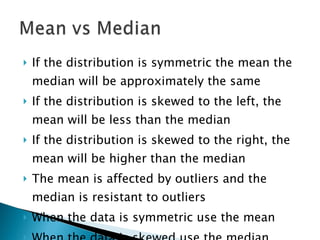
Numerically
Mean:  arithmetic average, add all observations together and divide by the number of observations.  If there are  n  observations which are labeled as  ; The mean is  Read as “x bar” Must be written with the bar!!!!
 
the middle obsevation Arrange the data in order from least to greatest If an odd number of obs. find the middle number If an even number of obs. find the average of the middle two numbers
Order: 2 2 3 4 5 5 6 6 7 7 7 7 7 8 9 9 9 10 11 12 14 16 19 27 35 Med =
If the distribution is symmetric the mean the median will be approximately the same If the distribution is skewed to the left, the mean will be less than the median If the distribution is skewed to the right, the mean will be higher than the median The mean is affected by outliers and the median is resistant to outliers When the data is symmetric use the mean When the data is skewed use the median
Numeric description of the distribution Minimum 1 st  Quartile (Q 1 ) – Middle number of the bottom half of the data Median  3 rd  Quartile (Q 3 ) – Middle number of the top half of the data Maximum
Put data in order 2 2 3 4 5 5 6 6 7 7 7 7 7 8 9 9 9 10 11 12 14 16 19 27 35   Min = 2 Q 1  = 5.5 Med = 7 Q 3  = 11.5 Max = 35
Graphical display of 5 number summary
Range = Max – Min    Interquartile Range IQR = Q 3  – Q 1
Any observation below the Lower Fence (LF) or above the Upper Fence (UF) is considered an outlier LF = Q 1  – 1.5(IQR) UF = Q 3  + 1.5(IQR)
If outliers are present the whisker extends to the last value not an outlier The outlier is marked with an x, box, or point

Center 5#Summary

  • 1.
  • 2.
    Mean: arithmeticaverage, add all observations together and divide by the number of observations. If there are n observations which are labeled as ; The mean is Read as “x bar” Must be written with the bar!!!!
  • 3.
  • 4.
    the middle obsevationArrange the data in order from least to greatest If an odd number of obs. find the middle number If an even number of obs. find the average of the middle two numbers
  • 5.
    Order: 2 23 4 5 5 6 6 7 7 7 7 7 8 9 9 9 10 11 12 14 16 19 27 35 Med =
  • 6.
    If the distributionis symmetric the mean the median will be approximately the same If the distribution is skewed to the left, the mean will be less than the median If the distribution is skewed to the right, the mean will be higher than the median The mean is affected by outliers and the median is resistant to outliers When the data is symmetric use the mean When the data is skewed use the median
  • 7.
    Numeric description ofthe distribution Minimum 1 st Quartile (Q 1 ) – Middle number of the bottom half of the data Median 3 rd Quartile (Q 3 ) – Middle number of the top half of the data Maximum
  • 8.
    Put data inorder 2 2 3 4 5 5 6 6 7 7 7 7 7 8 9 9 9 10 11 12 14 16 19 27 35 Min = 2 Q 1 = 5.5 Med = 7 Q 3 = 11.5 Max = 35
  • 9.
    Graphical display of5 number summary
  • 10.
    Range = Max– Min   Interquartile Range IQR = Q 3 – Q 1
  • 11.
    Any observation belowthe Lower Fence (LF) or above the Upper Fence (UF) is considered an outlier LF = Q 1 – 1.5(IQR) UF = Q 3 + 1.5(IQR)
  • 12.
    If outliers arepresent the whisker extends to the last value not an outlier The outlier is marked with an x, box, or point