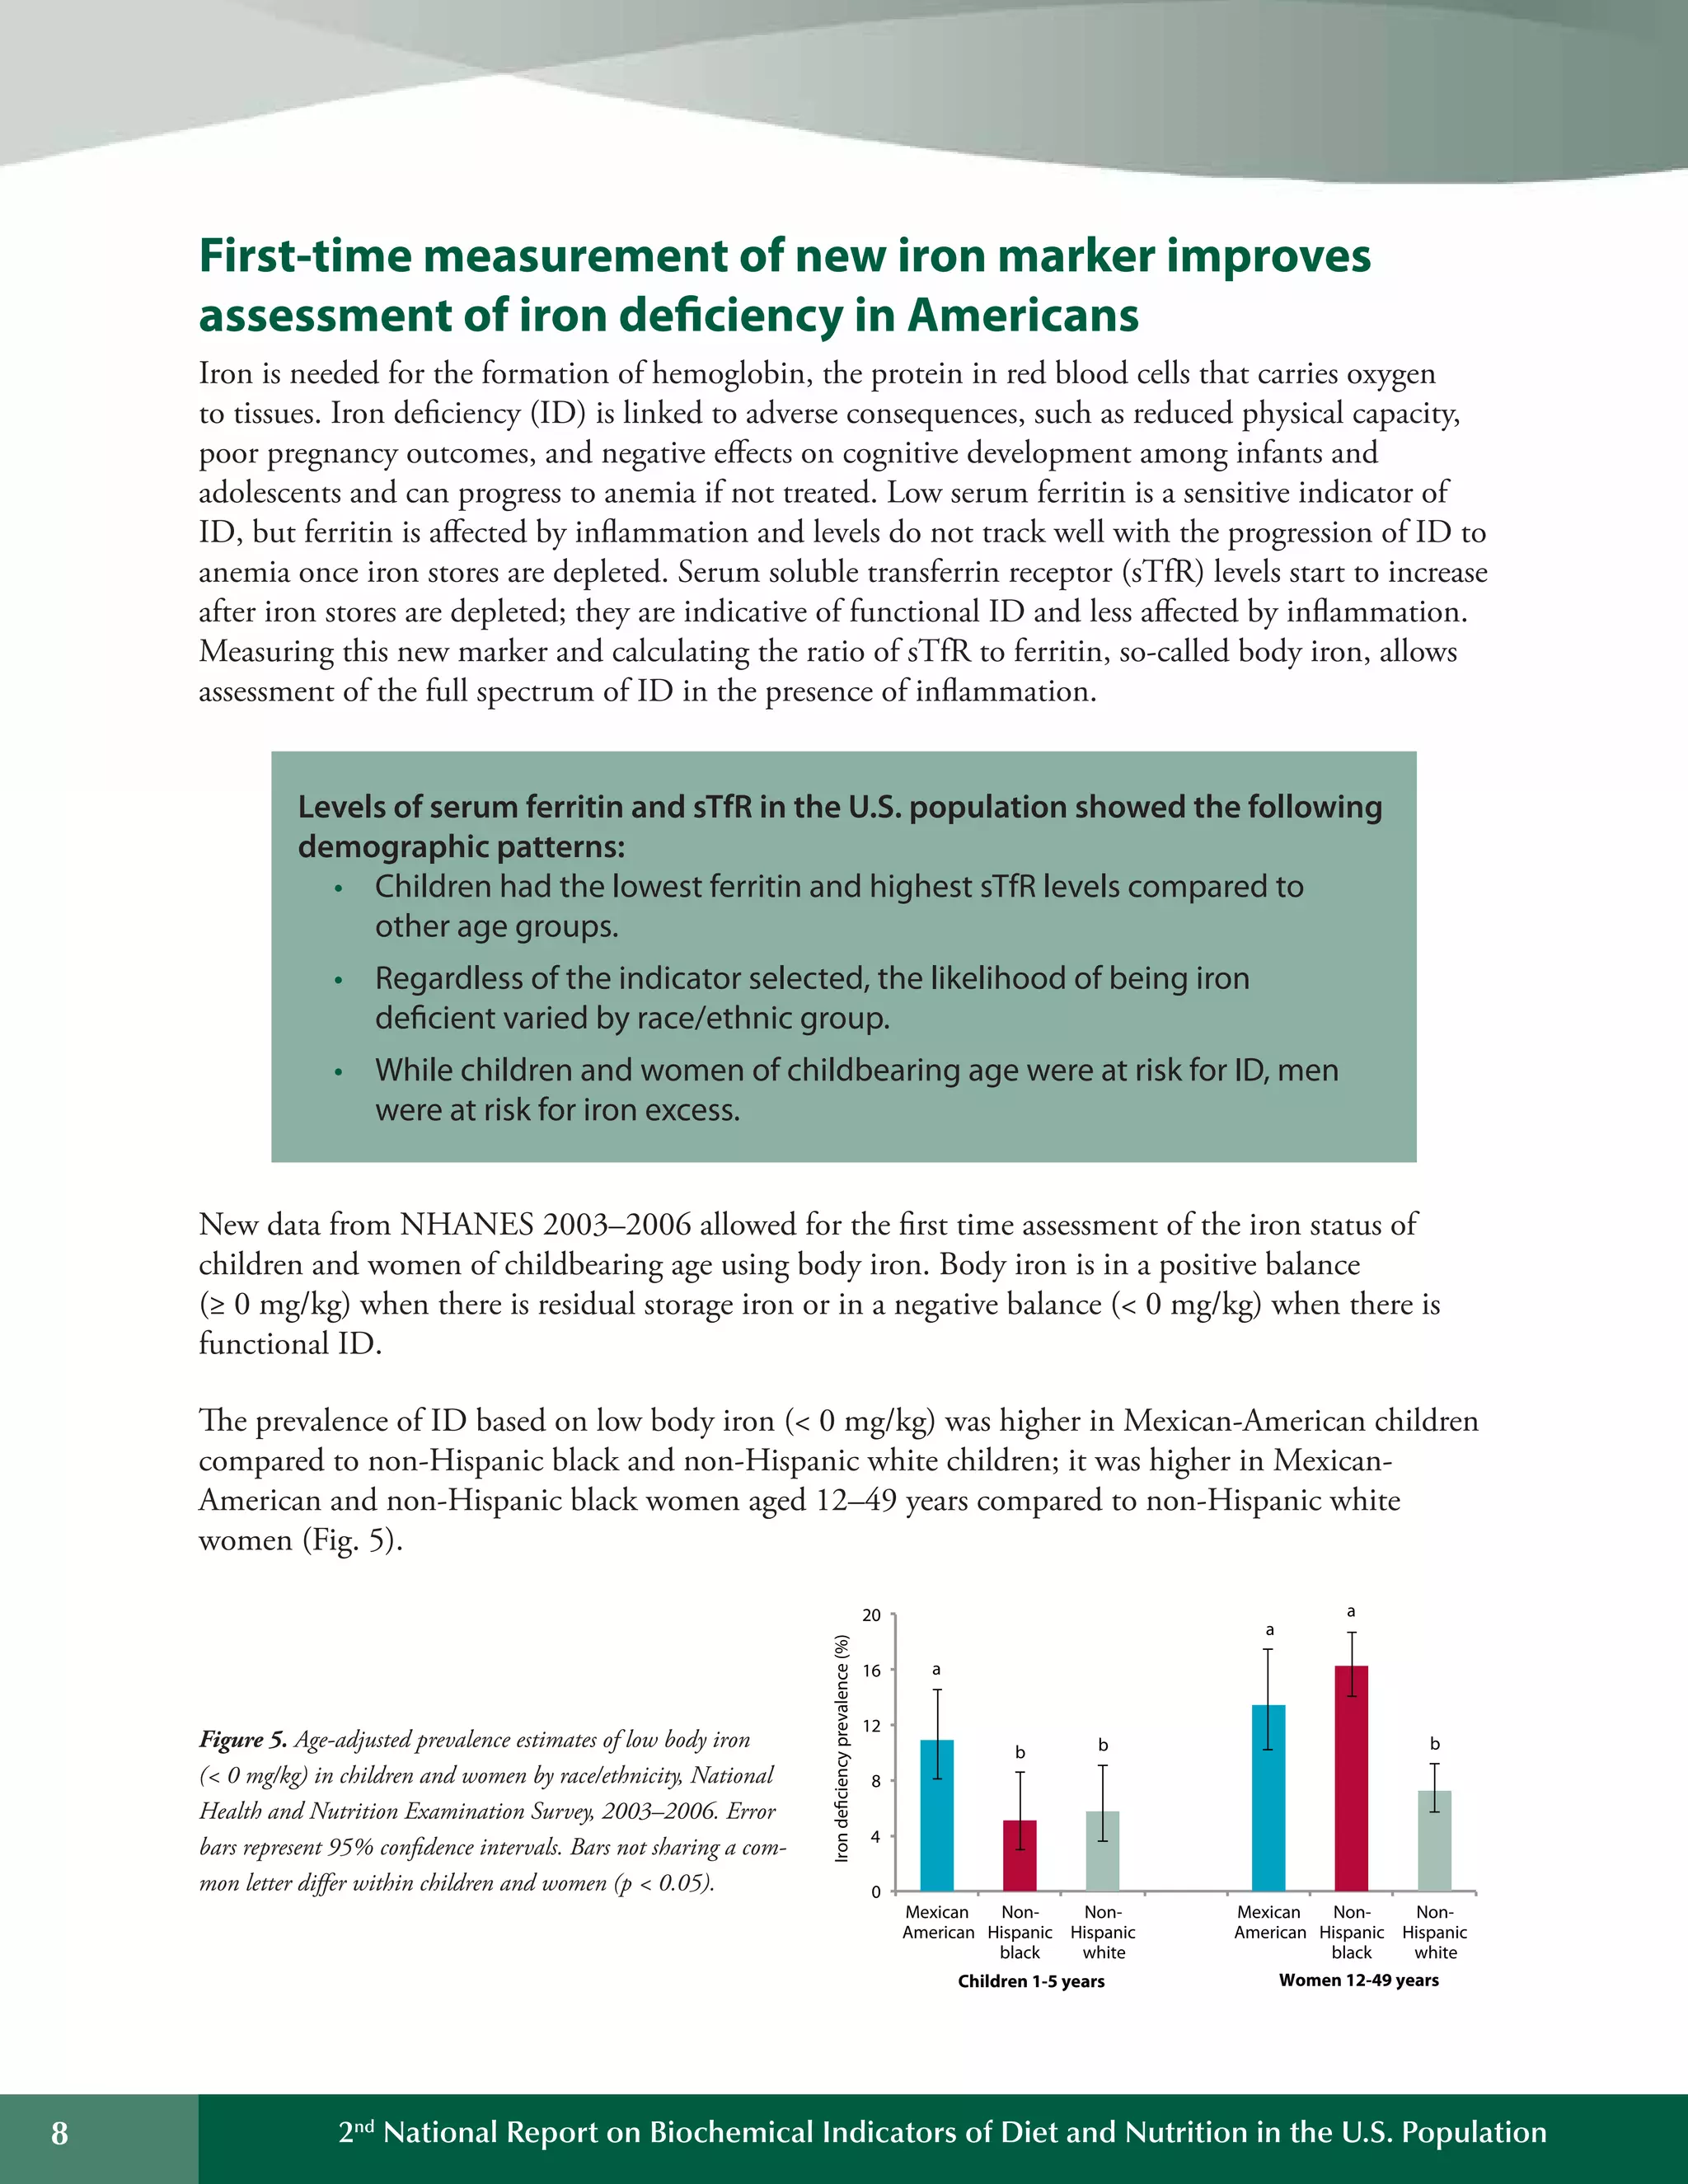
Second National Report on Biochemical Indicators
of Diet and Nutrition in the U.S. Population
2012
Executive Summary
National Center for Environmental Health
Division of Laboratory Sciences
Background
The National Report on Biochemical Indicators of Diet and Nutrition in the U.S. Population is a
series of publications that provide ongoing assessment of the U.S. population’s nutrition status by
measuring blood and urine levels of diet-and-nutrition biochemical indicators.
This is the second report in this series. The Centers for Disease Control and Prevention’s (CDC)
Division of Laboratory Sciences at the National Center for Environmental Health (NCEH/DLS)
conducted the laboratory analyses for 58 biochemical indicators presented in this 2012 report. CDC
measured these indicators in specimens from a representative sample of the U.S. population during
all or part of the four-year period from 2003 through 2006. Where available, data are also presented
on changes of biochemical indicator levels over time since 1999. Similarly, data are also presented on
the prevalence of low or high biochemical indicator levels during 2003–2006, and on changes in the
prevalence over time since 1999.
The first report of this series was published in July 2008 and it contains information on 27
biochemical indicators from all or part of the four-year period from 1999 through 2002. Both
reports can be accessed online: http://www.cdc.gov/nutritionreport.
Biochemical indicator
sections
t Water-soluble vitamins
t Fat-soluble vitamins and nutrients
t Trace elements (iron indicators
and iodine)
t Isoflavones and lignans
t Acrylamide hemoglobin adducts
New report features
t Central 95% reference intervals
t Graphic representation of age
patterns
t Levels over time
t Prevalence estimates
t Prevalence estimates over time
New biochemical indicators
t Vitamin B6
t Vitamin C
t Fatty acids
t Iron status: Transferrin receptor
and body iron
t Acrylamide hemoglobin adducts
The specimens for the Second Nutrition Report were collected by CDC’s National Health and
Nutrition Examination Survey (NHANES), which is conducted by the National Center for Health
Statistics (NCHS). NHANES is a series of surveys designed to collect data on the health and
nutrition status of the U.S. population.
This report covers one important facet in the assessment of nutrition status of the U.S. population:
biochemical measurements. Other nutrition-related aspects from NHANES, such as dietary intake,
supplement usage, hematologic measurements, and anthropometric body measurements are not covered.
Executive Summary 1
2 2nd
National Report on Biochemical Indicators of Diet and Nutrition in the U.S. Population
Public health uses
The primary objective of the Second Nutrition Report is to inform public health scientists and
policy makers about the levels of biochemical indicators of diet and nutrition in the general U.S.
population and in selected subpopulations. These data will help physicians, scientists, and public
health officials assess inadequate or excess intake and will inform analyses on the relation between
biochemical indicators and health outcomes. Other objectives and potential public health uses of the
information include the following:
•	 Establishing and improving upon existing population reference levels that can be used to 

determine whether a person or a group of people has an unusually high or low level of a 

biochemical indicator of diet and nutrition.

•	 Determining whether the nutrition status of special population groups, such as minorities,
children, women of childbearing age, or the elderly is different from that of other groups, or
whether such nutrition status needs improvement.
•	 Tracking trends over time in the population’s biochemical indicator levels.
•	 Assessing the effectiveness of public health efforts to improve the diet and nutrition status of
the U.S. population.
•	 Guiding research to perform more in-depth analyses of the NHANES data and to generate 

hypotheses for future nutrition and human health studies.

Data presented for biochemical indicators
The Second Nutrition Report contains tables and figures of descriptive statistics on the distribution of
blood and urine levels during all or part of the four-year period from 2003 through 2006 for each
diet-and-nutrition biochemical indicator. Statistics include unadjusted geometric means and selected
percentiles with confidence intervals. For some biochemical indicators, additional information is
included, as available, in the form of:
•	 Tables and figures describing biochemical indicator levels across survey cycles during all or
part of the eight-year period from 1999 through 2006. Statistics include unadjusted geometric
means and selected percentiles with confidence intervals.
•	 Tables describing the prevalence of low or high levels of selected biochemical indicators
during all or part of the four-year period from 2003 through 2006 and tables describing the
prevalence across survey cycles during all or part of the eight-year period from 1999 through
2006. Statistics include unadjusted percentages with confidence intervals and estimated total
number of persons affected.
Interpreting the data
Blood and urine levels of biochemical
indicators can help in assessing the
adequacy of intake for the U.S.
population. These measurements indicate
cumulative intakes from foods, some
fortified with micronutrients (e.g.,
iron, thiamin, riboflavin, niacin, folate,
vitamin A, vitamin D), and from dietary
supplements that contain vitamins,
minerals, or both. However, blood or
urine levels of biochemical indicators can
also be influenced by factors other than 

diet, such as various diseases or exposures. For those nutrients without defined adequate intakes (e.g., 

carotenoids, isoflavones), biochemical indicators are useful for assessing intake without regard to 

adequacy.

Dietary deficiencies are well documented, and they have characteristic signs and symptoms. In 

addition, recent findings have determined that less than optimal biochemical levels have been 

associated with risks of adverse health effects. These health effects include cardiovascular disease, 

stroke, impaired cognitive function, cancer, eye diseases, poor bone health, and other conditions. 

Adverse health effects, including toxicity, are also possible from consuming excess amounts of certain 

nutrients and data to assist in the assessment of excessive intake is a feature of this report. 

Determining the levels of a biochemical indicator that may indicate risk for disease and the levels 

that are of negligible health concern requires future research studies that are separate from this 

report. In collaboration with other agencies and institutions, CDC encourages, and itself conducts 

research on the relationship between biochemical indicators and health effects.

Executive Summary 3
2nd
National Report on Biochemical Indicators of Diet and Nutrition in the U.S. Population
New information on prevalence of nutrient deficiencies
In NHANES 2003-2006, 10% or less of the general U.S. population had nutrition deficiencies for
selected indicators (Fig. 1). However, for most nutrition indicators, the prevalence varied by age,
gender, or race/ethnicity. For example, children and adolescents were rarely deficient in vitamin
B12 ( 1%), while older adults were more likely to be deficient (4%). Men were more likely to be
vitamin C deficient (7%) compared to women (5%). Non-Hispanic black (31%) and Mexican-
American (12%) people were more likely to be vitamin D deficient compared to non-Hispanic white
people (3%).
•	 Vitamin B6 (serum pyridoxal-5’-phosphate  20 nmol/L), iron (serum body iron  0 mg/kg),
and vitamin D (serum 25-hydroxyvitamin D  30 nmol/L) are the three nutrients assessed in
this report with the highest prevalence of deficiency.
•	 Vitamin A (serum retinol  20 µg/dL), vitamin E (serum alpha-tocopherol  500 µg/dL), and
folate (red blood cell folate  95 ng/mL) are nutrients with the lowest prevalence of deficiency
of less than 1%.
•	 Vitamin C (serum ascorbic acid  11.4 µmol/L) and vitamin B12 (serum cobalamin  200 pg/
mL) are nutrients with intermediate prevalence of deficiency.
Where we have data from 8 years of NHANES (1999–2006), we noticed that the prevalence of
nutrient deficiencies hasn’t changed over that time period. Future reports may provide information
on nutrient levels extending over a longer period of time.
1
1
1
2
6
6.7
8.1
9.5
10.5
Folate (1 y)
Vitamin E (6 y)
Vitamin A (6 y)
Vitamin B12 (1 y)
Vitamin C (≥6 y)
Iron (1-5 y)
Vitamin D (1 y)
Iron (women 12-49 y)
Vitamin B6 (1 y)
0 2 4 6 8 10 12 14
Prevalence of deficiency (%)
Figure 1. Prevalence estimates of nutrient deficiencies in U.S. persons, National Health and Nutrition Examination Survey,
2003–2006. Error bars represent 95% confidence intervals. Nutrition indicators were measured in different age (e.g., 1 y and older, 6
y and older) and population groups (e.g., women 12-49 y of age, children 1-5 y of age). Cutoff values used to estimate prevalence are:
serum pyridoxal-5’-phosphate  20 nmol/L, serum body iron  0 mg/kg, serum 25-hydroxyvitamin D  30 nmol/L, serum ascorbic
acid  114. µmol/L, serum cobalamin  200 pg/mL, serum retinol  20 µg/dL, serum alpha-tocopherol  500 µg/dL, and red blood
cell folate  95 ng/mL.
4
1988-1994 1999-2002 2003-2006
350
0
0
0
0
0
0
0
a a a
a
a
a
b b
b
b
b
b
c c
c
c
c
c30
25
20
15
10
5
Redbloodcellfolate(ng/mL)
Total Males Females Mexican Non- Non-
population American Hispanic Hispanic
black white
Folate levels rise after food fortification, decreasing folate
deficiency to  1%
Folate belongs to the group of water-soluble B vitamins that occur naturally in leafy green vegetables,
fruits, and dried beans and peas. Folic acid is the synthetic form of folate found in supplements and
added to fortified foods. Serum folate levels provide information on recent intake, while red blood cell
(RBC) folate levels are indicative of body folate stores and long-term nutrition status. Adequate folate
status is especially important during pregnancy, infancy, and other periods when cells rapidly divide and
grow. To reduce the risk of neural-tube defects in newborns, the U.S. Food and Drug Administration
introduced mandatory folic acid fortification of enriched cereal grain products in 1998.
Blood folate levels in the U.S. population showed the following demographic
patterns:
•	 Of all age groups, older persons had the highest blood folate levels.
•	 Females had generally higher levels than males.
•	 Non-Hispanic blacks had the lowest, non-Hispanic whites had the
highest, and Mexican Americans had intermediate folate status.
Continuous monitoring of the effect of the U.S. folic acid fortification program on blood folate
levels is of great public health interest.
•	 Post 1998, blood folate levels increased by about 50% across race/ethnic groups (Fig. 2). From
1999–2002 to 2003–2006, blood folate levels decreased slightly ( 10%) in each race/ethnic
group, likely as a result of the intentional small reduction in the amount of folic acid added to
foods during this time period (Fig. 2).
•	 Before fortification, folate deficiency was about 10–12% in women of childbearing age, but
after fortification, folate deficiency dropped to less than 1% in the U.S. population and in
women of childbearing age of all race/ethnic groups.
Figure 2. Age-adjusted geometric mean levels of RBC
folate in the U.S. population aged 4 years and older by
gender or race/ethnicity, National Health and Nutrition
Examination Survey, 1988–2006. Error bars represent
95% confidence intervals. Within a demographic group,
bars not sharing a common letter differ (p  0.05).
Executive Summary 5
2nd
National Report on Biochemical Indicators of Diet and Nutrition in the U.S. Population
Serum 25-hydroxyvitamin D levels in the U.S. population showed the
following demographic patterns:
•	 Levels	generally	decreased	as	age	increased.
•	 Males	and	females	had	similar	levels.
•	 Among	the	three	race/ethnic	groups,	non-Hispanic	blacks	had	the	
lowest	25-hydroxyvitamin	D	levels	and	non-Hispanic	whites	had	the	
highest	levels.
a
b
c
a
c
Prevalence(%)
45 b
40
35
30
25
20
15
10
5
0 

Mexican Non- Non- Mexican Non- Non-

American Hispanic Hispanic American Hispanic Hispanic 

black white black white 

 30 nmol/L 30 to  50 nmol/L
Vitamin D deficiency is closely related to race/ethnicity
Vitamin D is naturally found in only a few foods, such as fish-liver oils, fatty fishes, mushrooms,
egg yolks, and liver. In the United States, vitamin D is commonly added to milk and other
foods. Ultraviolet light from the sun helps people photosynthesize vitamin D in the skin, which
is then transported to the liver and converted to 25-hydroxyvitamin D. Clinicians use serum
25-hydroxyvitamin D to determine a person’s vitamin D status because it is a good reflection of
cumulative effects of exposure to sunlight and dietary intake. Vitamin D is essential for good bone
health, and it may be important for muscle strength and protecting against cancer and type 2
diabetes. These benefits of vitamin D are currently under active investigation.
Clinical data show that non-Hispanic blacks have better bone health–greater bone density and fewer
fractures–than other race/ethnic groups. However in NHANES 2003-2006, non-Hispanic blacks
had the highest prevalence of vitamin D deficiency (serum 25-hydroxyvitamin D levels less than 30
nmol/L) (Fig. 3). Further research is needed to explain this unusual finding. Non-Hispanic blacks and
Mexican Americans had the highest prevalence of low serum 25-hydroxyvitamin D levels categorized
as at-risk for inadequacy (30 to less than 50 nmol/L) compared to non-Hispanic whites (Fig. 3).
Figure 3. Age-adjusted prevalence estimates of serum 25-hydroxyvitamin D levels less than 30 and 30 to less than 50 nmol/L in the
U.S. population aged 1 year and older by race/ethnicity, National Health and Nutrition Examination Survey, 2003–2006. Error bars
represent 95% confidence intervals. Within each vitamin D status category, bars not sharing a common letter differ (p  0.05).
6
7Executive Summary
b
a
a
0
10
20
30
40
50
60
Mexican American Non-Hispanic black Non-Hispanic white
EPA(mol/L)
A.
b
a
b
0
20
40
60
80
100
120
140
160
180
Mexican American Non-Hispanic black Non-Hispanic white
DHA(mol/L)
B.
First-time measurements of 24 plasma fatty acids,
including heart-healthy fatty acids, in the U.S. population
Most fatty acids can be synthesized by the human body from carbohydrates. However, humans are
incapable of de novo synthesis of n-6 and n-3 polyunsaturated fatty acids. Thus, linoleic (18:2n-6) and
alpha-linolenic (18:3n-3) acid are called “essential” polyunsaturated fatty acids. Both of these fatty
acids are metabolized to longer-chain, more highly unsaturated forms. Fatty acids with no double
bonds are referred to as saturated fatty acids, while those with one double bond are monounsaturated
fatty acids. Currently, intense debate surrounds the question of whether reduction in dietary saturated
fatty acids reduces the risk of cardiovascular disease. Lowering dietary intake of saturated fatty acids to
no more than 10% of caloric intake and replacing them with mono- and polyunsaturated fatty acids is
recommended to reduce the risk of cardiovascular disease.
These first-time plasma fatty acids levels in the U.S. population showed the
following demographic patterns:
•	 In general, younger adults had lower levels of fatty acids.
•	 Plasma levels of fatty acids were generally similar in men and women.
•	 For most fatty acids, no consistent race/ethnic pattern was found.
Heart-healthy n-3 polyunsaturated fatty acid levels in plasma differ by race/ethnicity:
Geometric mean levels of eicosapentaenoic acid (EPA), which is typically derived from seafood and
supplements, were higher in fasted non-Hispanic blacks and whites compared to Mexican-American
adults (Fig. 4, Panel A). In addition, plasma levels of the related long-chain polyunsaturated
docosahexaenoic acid (DHA) were higher in non-Hispanic black compared to Mexican-American
and non-Hispanic white adults (Fig. 4, Panel B). Tracking fatty acid levels over time will show
progress toward more heart-healthy diets.
Figure 4. Geometric mean plasma levels of eicosapentaenoic (EPA, panel A) and docosahexaenoic (DHA, panel B) acid in the U.S.
population from fasted adults aged 20 years and older by race/ethnicity, National Health and Nutrition Examination Survey, 2003-
2004. Error bars represent 95% confidence intervals. Bars not sharing a common letter differ (p  0.05).
8 2nd
National Report on Biochemical Indicators of Diet and Nutrition in the U.S. Population


20 
16 
12
8 
4
0 
Iron deficiency prevalence (%) 
a 
a 
a 
bbb 
Mexican  Non­ Non­ Mexican  Non­ Non­
American  Hispanic  Hispanic  American  Hispanic  Hispanic 
black  white  black  white 
Children 1-5 years Women 12-49 years
First-time measurement of new iron marker improves
assessment of iron deficiency in Americans
Iron is needed for the formation of hemoglobin, the protein in red blood cells that carries oxygen
to tissues. Iron deficiency (ID) is linked to adverse consequences, such as reduced physical capacity,
poor pregnancy outcomes, and negative effects on cognitive development among infants and
adolescents and can progress to anemia if not treated. Low serum ferritin is a sensitive indicator of
ID, but ferritin is affected by inflammation and levels do not track well with the progression of ID to
anemia once iron stores are depleted. Serum soluble transferrin receptor (sTfR) levels start to increase
after iron stores are depleted; they are indicative of functional ID and less affected by inflammation.
Measuring this new marker and calculating the ratio of sTfR to ferritin, so-called body iron, allows
assessment of the full spectrum of ID in the presence of inflammation.
Levels of serum ferritin and sTfR in the U.S. population showed the following
demographic patterns:
•	 Children had the lowest ferritin and highest sTfR levels compared to
other age groups.
•	 Regardless of the indicator selected, the likelihood of being iron
deficient varied by race/ethnic group.
•	 While children and women of childbearing age were at risk for ID, men
were at risk for iron excess.
New data from NHANES 2003–2006 allowed for the first time assessment of the iron status of
children and women of childbearing age using body iron. Body iron is in a positive balance
(≥ 0 mg/kg) when there is residual storage iron or in a negative balance ( 0 mg/kg) when there is
functional ID.
The prevalence of ID based on low body iron ( 0 mg/kg) was higher in Mexican-American children
compared to non-Hispanic black and non-Hispanic white children; it was higher in Mexican-
American and non-Hispanic black women aged 12–49 years compared to non-Hispanic white
women (Fig. 5).
Figure 5. Age-adjusted prevalence estimates of low body iron
( 0 mg/kg) in children and women by race/ethnicity, National
Health and Nutrition Examination Survey, 2003–2006. Error
bars represent 95% confidence intervals. Bars not sharing a com­
mon letter differ within children and women (p  0.05).
Urine iodine levels in the U.S. population showed the following demographic
patterns:
•	 The	lowest	levels	were	observed	in	young	women,	while	the	highest	
levels	were	observed	in	children.
•	 No	consistent	pattern	was	observed	with	regard	to	race/ethnicity.
•	 Urine	iodine	levels	have	been	relatively	stable	since	the	late	1980s.
Insufficient intake
Adequate intake
Above requirements
Excessive intake
6-11 12-19 20-39 40-59 60
Males Females
400 

300 

200 

100 

0
Age (years)
Medianurinaryiodine(ng/mL)
Women of childbearing age have iodine levels bordering
on insufficiency
Iodine, a trace element found in soil, is an essential component of the thyroid hormones involved
in regulating the body’s metabolic processes related to normal growth and development. Across the
world, iodized salt and seafood are the major dietary sources of iodine. In the United States, where
addition of iodine to salt is not mandatory, most people get their iodine from dairy products and
bread. Iodine deficiency is the most preventable cause of mental retardation in the world. Iodine
deficiency disorders include mental retardation, hypothyroidism, goiter, cretinism, and varying
degrees of other growth and developmental abnormalities. Most dietary iodine absorbed in the body
eventually appears in the urine; thus, urine iodine excretion is recommended for assessing recent
dietary iodine intake.
The iodine intake of the U.S. population appeared to be adequate on the basis of median urine
iodine levels. However, women aged 20–39 years had the lowest iodine intake, just slightly above
insufficient intake (Fig. 6). Young women merit special attention to ensure the best possible brain
development of the fetus during pregnancy.
While no age group had a median urine iodine level that represented excessive iodine intake, boys
6–11 years of age had the highest intake, and the upper confidence limit of the median was just
slightly within the range of excessive intake (Fig. 6).
Figure 6. Median levels of urine iodine in the U.S. population aged 6 years and older by age group and gender associated with
estimated iodine intake, National Health and Nutrition Examination Survey, 2001–2006. Error bars represent 95% confidence
intervals.
Executive Summary 9
10 2nd
National Report on Biochemical Indicators of Diet and Nutrition in the U.S. Population


First-time assessment of acrylamide exposure in the U.S.
population
Acrylamide is a chemical naturally found in starchy foods that are cooked at high temperatures (above
120°C) and low-moisture conditions, such as those used for baking or frying. Foods that contain high
acrylamide levels include potato chips, crackers, snacks, and coffee. Acrylamide is present in tobacco
smoke, and it is an industrial chemical. In the body, some acrylamide is metabolized to glycidamide,
which is an epoxide of acrylamide. Because glycidamide reacts with DNA, it is considered a genotoxic
agent. Acrylamide has been categorized as reasonably anticipated to be a human carcinogen.
The lifelong exposure of most of the population to acrylamide through food and smoking has
raised concerns about its potential health effects at low levels of intake. Measurement of acrylamide
hemoglobin adduct levels provides information both about acrylamide exposure and metabolism.
The first-time acrylamide hemoglobin adduct levels in the U.S. population
showed the following demographic patterns:
•	 Hemoglobin adduct levels were detectable in nearly all blood samples
measured.
•	 We observed no consistent age, gender, or race/ethnicity patterns for
the hemoglobin adduct levels.
•	 However, demographic differences emerged for the glycidamide-to-
acrylamide hemoglobin adduct ratios.
Children had higher glycidamide-to-acrylamide hemoglobin adduct ratios compared to adolescents
and adults, suggesting differences in acrylamide metabolism or metabolic rate among age groups1
.
Non-Hispanic blacks had lower hemoglobin adduct ratios compared to non-Hispanic whites and
Mexican Americans, which may indicate differences in polymorphisms of the genes involved in phase
II detoxification of acrylamide and glycidamide.1
More research is needed to better understand factors influencing acrylamide metabolism and the
relationship between acrylamide exposure and health risks.
Vesper HW, Caudill SP, Osterloh JD, et al. Exposure of the U.S. population to acrylamide in the National Health and Nutrition
Examination Survey 2003–2004. Environ Health Perspect. 2010;118:278–283.
1
Plans for future Nutrition Reports
CDC’s goal is to make new biochemical nutrition information available as soon as possible to the
public and to the scientific community. To meet this goal, CDC periodically releases a new issue
of the Nutrition Report and also publishes biochemical nutrition information in peer-reviewed
publications. The Nutrition Report series provides biochemical nutrition information starting in
1999 through the latest available data at the time of the report release. Future plans include releasing
data on additional indicators and providing more information on the nutrition status in population
groups defined by age, sex, and race or ethnicity.
For the most up-to-date biochemical nutrition information, including the series of published
reports as well as a list of peer-reviewed publications, users can view the Nutrition Report web site
(http://www.cdc.gov/nutritionreport/).
About CDC’s Nutritional Biomarkers Branch
The Nutritional Biomarkers Branch (NBB) develops and improves laboratory methods and analyzes
essential nutrients (e.g., vitamins), nonessential nutrients (e.g., certain fatty acids), and dietary
bioactive compounds (e.g., isoflavones and lignans) to evaluate nutrition status and its relationship
to health. For many of these nutrients and dietary compounds, NBB produces population-based
exposure levels segmented by age, sex, and race or ethnicity.
NBB reports nearly 100,000 test results every year for a wide range of nutrition biomarkers measured
in NHANES and other studies. In collaboration with CDC colleagues, NBB also plays an active
role in evaluating the worldwide burden of micronutrient deficiencies, such as deficiencies in folate,
vitamin A, and iron. Billions of people around the world are affected by micronutrient deficiencies
that may cause birth defects,
learning disabilities, mental
retardation, reduced immunity,
blindness, poor work capacity, or
premature death. The laboratory
provides training and technical
assistance on questions about
laboratory analysis and field
logistics in preparation for national
nutrition surveys in countries such
as Argentina, Dominican Republic,
Iraq, Kenya, Laos, Malawi,
Nicaragua, Oman, Papua New
Guinea, South Africa, Ukraine,
Uzbekistan, Yemen, and Zambia.
Executive Summary 11
12 2nd
National Report on Biochemical Indicators of Diet and Nutrition in the U.S. Population
Diet-and-nutrition indicators in the Second Nutrition Report*

Water-Soluble Vitamins and Related
Biochemical Compounds
Folate (serum and red blood cell)

Vitamin B6*

Vitamin B12

Homocysteine

Methylmalonic acid

Vitamin C*

Trace Elements
Ferritin

Soluble transferrin receptor*

Body iron*

Iodine

Isoflavones and Lignans
Isoflavones
Genistein

Daidzein

Equol

O-Desmethylangolensin

Lignans
Enterodiol

Enterolactone

Acrylamide Hemoglobin Adducts*
Acrylamide

Glycidamide

Glycidamide-to-acrylamide ratio

Fat-Soluble Vitamins  Nutrients
Vitamins A and E and Carotenoids
Vitamin A
Retinyl palmitate*
Retinyl stearate*
Vitamin E
gamma-Tocopherol
alpha-Carotene
trans-beta-Carotene
cis-beta-Carotene*
beta-Cryptoxanthin
Lutein and zeaxanthin
trans-Lycopene
Total lycopene (cis- and trans-)*
Vitamin D
25-Hydroxyvitamin D
Fatty Acids*
Saturated
Myristic acid (14:0)

Palmitic acid (16:0)

Stearic acid (18:0)

Arachidic acid (20:0)

Docosanoic acid (22:0)

Lignoceric acid (24:0)

Monounsaturated
Myristoleic acid (14:1n-5)
Palmitoleic acid (16:1n-7)
cis-Vaccenic acid (18:1n-7)
Oleic acid (18:1n-9)
Eicosenoic acid (20:1n-9)
Docosenoic acid (22:1n-9)
Nervonic acid (24:1n-9)
Polyunsaturated
Linoleic acid (18:2n-6)
alpha-Linolenic acid (18:3n-3)
gamma-Linolenic acid (18:3n-6)
Eicosadienoic acid (20:2n-6)
homo-gamma-Linolenic acid (20:3n-6)
Arachidonic acid (20:4n-6)
Eicosapentaenoic acid (20:5n-3)
Docosatetraenoic acid (22:4n-6)
Docosapentaenoic-3 acid (22:5n-3)
Docosapentaenoic-6 acid (22:5n-6)
Docosahexaenoic acid (22:6n-3)
* Indicates NEW biochemical indicators or groups of indicators in the Second Nutrition Report

CDC 2012 Diet & Nutrition Report Summary

  • 1.
    Second National Reporton Biochemical Indicators of Diet and Nutrition in the U.S. Population 2012 Executive Summary National Center for Environmental Health Division of Laboratory Sciences
  • 2.
    Background The National Reporton Biochemical Indicators of Diet and Nutrition in the U.S. Population is a series of publications that provide ongoing assessment of the U.S. population’s nutrition status by measuring blood and urine levels of diet-and-nutrition biochemical indicators. This is the second report in this series. The Centers for Disease Control and Prevention’s (CDC) Division of Laboratory Sciences at the National Center for Environmental Health (NCEH/DLS) conducted the laboratory analyses for 58 biochemical indicators presented in this 2012 report. CDC measured these indicators in specimens from a representative sample of the U.S. population during all or part of the four-year period from 2003 through 2006. Where available, data are also presented on changes of biochemical indicator levels over time since 1999. Similarly, data are also presented on the prevalence of low or high biochemical indicator levels during 2003–2006, and on changes in the prevalence over time since 1999. The first report of this series was published in July 2008 and it contains information on 27 biochemical indicators from all or part of the four-year period from 1999 through 2002. Both reports can be accessed online: http://www.cdc.gov/nutritionreport. Biochemical indicator sections t Water-soluble vitamins t Fat-soluble vitamins and nutrients t Trace elements (iron indicators and iodine) t Isoflavones and lignans t Acrylamide hemoglobin adducts New report features t Central 95% reference intervals t Graphic representation of age patterns t Levels over time t Prevalence estimates t Prevalence estimates over time New biochemical indicators t Vitamin B6 t Vitamin C t Fatty acids t Iron status: Transferrin receptor and body iron t Acrylamide hemoglobin adducts The specimens for the Second Nutrition Report were collected by CDC’s National Health and Nutrition Examination Survey (NHANES), which is conducted by the National Center for Health Statistics (NCHS). NHANES is a series of surveys designed to collect data on the health and nutrition status of the U.S. population. This report covers one important facet in the assessment of nutrition status of the U.S. population: biochemical measurements. Other nutrition-related aspects from NHANES, such as dietary intake, supplement usage, hematologic measurements, and anthropometric body measurements are not covered. Executive Summary 1
  • 3.
    2 2nd National Reporton Biochemical Indicators of Diet and Nutrition in the U.S. Population Public health uses The primary objective of the Second Nutrition Report is to inform public health scientists and policy makers about the levels of biochemical indicators of diet and nutrition in the general U.S. population and in selected subpopulations. These data will help physicians, scientists, and public health officials assess inadequate or excess intake and will inform analyses on the relation between biochemical indicators and health outcomes. Other objectives and potential public health uses of the information include the following: • Establishing and improving upon existing population reference levels that can be used to determine whether a person or a group of people has an unusually high or low level of a biochemical indicator of diet and nutrition. • Determining whether the nutrition status of special population groups, such as minorities, children, women of childbearing age, or the elderly is different from that of other groups, or whether such nutrition status needs improvement. • Tracking trends over time in the population’s biochemical indicator levels. • Assessing the effectiveness of public health efforts to improve the diet and nutrition status of the U.S. population. • Guiding research to perform more in-depth analyses of the NHANES data and to generate hypotheses for future nutrition and human health studies. Data presented for biochemical indicators The Second Nutrition Report contains tables and figures of descriptive statistics on the distribution of blood and urine levels during all or part of the four-year period from 2003 through 2006 for each diet-and-nutrition biochemical indicator. Statistics include unadjusted geometric means and selected percentiles with confidence intervals. For some biochemical indicators, additional information is included, as available, in the form of: • Tables and figures describing biochemical indicator levels across survey cycles during all or part of the eight-year period from 1999 through 2006. Statistics include unadjusted geometric means and selected percentiles with confidence intervals. • Tables describing the prevalence of low or high levels of selected biochemical indicators during all or part of the four-year period from 2003 through 2006 and tables describing the prevalence across survey cycles during all or part of the eight-year period from 1999 through 2006. Statistics include unadjusted percentages with confidence intervals and estimated total number of persons affected.
  • 4.
    Interpreting the data Bloodand urine levels of biochemical indicators can help in assessing the adequacy of intake for the U.S. population. These measurements indicate cumulative intakes from foods, some fortified with micronutrients (e.g., iron, thiamin, riboflavin, niacin, folate, vitamin A, vitamin D), and from dietary supplements that contain vitamins, minerals, or both. However, blood or urine levels of biochemical indicators can also be influenced by factors other than diet, such as various diseases or exposures. For those nutrients without defined adequate intakes (e.g., carotenoids, isoflavones), biochemical indicators are useful for assessing intake without regard to adequacy. Dietary deficiencies are well documented, and they have characteristic signs and symptoms. In addition, recent findings have determined that less than optimal biochemical levels have been associated with risks of adverse health effects. These health effects include cardiovascular disease, stroke, impaired cognitive function, cancer, eye diseases, poor bone health, and other conditions. Adverse health effects, including toxicity, are also possible from consuming excess amounts of certain nutrients and data to assist in the assessment of excessive intake is a feature of this report. Determining the levels of a biochemical indicator that may indicate risk for disease and the levels that are of negligible health concern requires future research studies that are separate from this report. In collaboration with other agencies and institutions, CDC encourages, and itself conducts research on the relationship between biochemical indicators and health effects. Executive Summary 3
  • 5.
    2nd National Report onBiochemical Indicators of Diet and Nutrition in the U.S. Population New information on prevalence of nutrient deficiencies In NHANES 2003-2006, 10% or less of the general U.S. population had nutrition deficiencies for selected indicators (Fig. 1). However, for most nutrition indicators, the prevalence varied by age, gender, or race/ethnicity. For example, children and adolescents were rarely deficient in vitamin B12 ( 1%), while older adults were more likely to be deficient (4%). Men were more likely to be vitamin C deficient (7%) compared to women (5%). Non-Hispanic black (31%) and Mexican- American (12%) people were more likely to be vitamin D deficient compared to non-Hispanic white people (3%). • Vitamin B6 (serum pyridoxal-5’-phosphate 20 nmol/L), iron (serum body iron 0 mg/kg), and vitamin D (serum 25-hydroxyvitamin D 30 nmol/L) are the three nutrients assessed in this report with the highest prevalence of deficiency. • Vitamin A (serum retinol 20 µg/dL), vitamin E (serum alpha-tocopherol 500 µg/dL), and folate (red blood cell folate 95 ng/mL) are nutrients with the lowest prevalence of deficiency of less than 1%. • Vitamin C (serum ascorbic acid 11.4 µmol/L) and vitamin B12 (serum cobalamin 200 pg/ mL) are nutrients with intermediate prevalence of deficiency. Where we have data from 8 years of NHANES (1999–2006), we noticed that the prevalence of nutrient deficiencies hasn’t changed over that time period. Future reports may provide information on nutrient levels extending over a longer period of time. 1 1 1 2 6 6.7 8.1 9.5 10.5 Folate (1 y) Vitamin E (6 y) Vitamin A (6 y) Vitamin B12 (1 y) Vitamin C (≥6 y) Iron (1-5 y) Vitamin D (1 y) Iron (women 12-49 y) Vitamin B6 (1 y) 0 2 4 6 8 10 12 14 Prevalence of deficiency (%) Figure 1. Prevalence estimates of nutrient deficiencies in U.S. persons, National Health and Nutrition Examination Survey, 2003–2006. Error bars represent 95% confidence intervals. Nutrition indicators were measured in different age (e.g., 1 y and older, 6 y and older) and population groups (e.g., women 12-49 y of age, children 1-5 y of age). Cutoff values used to estimate prevalence are: serum pyridoxal-5’-phosphate 20 nmol/L, serum body iron 0 mg/kg, serum 25-hydroxyvitamin D 30 nmol/L, serum ascorbic acid 114. µmol/L, serum cobalamin 200 pg/mL, serum retinol 20 µg/dL, serum alpha-tocopherol 500 µg/dL, and red blood cell folate 95 ng/mL. 4
  • 6.
    1988-1994 1999-2002 2003-2006 350 0 0 0 0 0 0 0 aa a a a a b b b b b b c c c c c c30 25 20 15 10 5 Redbloodcellfolate(ng/mL) Total Males Females Mexican Non- Non- population American Hispanic Hispanic black white Folate levels rise after food fortification, decreasing folate deficiency to 1% Folate belongs to the group of water-soluble B vitamins that occur naturally in leafy green vegetables, fruits, and dried beans and peas. Folic acid is the synthetic form of folate found in supplements and added to fortified foods. Serum folate levels provide information on recent intake, while red blood cell (RBC) folate levels are indicative of body folate stores and long-term nutrition status. Adequate folate status is especially important during pregnancy, infancy, and other periods when cells rapidly divide and grow. To reduce the risk of neural-tube defects in newborns, the U.S. Food and Drug Administration introduced mandatory folic acid fortification of enriched cereal grain products in 1998. Blood folate levels in the U.S. population showed the following demographic patterns: • Of all age groups, older persons had the highest blood folate levels. • Females had generally higher levels than males. • Non-Hispanic blacks had the lowest, non-Hispanic whites had the highest, and Mexican Americans had intermediate folate status. Continuous monitoring of the effect of the U.S. folic acid fortification program on blood folate levels is of great public health interest. • Post 1998, blood folate levels increased by about 50% across race/ethnic groups (Fig. 2). From 1999–2002 to 2003–2006, blood folate levels decreased slightly ( 10%) in each race/ethnic group, likely as a result of the intentional small reduction in the amount of folic acid added to foods during this time period (Fig. 2). • Before fortification, folate deficiency was about 10–12% in women of childbearing age, but after fortification, folate deficiency dropped to less than 1% in the U.S. population and in women of childbearing age of all race/ethnic groups. Figure 2. Age-adjusted geometric mean levels of RBC folate in the U.S. population aged 4 years and older by gender or race/ethnicity, National Health and Nutrition Examination Survey, 1988–2006. Error bars represent 95% confidence intervals. Within a demographic group, bars not sharing a common letter differ (p 0.05). Executive Summary 5
  • 7.
    2nd National Report onBiochemical Indicators of Diet and Nutrition in the U.S. Population Serum 25-hydroxyvitamin D levels in the U.S. population showed the following demographic patterns: • Levels generally decreased as age increased. • Males and females had similar levels. • Among the three race/ethnic groups, non-Hispanic blacks had the lowest 25-hydroxyvitamin D levels and non-Hispanic whites had the highest levels. a b c a c Prevalence(%) 45 b 40 35 30 25 20 15 10 5 0 Mexican Non- Non- Mexican Non- Non- American Hispanic Hispanic American Hispanic Hispanic black white black white 30 nmol/L 30 to 50 nmol/L Vitamin D deficiency is closely related to race/ethnicity Vitamin D is naturally found in only a few foods, such as fish-liver oils, fatty fishes, mushrooms, egg yolks, and liver. In the United States, vitamin D is commonly added to milk and other foods. Ultraviolet light from the sun helps people photosynthesize vitamin D in the skin, which is then transported to the liver and converted to 25-hydroxyvitamin D. Clinicians use serum 25-hydroxyvitamin D to determine a person’s vitamin D status because it is a good reflection of cumulative effects of exposure to sunlight and dietary intake. Vitamin D is essential for good bone health, and it may be important for muscle strength and protecting against cancer and type 2 diabetes. These benefits of vitamin D are currently under active investigation. Clinical data show that non-Hispanic blacks have better bone health–greater bone density and fewer fractures–than other race/ethnic groups. However in NHANES 2003-2006, non-Hispanic blacks had the highest prevalence of vitamin D deficiency (serum 25-hydroxyvitamin D levels less than 30 nmol/L) (Fig. 3). Further research is needed to explain this unusual finding. Non-Hispanic blacks and Mexican Americans had the highest prevalence of low serum 25-hydroxyvitamin D levels categorized as at-risk for inadequacy (30 to less than 50 nmol/L) compared to non-Hispanic whites (Fig. 3). Figure 3. Age-adjusted prevalence estimates of serum 25-hydroxyvitamin D levels less than 30 and 30 to less than 50 nmol/L in the U.S. population aged 1 year and older by race/ethnicity, National Health and Nutrition Examination Survey, 2003–2006. Error bars represent 95% confidence intervals. Within each vitamin D status category, bars not sharing a common letter differ (p 0.05). 6
  • 8.
    7Executive Summary b a a 0 10 20 30 40 50 60 Mexican AmericanNon-Hispanic black Non-Hispanic white EPA(mol/L) A. b a b 0 20 40 60 80 100 120 140 160 180 Mexican American Non-Hispanic black Non-Hispanic white DHA(mol/L) B. First-time measurements of 24 plasma fatty acids, including heart-healthy fatty acids, in the U.S. population Most fatty acids can be synthesized by the human body from carbohydrates. However, humans are incapable of de novo synthesis of n-6 and n-3 polyunsaturated fatty acids. Thus, linoleic (18:2n-6) and alpha-linolenic (18:3n-3) acid are called “essential” polyunsaturated fatty acids. Both of these fatty acids are metabolized to longer-chain, more highly unsaturated forms. Fatty acids with no double bonds are referred to as saturated fatty acids, while those with one double bond are monounsaturated fatty acids. Currently, intense debate surrounds the question of whether reduction in dietary saturated fatty acids reduces the risk of cardiovascular disease. Lowering dietary intake of saturated fatty acids to no more than 10% of caloric intake and replacing them with mono- and polyunsaturated fatty acids is recommended to reduce the risk of cardiovascular disease. These first-time plasma fatty acids levels in the U.S. population showed the following demographic patterns: • In general, younger adults had lower levels of fatty acids. • Plasma levels of fatty acids were generally similar in men and women. • For most fatty acids, no consistent race/ethnic pattern was found. Heart-healthy n-3 polyunsaturated fatty acid levels in plasma differ by race/ethnicity: Geometric mean levels of eicosapentaenoic acid (EPA), which is typically derived from seafood and supplements, were higher in fasted non-Hispanic blacks and whites compared to Mexican-American adults (Fig. 4, Panel A). In addition, plasma levels of the related long-chain polyunsaturated docosahexaenoic acid (DHA) were higher in non-Hispanic black compared to Mexican-American and non-Hispanic white adults (Fig. 4, Panel B). Tracking fatty acid levels over time will show progress toward more heart-healthy diets. Figure 4. Geometric mean plasma levels of eicosapentaenoic (EPA, panel A) and docosahexaenoic (DHA, panel B) acid in the U.S. population from fasted adults aged 20 years and older by race/ethnicity, National Health and Nutrition Examination Survey, 2003- 2004. Error bars represent 95% confidence intervals. Bars not sharing a common letter differ (p 0.05).
  • 9.
    8 2nd National Reporton Biochemical Indicators of Diet and Nutrition in the U.S. Population     20  16  12 8  4 0  Iron deficiency prevalence (%)  a  a  a  bbb  Mexican  Non­ Non­ Mexican  Non­ Non­ American  Hispanic  Hispanic  American  Hispanic  Hispanic  black  white  black  white  Children 1-5 years Women 12-49 years First-time measurement of new iron marker improves assessment of iron deficiency in Americans Iron is needed for the formation of hemoglobin, the protein in red blood cells that carries oxygen to tissues. Iron deficiency (ID) is linked to adverse consequences, such as reduced physical capacity, poor pregnancy outcomes, and negative effects on cognitive development among infants and adolescents and can progress to anemia if not treated. Low serum ferritin is a sensitive indicator of ID, but ferritin is affected by inflammation and levels do not track well with the progression of ID to anemia once iron stores are depleted. Serum soluble transferrin receptor (sTfR) levels start to increase after iron stores are depleted; they are indicative of functional ID and less affected by inflammation. Measuring this new marker and calculating the ratio of sTfR to ferritin, so-called body iron, allows assessment of the full spectrum of ID in the presence of inflammation. Levels of serum ferritin and sTfR in the U.S. population showed the following demographic patterns: • Children had the lowest ferritin and highest sTfR levels compared to other age groups. • Regardless of the indicator selected, the likelihood of being iron deficient varied by race/ethnic group. • While children and women of childbearing age were at risk for ID, men were at risk for iron excess. New data from NHANES 2003–2006 allowed for the first time assessment of the iron status of children and women of childbearing age using body iron. Body iron is in a positive balance (≥ 0 mg/kg) when there is residual storage iron or in a negative balance ( 0 mg/kg) when there is functional ID. The prevalence of ID based on low body iron ( 0 mg/kg) was higher in Mexican-American children compared to non-Hispanic black and non-Hispanic white children; it was higher in Mexican- American and non-Hispanic black women aged 12–49 years compared to non-Hispanic white women (Fig. 5). Figure 5. Age-adjusted prevalence estimates of low body iron ( 0 mg/kg) in children and women by race/ethnicity, National Health and Nutrition Examination Survey, 2003–2006. Error bars represent 95% confidence intervals. Bars not sharing a com­ mon letter differ within children and women (p 0.05).
  • 10.
    Urine iodine levelsin the U.S. population showed the following demographic patterns: • The lowest levels were observed in young women, while the highest levels were observed in children. • No consistent pattern was observed with regard to race/ethnicity. • Urine iodine levels have been relatively stable since the late 1980s. Insufficient intake Adequate intake Above requirements Excessive intake 6-11 12-19 20-39 40-59 60 Males Females 400 300 200 100 0 Age (years) Medianurinaryiodine(ng/mL) Women of childbearing age have iodine levels bordering on insufficiency Iodine, a trace element found in soil, is an essential component of the thyroid hormones involved in regulating the body’s metabolic processes related to normal growth and development. Across the world, iodized salt and seafood are the major dietary sources of iodine. In the United States, where addition of iodine to salt is not mandatory, most people get their iodine from dairy products and bread. Iodine deficiency is the most preventable cause of mental retardation in the world. Iodine deficiency disorders include mental retardation, hypothyroidism, goiter, cretinism, and varying degrees of other growth and developmental abnormalities. Most dietary iodine absorbed in the body eventually appears in the urine; thus, urine iodine excretion is recommended for assessing recent dietary iodine intake. The iodine intake of the U.S. population appeared to be adequate on the basis of median urine iodine levels. However, women aged 20–39 years had the lowest iodine intake, just slightly above insufficient intake (Fig. 6). Young women merit special attention to ensure the best possible brain development of the fetus during pregnancy. While no age group had a median urine iodine level that represented excessive iodine intake, boys 6–11 years of age had the highest intake, and the upper confidence limit of the median was just slightly within the range of excessive intake (Fig. 6). Figure 6. Median levels of urine iodine in the U.S. population aged 6 years and older by age group and gender associated with estimated iodine intake, National Health and Nutrition Examination Survey, 2001–2006. Error bars represent 95% confidence intervals. Executive Summary 9
  • 11.
    10 2nd National Reporton Biochemical Indicators of Diet and Nutrition in the U.S. Population First-time assessment of acrylamide exposure in the U.S. population Acrylamide is a chemical naturally found in starchy foods that are cooked at high temperatures (above 120°C) and low-moisture conditions, such as those used for baking or frying. Foods that contain high acrylamide levels include potato chips, crackers, snacks, and coffee. Acrylamide is present in tobacco smoke, and it is an industrial chemical. In the body, some acrylamide is metabolized to glycidamide, which is an epoxide of acrylamide. Because glycidamide reacts with DNA, it is considered a genotoxic agent. Acrylamide has been categorized as reasonably anticipated to be a human carcinogen. The lifelong exposure of most of the population to acrylamide through food and smoking has raised concerns about its potential health effects at low levels of intake. Measurement of acrylamide hemoglobin adduct levels provides information both about acrylamide exposure and metabolism. The first-time acrylamide hemoglobin adduct levels in the U.S. population showed the following demographic patterns: • Hemoglobin adduct levels were detectable in nearly all blood samples measured. • We observed no consistent age, gender, or race/ethnicity patterns for the hemoglobin adduct levels. • However, demographic differences emerged for the glycidamide-to- acrylamide hemoglobin adduct ratios. Children had higher glycidamide-to-acrylamide hemoglobin adduct ratios compared to adolescents and adults, suggesting differences in acrylamide metabolism or metabolic rate among age groups1 . Non-Hispanic blacks had lower hemoglobin adduct ratios compared to non-Hispanic whites and Mexican Americans, which may indicate differences in polymorphisms of the genes involved in phase II detoxification of acrylamide and glycidamide.1 More research is needed to better understand factors influencing acrylamide metabolism and the relationship between acrylamide exposure and health risks. Vesper HW, Caudill SP, Osterloh JD, et al. Exposure of the U.S. population to acrylamide in the National Health and Nutrition Examination Survey 2003–2004. Environ Health Perspect. 2010;118:278–283. 1
  • 12.
    Plans for futureNutrition Reports CDC’s goal is to make new biochemical nutrition information available as soon as possible to the public and to the scientific community. To meet this goal, CDC periodically releases a new issue of the Nutrition Report and also publishes biochemical nutrition information in peer-reviewed publications. The Nutrition Report series provides biochemical nutrition information starting in 1999 through the latest available data at the time of the report release. Future plans include releasing data on additional indicators and providing more information on the nutrition status in population groups defined by age, sex, and race or ethnicity. For the most up-to-date biochemical nutrition information, including the series of published reports as well as a list of peer-reviewed publications, users can view the Nutrition Report web site (http://www.cdc.gov/nutritionreport/). About CDC’s Nutritional Biomarkers Branch The Nutritional Biomarkers Branch (NBB) develops and improves laboratory methods and analyzes essential nutrients (e.g., vitamins), nonessential nutrients (e.g., certain fatty acids), and dietary bioactive compounds (e.g., isoflavones and lignans) to evaluate nutrition status and its relationship to health. For many of these nutrients and dietary compounds, NBB produces population-based exposure levels segmented by age, sex, and race or ethnicity. NBB reports nearly 100,000 test results every year for a wide range of nutrition biomarkers measured in NHANES and other studies. In collaboration with CDC colleagues, NBB also plays an active role in evaluating the worldwide burden of micronutrient deficiencies, such as deficiencies in folate, vitamin A, and iron. Billions of people around the world are affected by micronutrient deficiencies that may cause birth defects, learning disabilities, mental retardation, reduced immunity, blindness, poor work capacity, or premature death. The laboratory provides training and technical assistance on questions about laboratory analysis and field logistics in preparation for national nutrition surveys in countries such as Argentina, Dominican Republic, Iraq, Kenya, Laos, Malawi, Nicaragua, Oman, Papua New Guinea, South Africa, Ukraine, Uzbekistan, Yemen, and Zambia. Executive Summary 11
  • 13.
    12 2nd National Reporton Biochemical Indicators of Diet and Nutrition in the U.S. Population Diet-and-nutrition indicators in the Second Nutrition Report* Water-Soluble Vitamins and Related Biochemical Compounds Folate (serum and red blood cell) Vitamin B6* Vitamin B12 Homocysteine Methylmalonic acid Vitamin C* Trace Elements Ferritin Soluble transferrin receptor* Body iron* Iodine Isoflavones and Lignans Isoflavones Genistein Daidzein Equol O-Desmethylangolensin Lignans Enterodiol Enterolactone Acrylamide Hemoglobin Adducts* Acrylamide Glycidamide Glycidamide-to-acrylamide ratio Fat-Soluble Vitamins Nutrients Vitamins A and E and Carotenoids Vitamin A Retinyl palmitate* Retinyl stearate* Vitamin E gamma-Tocopherol alpha-Carotene trans-beta-Carotene cis-beta-Carotene* beta-Cryptoxanthin Lutein and zeaxanthin trans-Lycopene Total lycopene (cis- and trans-)* Vitamin D 25-Hydroxyvitamin D Fatty Acids* Saturated Myristic acid (14:0) Palmitic acid (16:0) Stearic acid (18:0) Arachidic acid (20:0) Docosanoic acid (22:0) Lignoceric acid (24:0) Monounsaturated Myristoleic acid (14:1n-5) Palmitoleic acid (16:1n-7) cis-Vaccenic acid (18:1n-7) Oleic acid (18:1n-9) Eicosenoic acid (20:1n-9) Docosenoic acid (22:1n-9) Nervonic acid (24:1n-9) Polyunsaturated Linoleic acid (18:2n-6) alpha-Linolenic acid (18:3n-3) gamma-Linolenic acid (18:3n-6) Eicosadienoic acid (20:2n-6) homo-gamma-Linolenic acid (20:3n-6) Arachidonic acid (20:4n-6) Eicosapentaenoic acid (20:5n-3) Docosatetraenoic acid (22:4n-6) Docosapentaenoic-3 acid (22:5n-3) Docosapentaenoic-6 acid (22:5n-6) Docosahexaenoic acid (22:6n-3) * Indicates NEW biochemical indicators or groups of indicators in the Second Nutrition Report