More Related Content
Similar to Cbre dubai market view q1 2010
Similar to Cbre dubai market view q1 2010 (20)
Cbre dubai market view q1 2010
- 1. CB RICHARD ELLIS
MarketView
Dubai, UAE
www.cbre.ae/research Q1 2010
OVERVIEW OFFICE MARKET
On 4th January the long-awaited opening The Dubai office market was subdued
of the Burj Khalifa - officially the tallest during the first quarter of 2010. Low levels
Trends building in the world, took place. Emaar’s of demand from existing and new entrants
showpiece tower was inaugurated by H.H. has added further pressure to lease and
Lease Rates Q1 Q1
09 10
Sheikh Mohammed Bin Rashid Al occupancy rates. Demand for office space
Maktoum. Q1 also saw the Dubai
Q remains fixed in the smaller size category,
g y,
Office Government announce plans for the as compared to larger spatial requirements
restructuring of Dubai World liabilities, of >500m² prior to the slowdown.
Residential although exact details of the proposal and
specifically how non-Government creditors Interestingly, residential properties that
Sale Prices Q1 Q1
would be repaid is still to be fully clarified. were converted into office units during the
09 10
peak are now returning to the market as
Office The 2010 Rent Cap law was announced residential product once more. Landlords
with rates maintained according to the are finding it increasingly difficult to let sub-
Hot Topics
Residential 2009 decree. The rental index from the standard office space in light of growing
Real Estate Regulatory Authority (RERA) supply and improving office quality.
remains the main reference point for
landlords and tenants in determining the Vacancy rates continue to grow as supply
Hot Topics from both existing buildings and new stock
rent for property in all defined areas.
increases. Tenants continue to prosper
A decree regarding the A new decree regarding the ownership of with greater availability of accommodation
ownership of land gifted granted land, was announced in March options driving lease rates lower. Notable
by the Government was 2010. Under the decree, UAE nationals cost savings remain possible for occupiers
announced in March will be allowed to own and develop taking existing fitted space, with
2010.
2010 commercial and i d t i l l d previously
i l d industrial land i l accommodation often available at no
d ti ft il bl t
gifted by the Government, provided that premium.
Lease rates in the CBD they pay 50% of its assessed value for
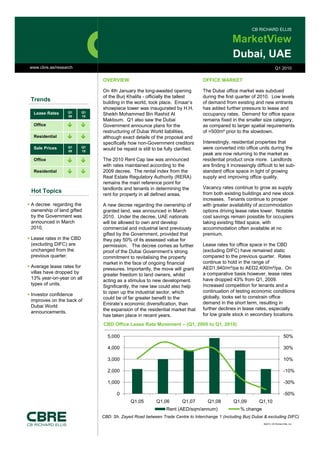
(excluding DIFC) are permission. The decree comes as further Lease rates for office space in the CBD
unchanged from the proof of the Dubai Government’s strong (excluding DIFC) have remained static
previous quarter. commitment to revitalising the property compared to the previous quarter. Rates
market in the face of ongoing financial continue to hold in the range of
Average lease rates for AED1,940/m²/pa to AED2,400/m²/pa. On
pressures. Importantly, the move will grant
villas have dropped by a comparative basis however, lease rates
greater freedom to land owners, whilst
13% year-on-year on all
year on year have dropped 43% from Q1 2009
Q1, 2009.
acting as a stimulus t new development.
ti ti l to d l t
types of units. Increased competition for tenants and a
Significantly, the new law could also help
to open up the industrial sector, which continuation of testing economic conditions
Investor confidence
could be of far greater benefit to the globally, looks set to constrain office
improves on the back of
Emirate’s economic diversification, than demand in the short term, resulting in
Dubai World
the expansion of the residential market that further declines in lease rates, especially
announcements.
has taken place in recent years. for low grade stock in secondary locations.
CBD Office Lease Rate Movement – (Q1, 2005 to Q1, 2010)
5,000 50%
4,000 30%
3,000 10%
2,000 -10%
1,000 -30%
30%
0 -50%
Q1,05 Q1,06 Q1,07 Q1,08 Q1,09 Q1,10
Rent (AED/sqm/annum) % change
CBD: Sh. Zayed Road between Trade Centre to Interchange 1 (including Burj Dubai & excluding DIFC)
©2010, CB Richard Ellis, Inc.
- 2. The DIFC area is now experiencing slight lease rate falls in both private developer and DIFC-owned properties,
although rental rates are still at a premium over other prime districts, remaining in the range of AED3,230/m²/pa to
MarketView Dubai UAE
AED4,305/m²/pa.
Secondary locations continue to struggle in maintaining occupancy ratios, despite some of the lowest lease rates in five
years. Freehold locations which have emerged over the past three years remain worst effected, predominantly as a
result of a huge number of completions over a short period Lease rates in the freehold locations of Jumeirah Lakes
period.
Towers and Dubai Silicon Oasis now range between AED538/m²/pa to AED860/m²/pa. Landlords have even started to
offer lease rates inclusive of service charges in order to maintain high occupancy ratios. Even with these measures,
occupancy and lease rates continue to drop.
Declining lease and occupancy rates, combined with new stock entry in the freehold locations, has seen investors shy
away from the transactional market as fears over further declines remain. Prime locations are now showing some
renewed interest as a clear two tier market emerges. Secondary locations remain worst effected, with sales rates
comparable with those of 2005 and 2006.
During Q1 2010, around 180,000m² of new office space entered the market, an increase of 4% in the total stock. Of
this total new space, 67% entered in secondary, freehold locations.
RESIDENTIAL MARKET
Compared to the previous quarter, lease rates in Q1, 2010 witnessed only a marginal slip. However, on an annual
basis, rates for apartments dropped by a more noteworthy 23%, across the 22 districts reviewed. The lease rate falls
have been larger in leasehold locations than in freehold locations. Product quality, building facilities and the general
level of finishing quality within leasehold projects does not compare well against the freehold equivalent. The 12 non-
freehold locations analysed h
f h ld l ti l d have experienced a 26% fall, against a 20% drop in the 10 f h ld di t i t
i d f ll i t d i th freehold districts.
Lease rates for residential villas have also fallen across all villa districts. However, the percentage drop has been low
compared to that of apartments, a consequence of basic supply dynamics. On average, lease rates for villas have
dropped by 13% on annual basis across all unit types. Due to the location and offering, lease rates in freehold
locations are typically faring better than leasehold locations. The average rate for a three bedroom villa in a freehold
location is now AED185,000/unit/pa, whilst in a leasehold locations it is AED140,000/unit/pa. A comparison between
freehold and leasehold locations reveals that the drop has been 10% in freehold locations and 15% in leasehold
locations. The sharpest falls in leasehold location lease rates have taken place in Al Barsha and Mirdiff due to
significant increases in stock during the last year
year.
Service charges across freehold locations remain a concern for both current and would-be investors. Falling lease
rates have served to accentuate excessive service charge rates set by developers during the peak. As lease rates
continue to decline, rental yields become further impacted. With the establishment of ‘Owners Associations’ still to take
place, developers are suspected of exploiting owners for profit, rather than actually servicing developments for the
benefit of tenants. The issue of service charges is thus likely to be a major talking point during 2010, and something
that will need the proper attention of RERA to help further improve transparency and in order to stimulate and
encourage greater investment activity moving forward.
Villa Lease Rates – Q1, 2009 to Q1,2010
600
Q1,2009 Q1,2010
500
m)
(000'AED/unit/annum
400
300
200
100
Q1 2010
0
2BR 3BR 4BR 5BR 6BR 7BR
Page 2 ©2010, CB Richard Ellis, Inc.
- 3. OUTLOOK
ubai, UAE
The Dubai outlook has been somewhat buoyed by the Government’s announcement on the Dubai World debt
restructuring, specifically the news that Nakheel is to receive funds in order to begin payment of its contractors and
sub-contractors. Repayment progress by Nakheel has been a burning issue over the past year, and an area of
resolution that is seen to be essential in rebuilding the Dubai brand. The Dubai Government has indicated that it will
MarketView Du
inject a total of US$9.5bn into Dubai World, with Nakheel receiving the vast majority. The positive implications for the
property industry are obvious, however there are still a number of major obstacles before any real recovery can be
expected.
A number of banks have made moves to relax lending terms in order to help stimulate growth in the mortgage market.
Some banks are now offering attractive 25:75 lending options, along with mortgage rates ranging from 5.75% to
6.75%. As a result, we anticipate some modest activity in the transactional market. However, this activity will be
largely focused on already established locations and properties ready for occupation.
The outlook for commercial office space is for another challenging year, with further downward movement for lease
year
and occupancy rates as multiple projects in their final stages of construction begin to enter the market. The
availability of office space from existing buildings as well as new office towers will see increased competition for
tenants and this will impact most for landlords with inferior office product. The CBD, which historically enjoyed
vacancy levels within single digits, will see further movement into double digits, although it will continue to fare better
than secondary and tertiary locations as occupiers are able to enjoy a flight to quality.
For more information regarding the MarketView, please contact:
Matthew Green Mohammed Faheem
Head of Research & Consultancy, UAE Senior Research Analyst
CB Richard Ellis, Middle East CB Richard Ellis, Middle East
Building 6, 8th Floor Building 6, 8th Floor
Emaar Square Emaar Square
Dubai, UAE Dubai, UAE
t: +971 4 437 7200 t: +971 4 437 7200
e: matthew.green@cbre.com
g @ e: mohammed.faheem@cbre.com
@
Disclaimer 2010 CB Richard Ellis
Information h i h b
I f ti herein has been obtained f
bt i d from sources b li
believed t b reliable. Whil we d not d bt it accuracy, we h
d to be li bl While do t doubt its have not verified it and make
t ifi d d k
no guarantee, warranty or representation about it. It is your responsibility to independently confirm its accuracy and completeness. Any
Q1 2010
projections, opinions, assumptions or estimates used are for example only and do not represent the current or future performance of the market.
This information is designed exclusively for use by CB Richard Ellis clients, and cannot be reproduced without prior written permission of CB
Richard Ellis.
© Copyright 2010 CB Richard Ellis.
Page 3 ©2010, CB Richard Ellis, Inc.