Download to read offline


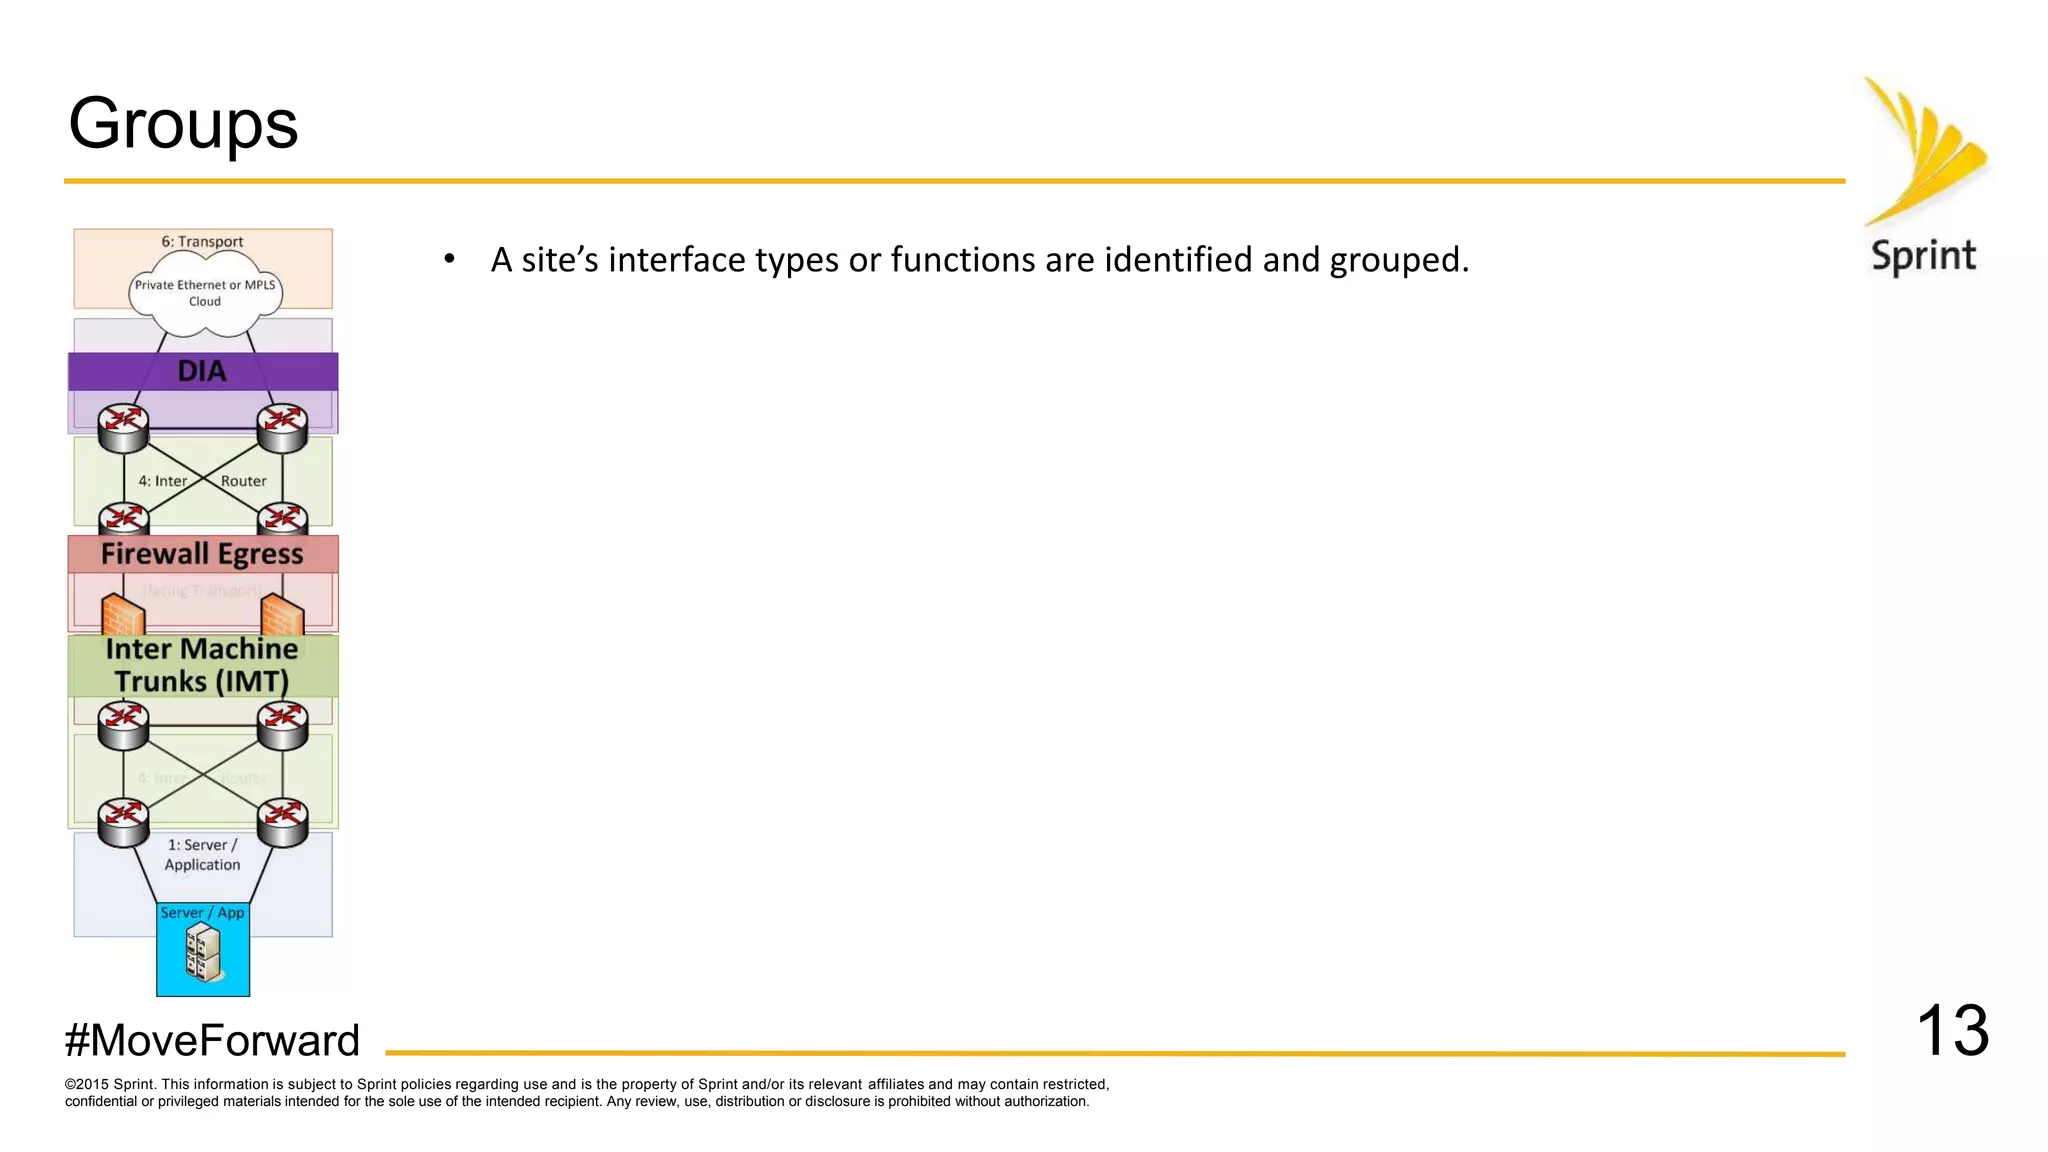
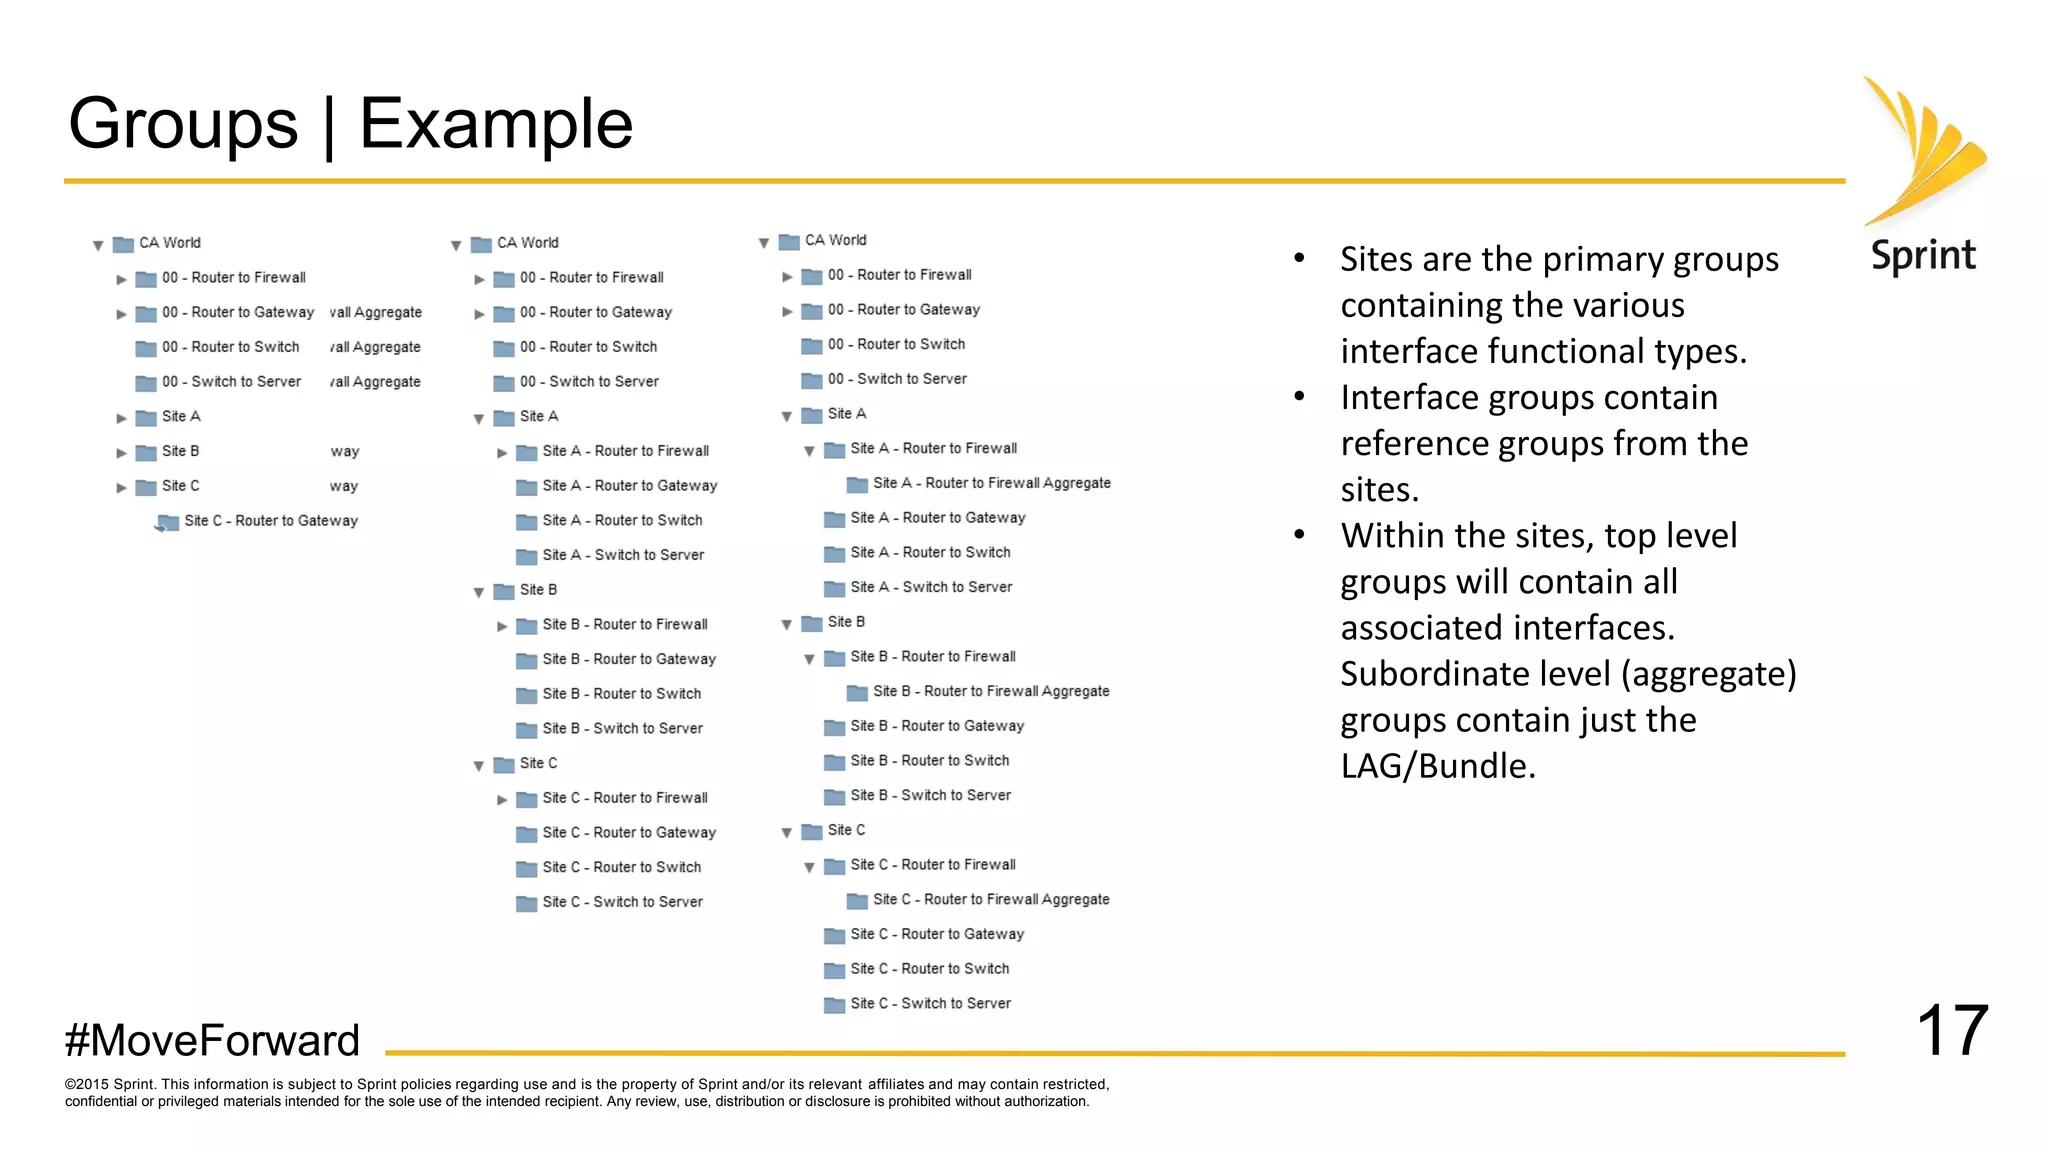
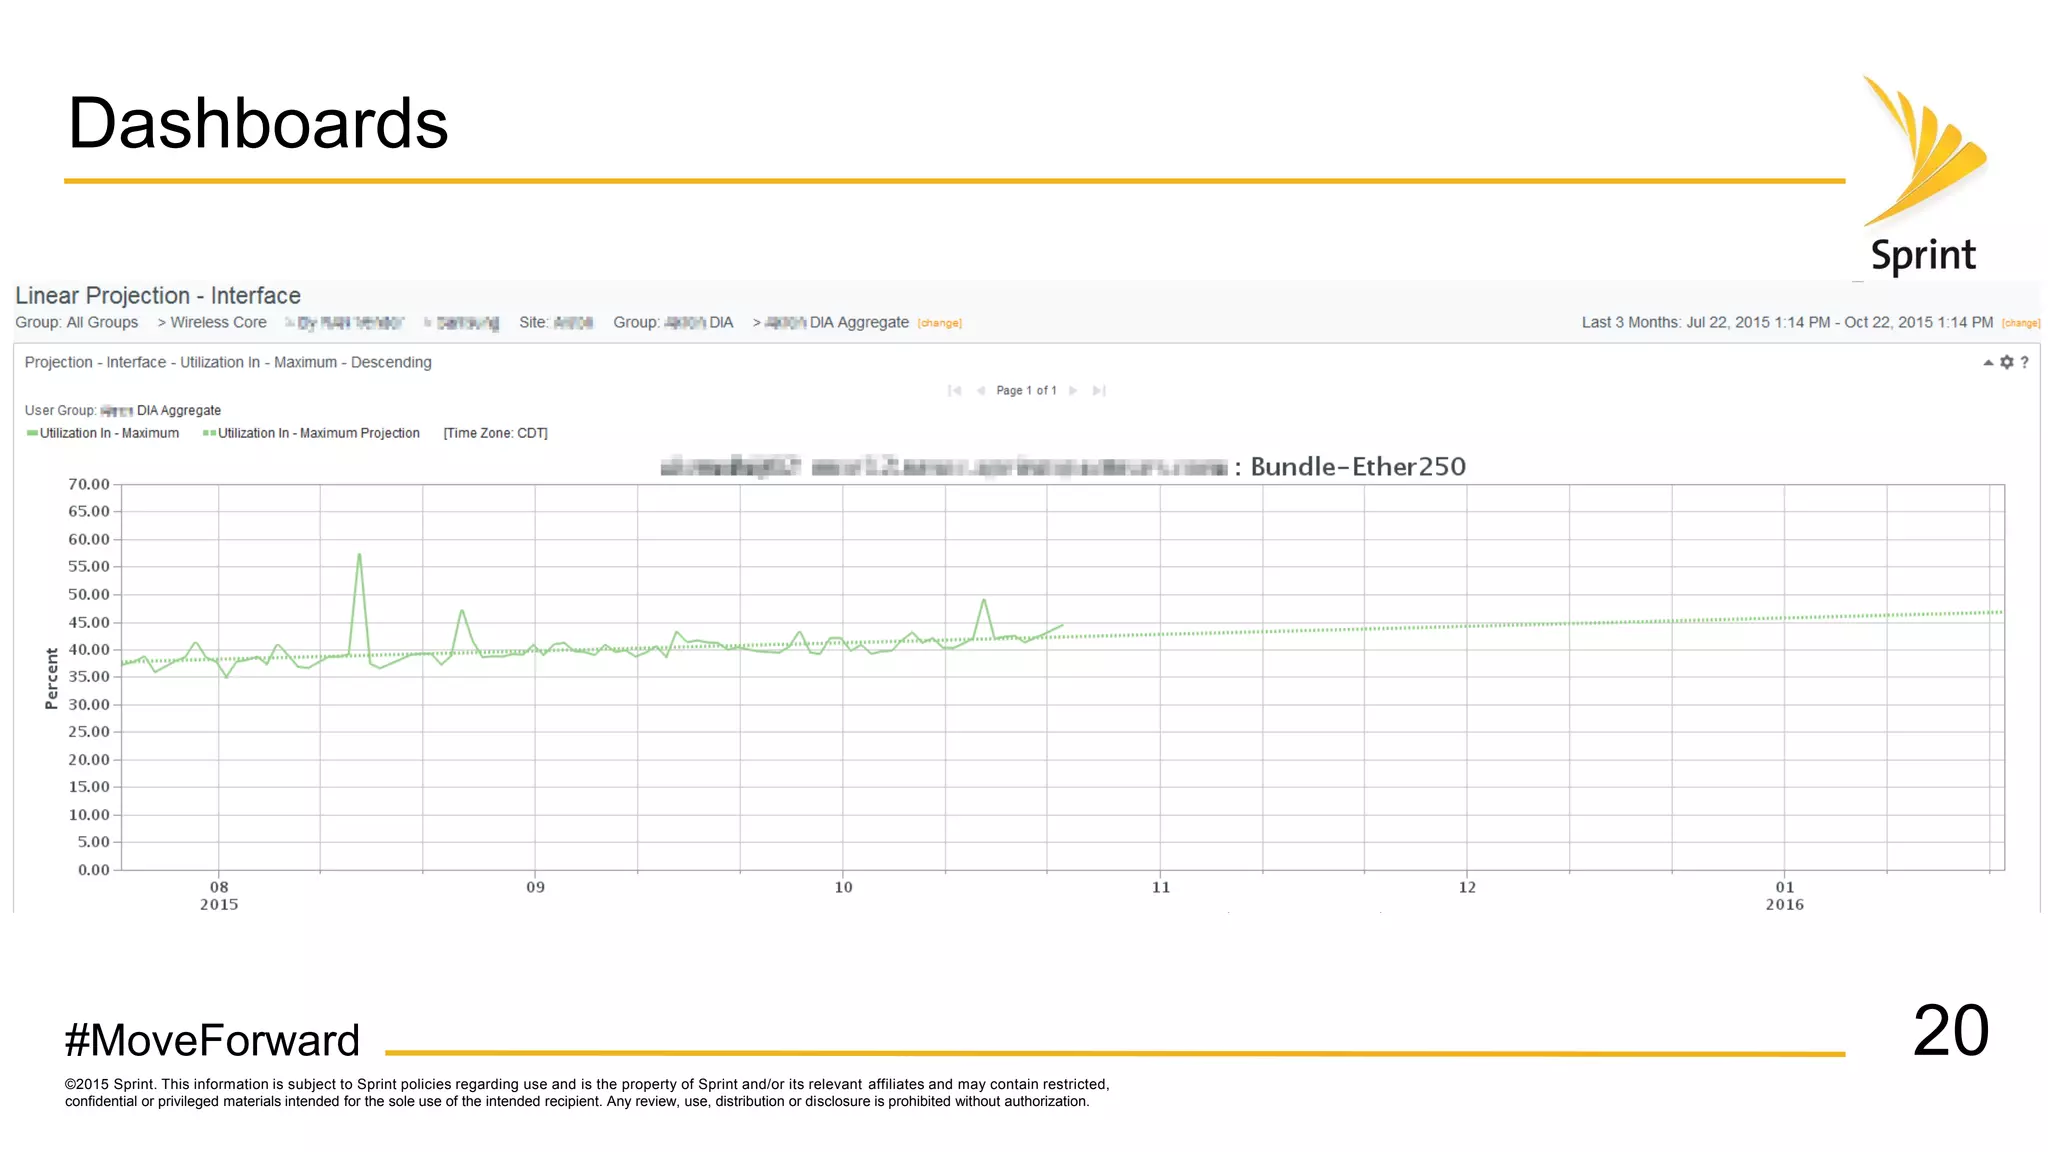
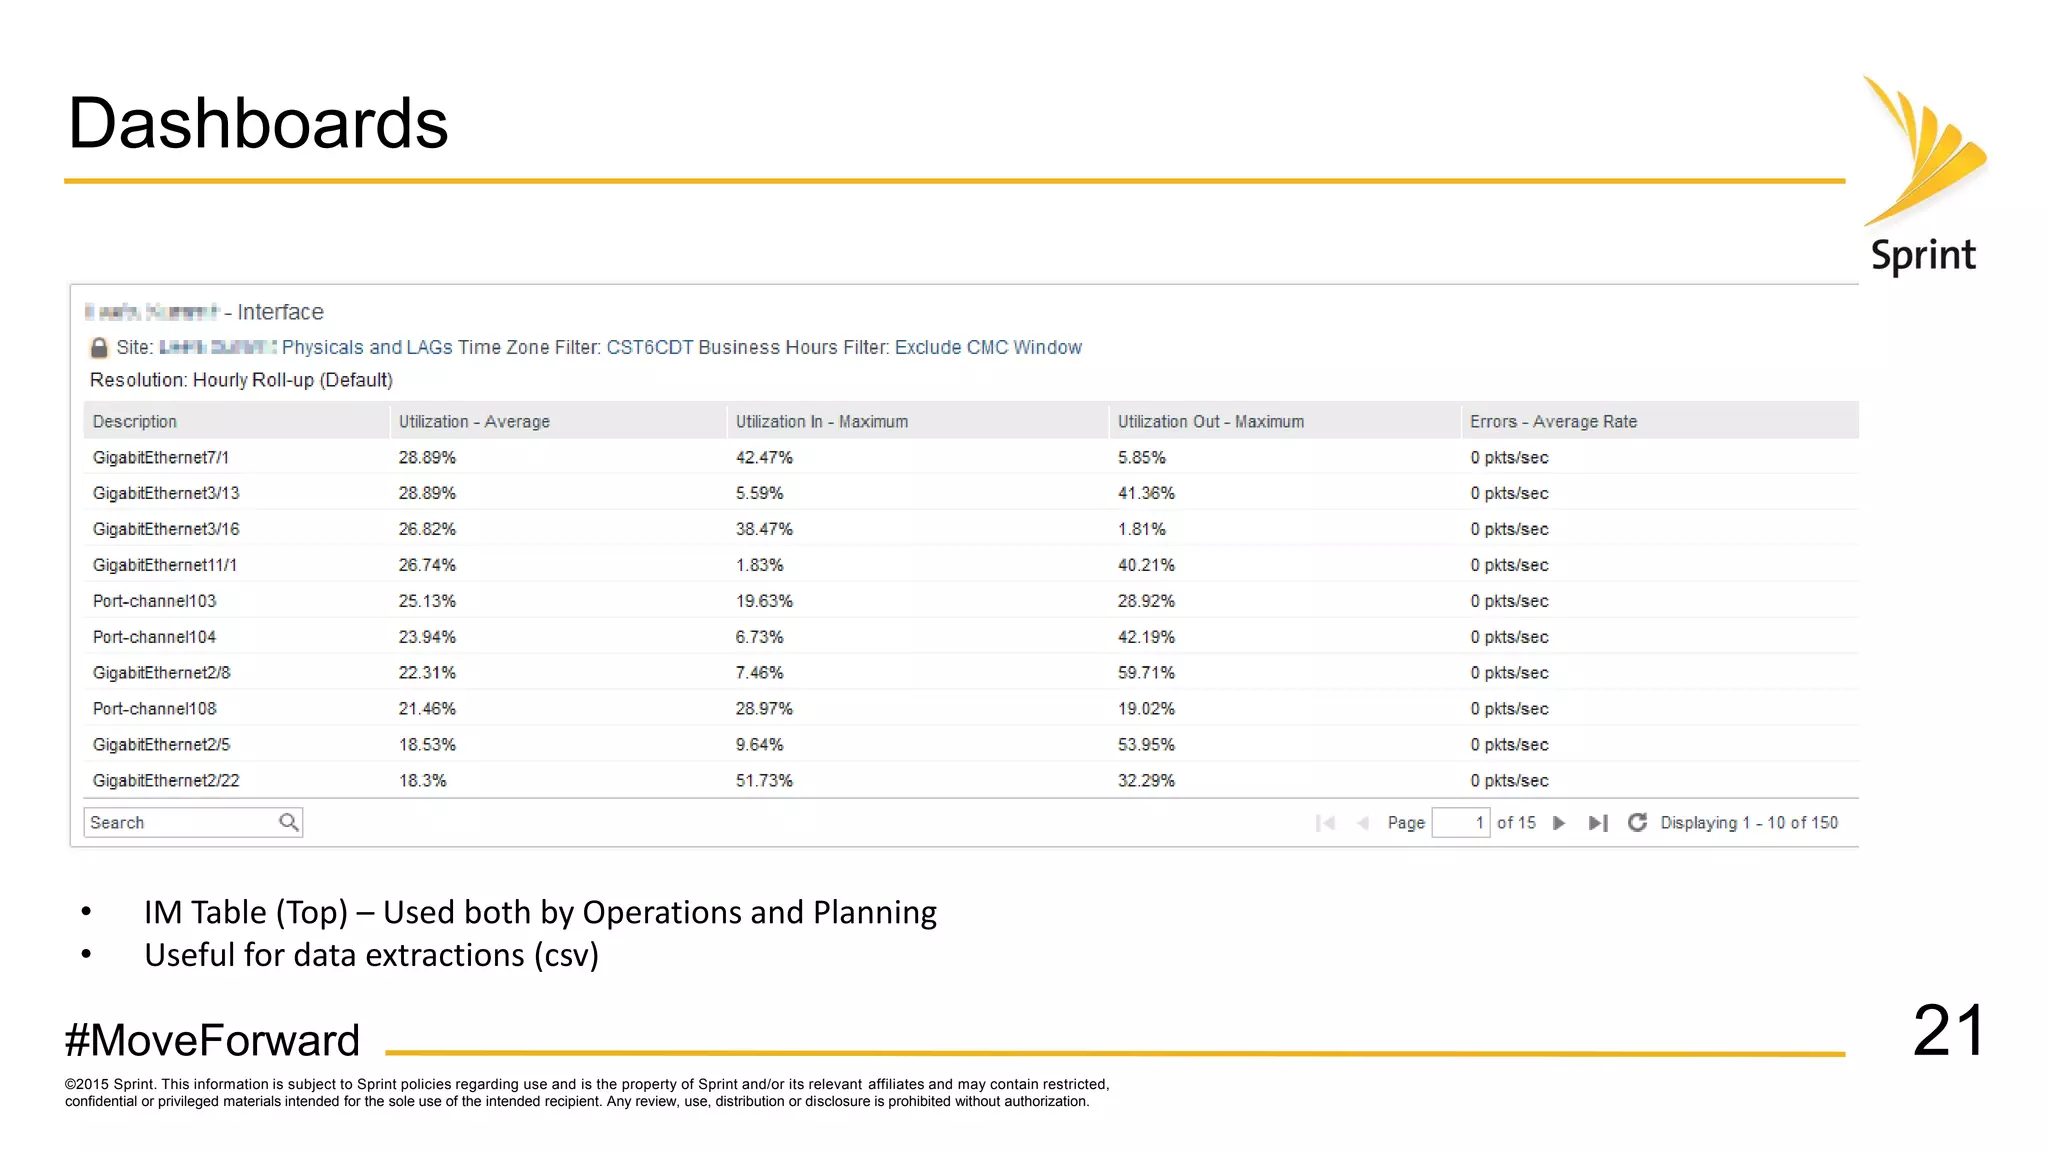
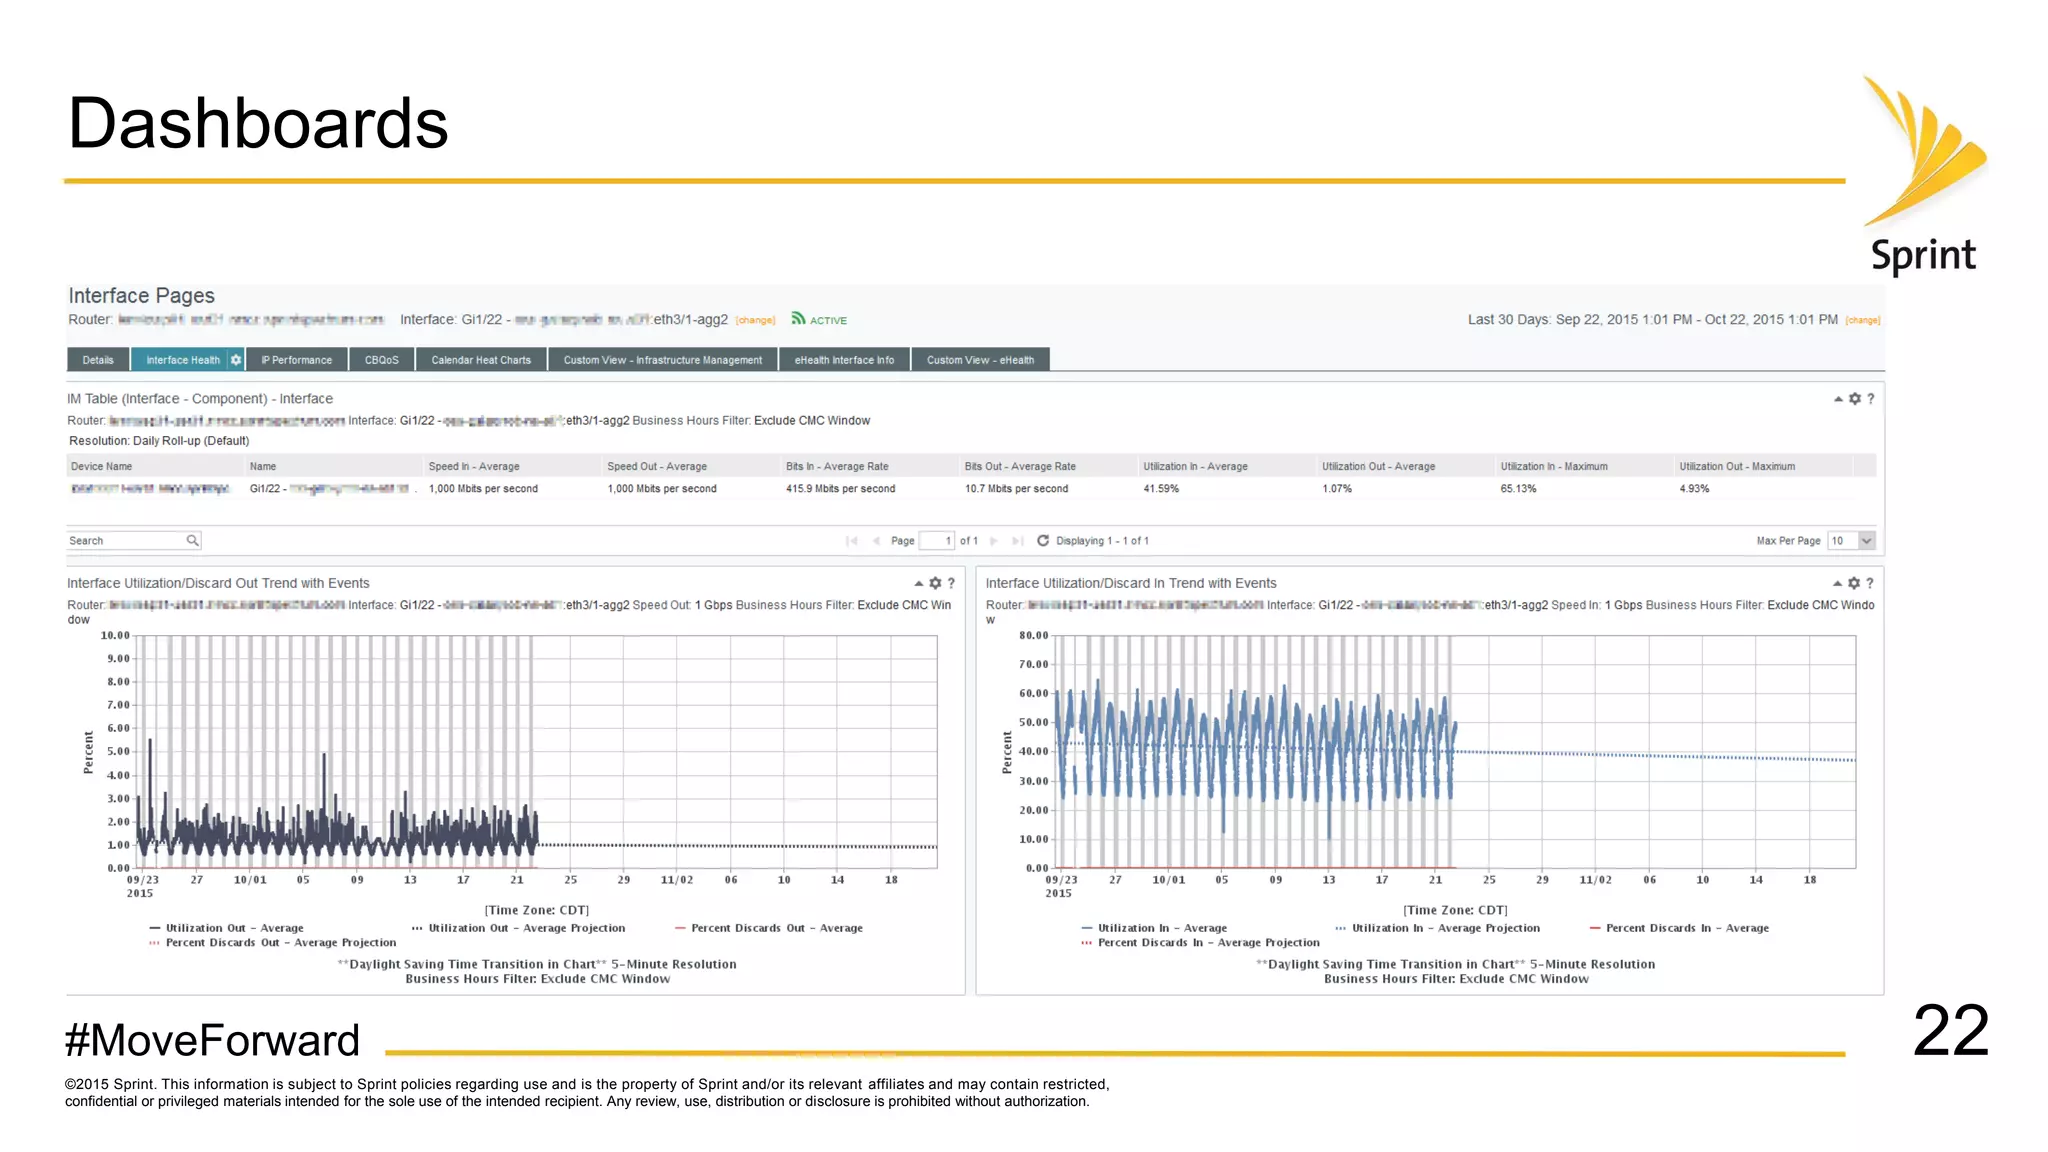

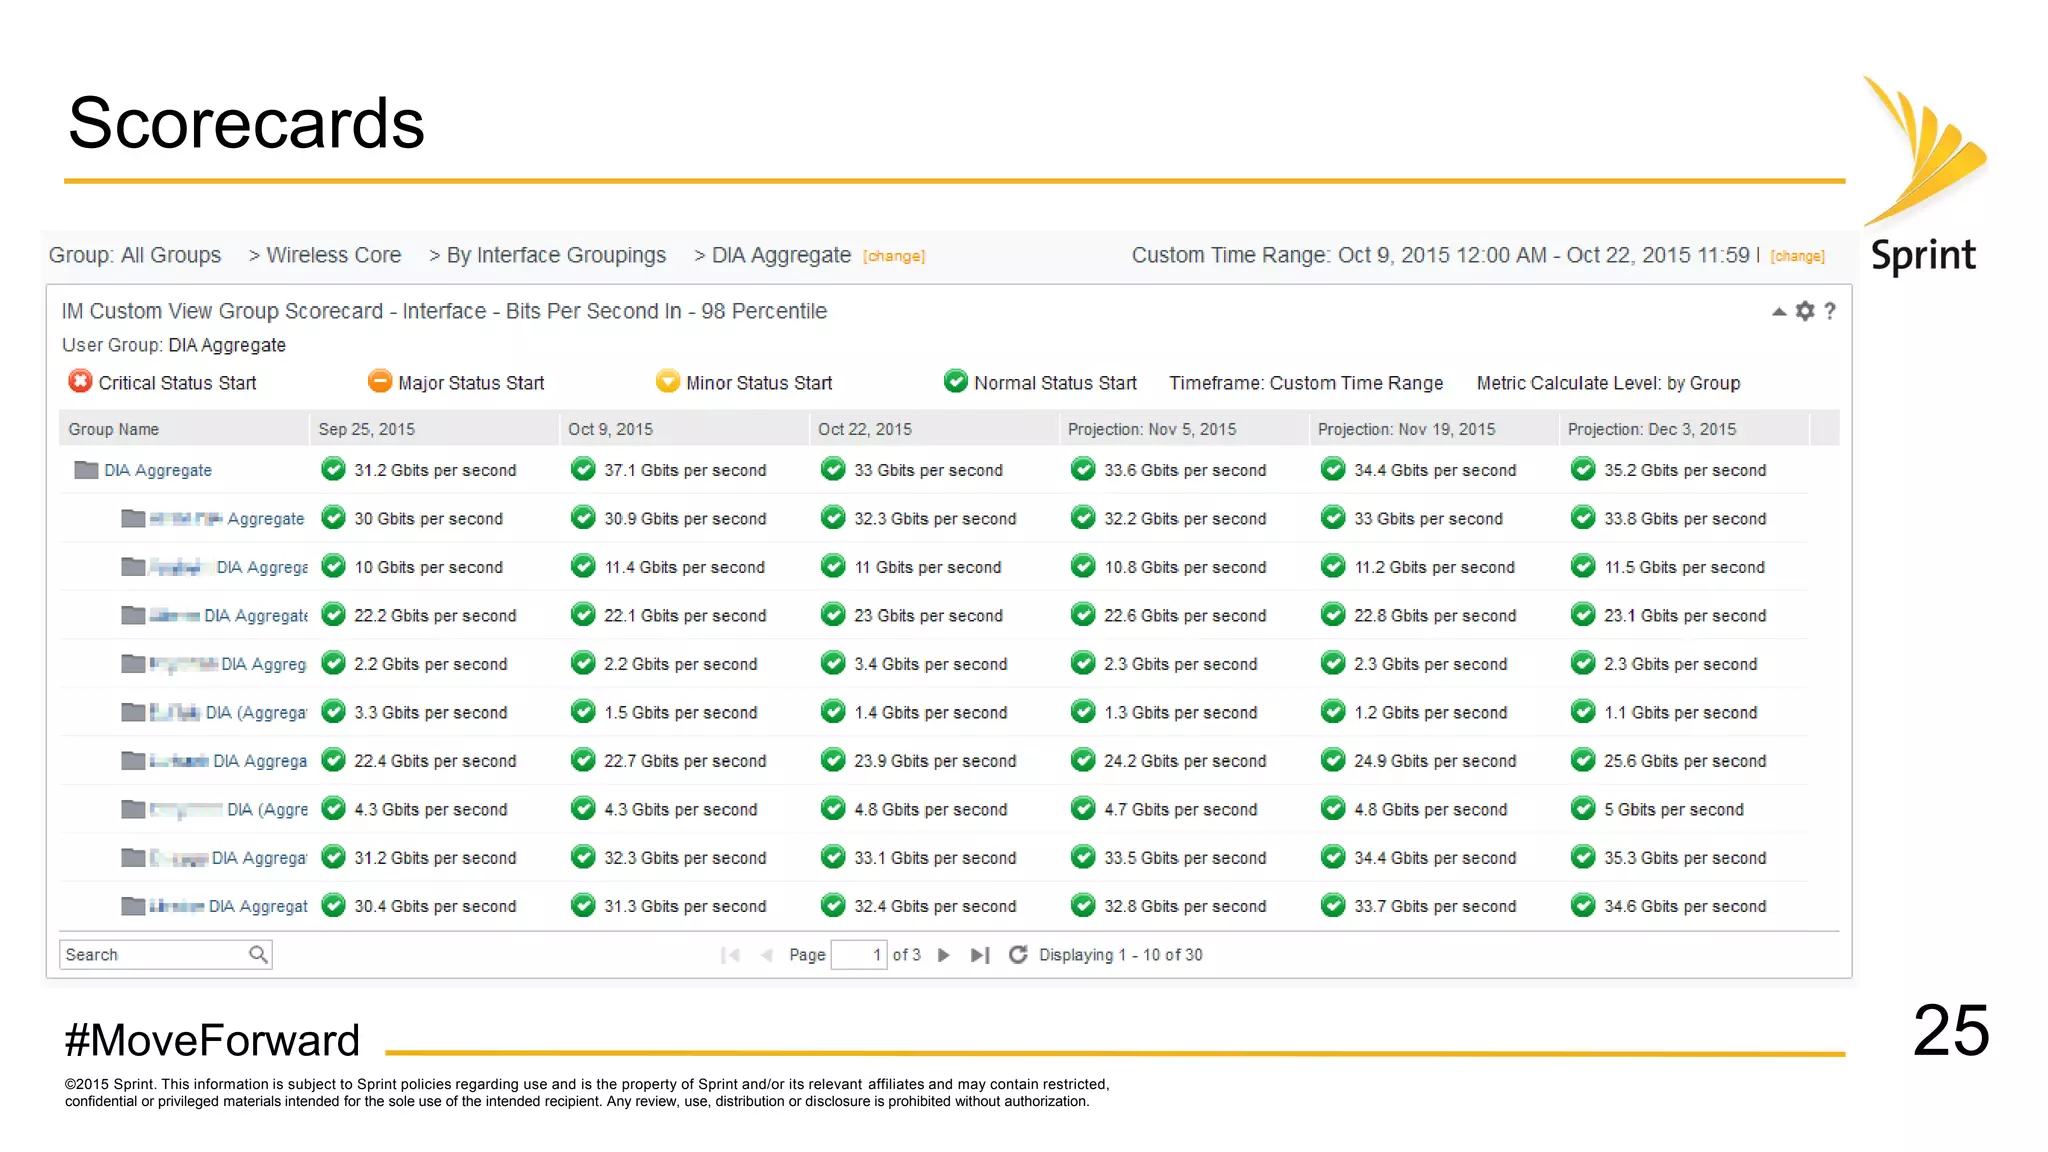
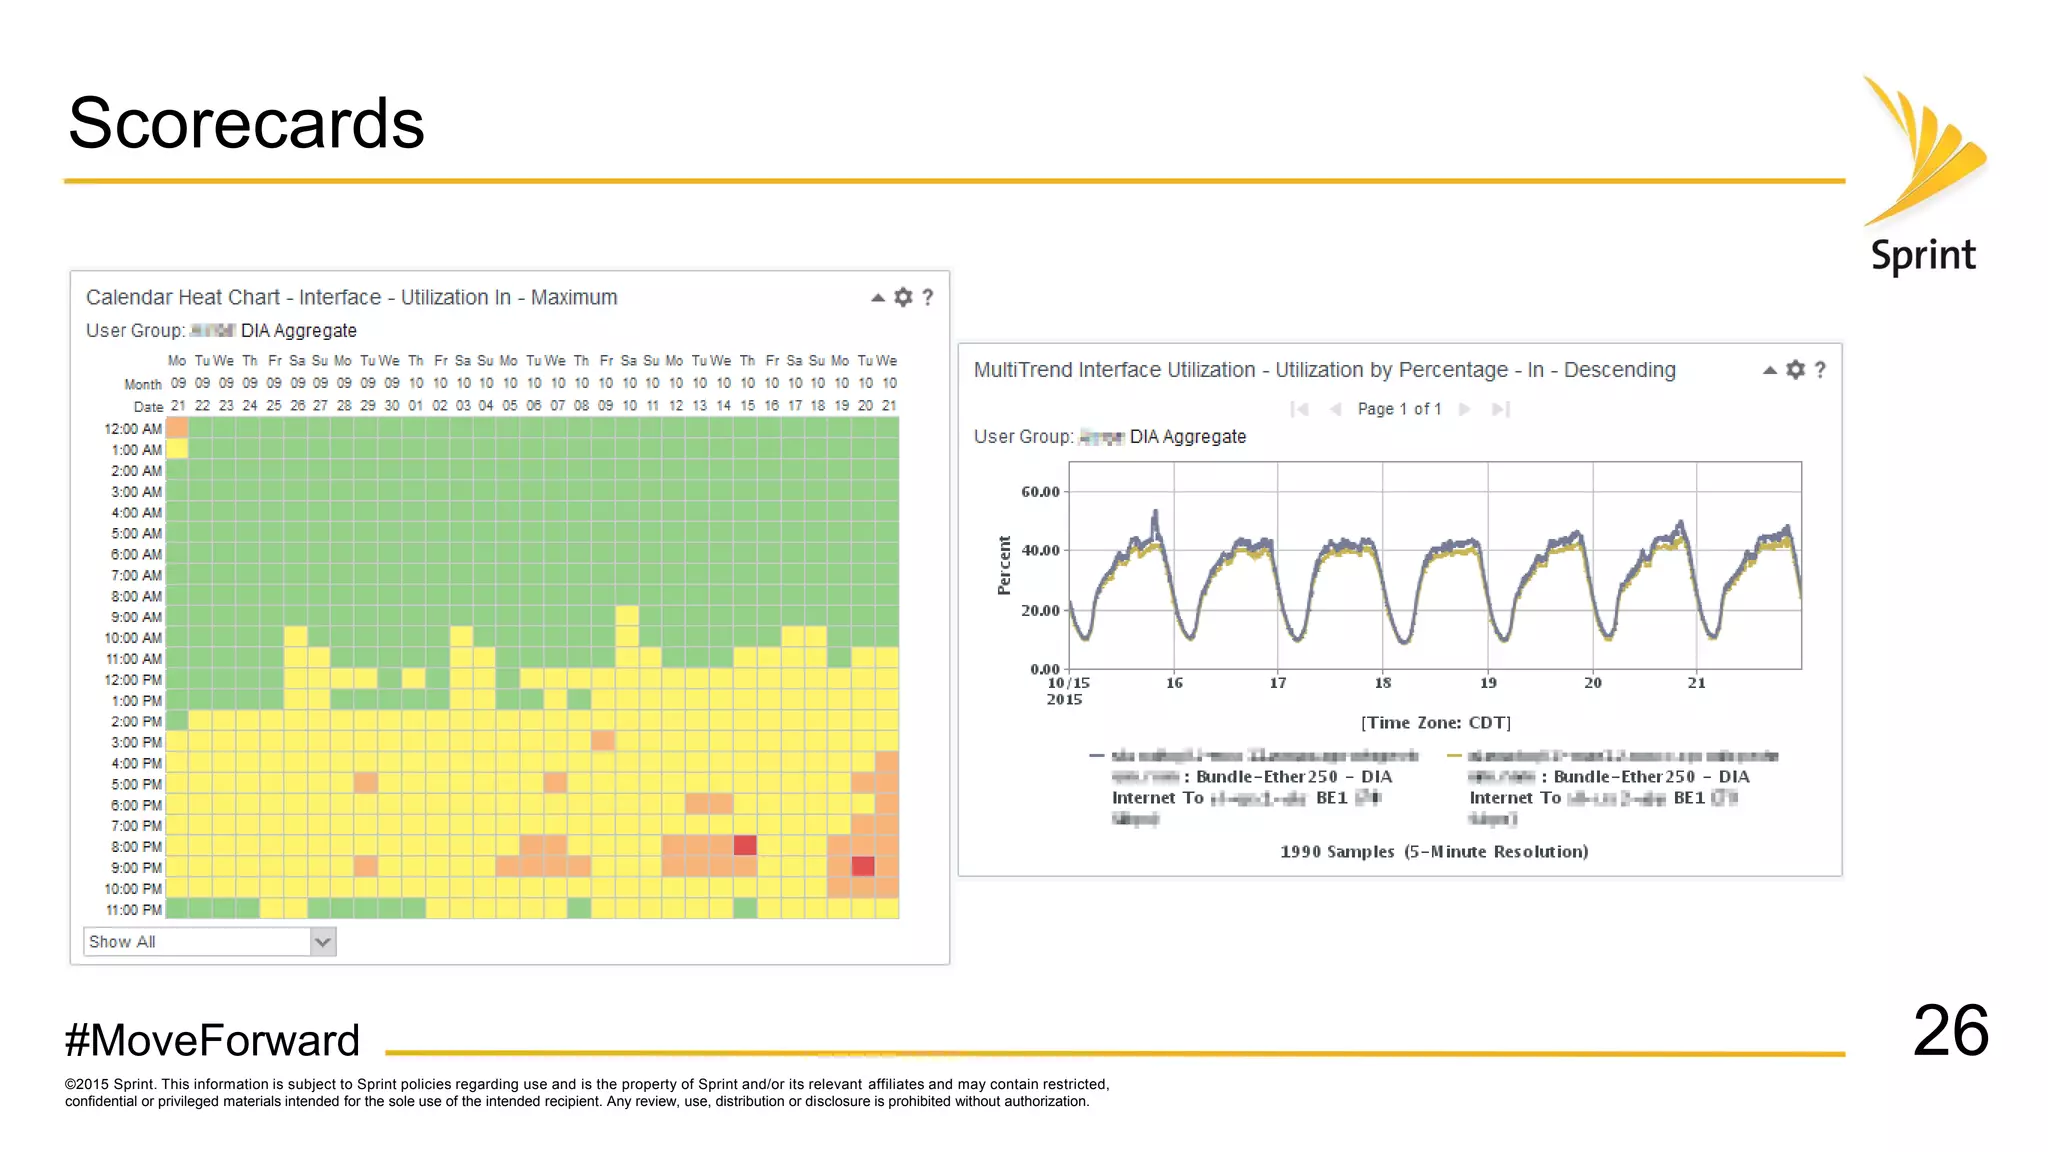


Sprint uses CA Performance Management to monitor over 50,000 network devices and 2 million interfaces across its 40,000 physical locations. It groups interfaces and devices by site and function to create dashboards and scorecards for network planning, operations, and engineering teams. Key dashboards include interface and group views using tables and trend graphs. Scorecards provide a summary view of metric projections and utilization for interface bundles across the network. The flexible grouping allows limitless reporting combinations to meet various user needs.


