Download to read offline

![Oleksandr Rohozynsky and Irina Sinitsina
35
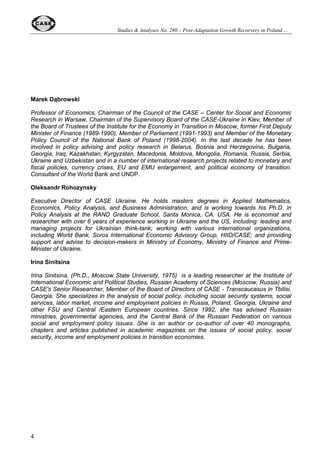
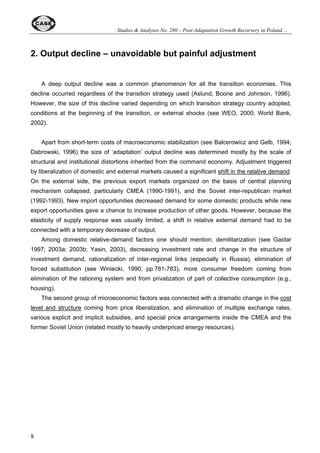
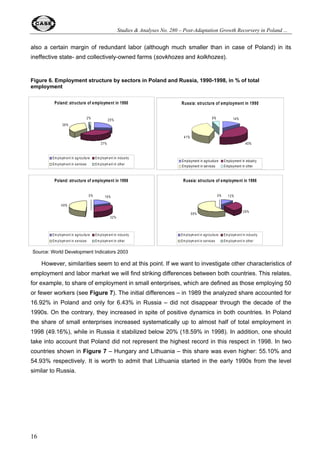
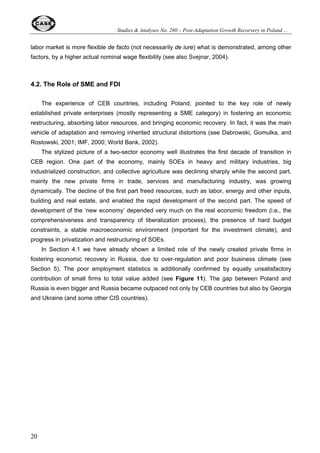
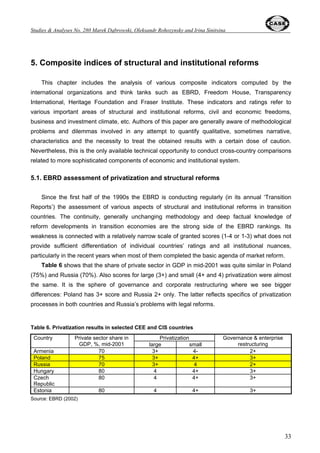
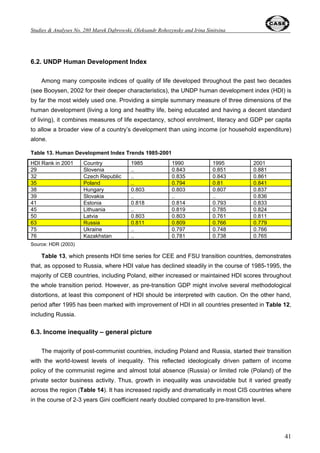
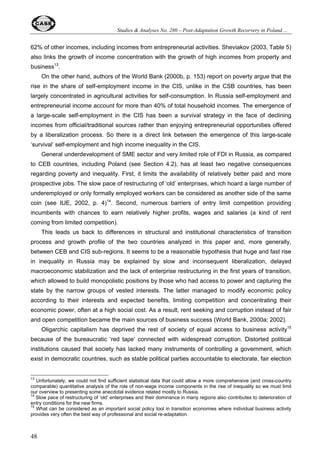
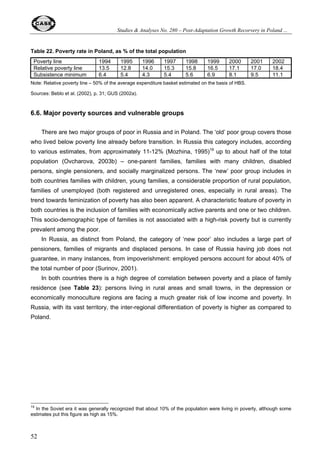
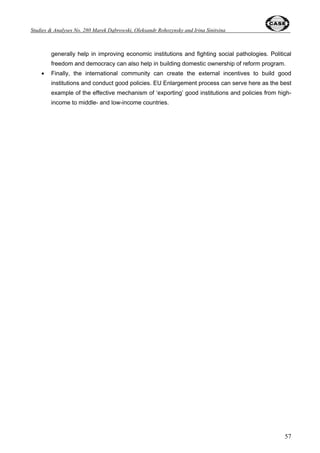
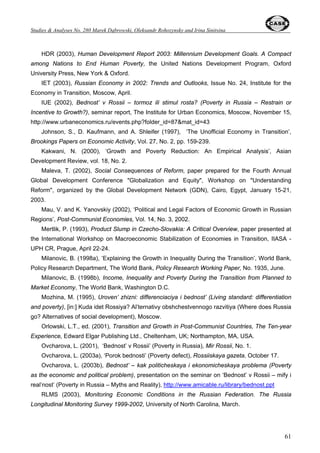
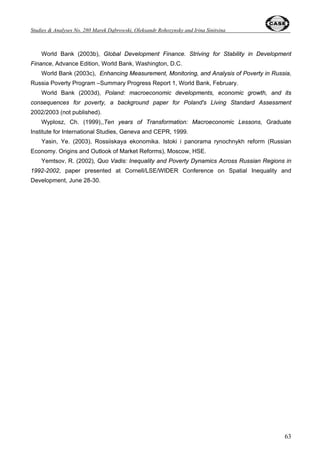
Figure 21. Structural Reform Index (normal economy=1)
+XQJDU
]HFK 5HSXEOLF
(VWRQLD
6ORYDNLD
/LWKXDQLD
3RODQG
%XOJDULD
/DWYLD
5RPDQLD
(8 FDQGLGDWHV
*HRUJLD
.UJ]VWDQ
0ROGRYD
$UPHQLD
.D]DNKVWDQ
8NUDLQH
$]HUEDLMDQ
5XVVLD
7DMLNLVWDQ
8]EHNLVWDQ
%HODUXV
7XUNPHQLVWDQ
,6
Note: The composite structural reform index consists of 73 percent liberalization and 27 percent privatization.
Source: Aslund and Warner (2003) based on EBRD structural indices
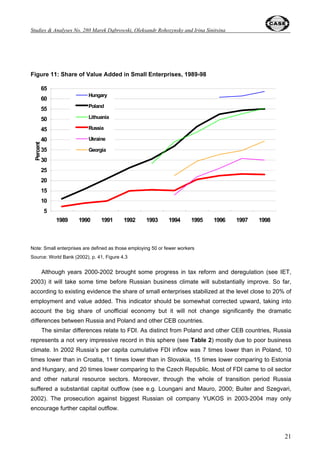
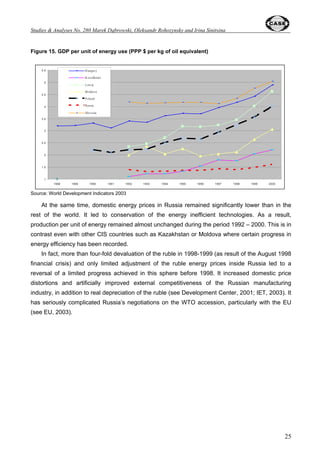
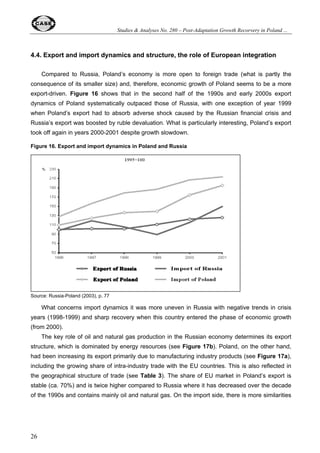
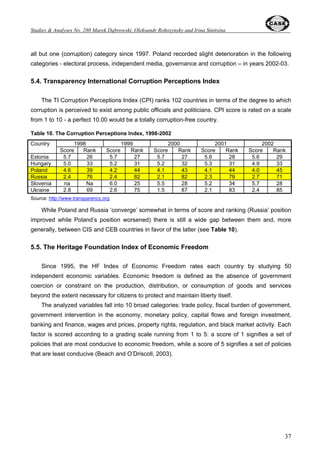
The two analyzed countries do not occupy leader positions in their regional groups (Poland in
the EU candidates group and Russia in the CIS group). There are five countries recording better
scores than Poland: Hungary, Czech Republic, Estonia, Slovakia and Lithuania. However,
Poland’s position is visibly better than Russia’s one.
5.3. Freedom House indices
Since 1972, the Freedom House has published an annual assessment of the state of freedom
worldwide on the basis of political rights and civil liberties rating on a one-to-seven scale. These
countries, which rating averages 1-2.5 are generally considered as ‘Free’, 3-5.5 – ‘Partly Free’, and
5.5-7 – ‘Not Free’.
Russia, while formally remaining in the ‘Partly Free’ category, has steadily decreased its rating,
closely approaching the ‘Not Free’ status (see Table 8). This is in sharp contrast with the stable
high rating of Poland and other CEB countries accomplished already in the beginning of 1990s.
More importantly, the progress in democratization and human rights standards has been strongly
correlated with progress in economic reforms with causality going in both sides but being more
important in relation to political reforms as factor determining the economic progress (see also
Dabrowski and Gortat, 2002). Empirical research conducted in the Russian regions also confirm
that guarantees of basic human rights and civil liberties have the fundamental importance for
business and investment climate (see Mau and Yanovskiy, 2002).](https://image.slidesharecdn.com/sa280-141105045829-conversion-gate02/85/CASE-Network-Studies-and-Analyses-280-Post-Adaptation-Growth-Recovery-in-Poland-and-Russia-Similarities-and-Differences-56-320.jpg)

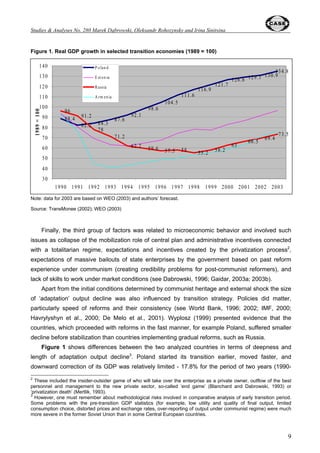
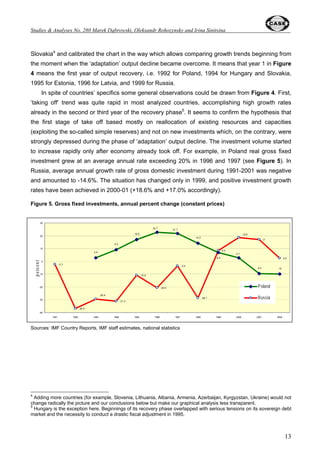
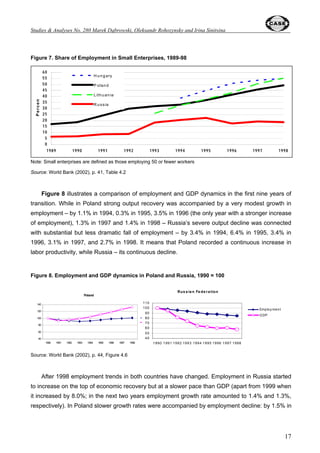
The document analyzes post-adaptation growth recovery in Poland and Russia, focusing on their economic and social characteristics following initial output declines during their transition periods. It highlights differences in reform strategies, with Poland being a fast reformer and Russia experiencing significant challenges due to slower reforms and a reliance on oil. The authors discuss the implications of these growth patterns, particularly in relation to poverty, income inequality, and the structural issues faced in both countries.


