SlideShare a Scribd company logo
WPS3894 
LABOR MARKET DEVELOPMENTS 
DURING ECONOMIC TRANSITION* 
Jan Rutkowski 
World Bank Policy Research Working Paper 3894, April 2006 
The Policy Research Working Paper Series disseminates the findings of work in progress to encourage the exchange 
of ideas about development issues. An objective of the series is to get the findings out quickly, even if the 
presentations are less than fully polished. The papers carry the names of the authors and should be cited 
accordingly. The findings, interpretations, and conclusions expressed in this paper are entirely those of the authors. 
They do not necessarily represent the view of the World Bank, its Executive Directors, or the countries they 
represent. Policy Research Working Papers are available online at http://econ.worldbank.org. 
*This paper was prepared as a background paper for the 2005 ECA Labor Market Study. 
I would like to thank Mamta Murthi for helpful comments, and Barbara Ziolkowska for 
preparing the paper for publication.
INTRODUCTION 
The purpose of this paper is to identify key labor market trends and patterns which have 
emerged during the economic transition in Europe and Central Asia (ECA). The paper argues 
that the scarcity of productive job opportunities and growing labor market segmentation are the 
two main labor market problems in ECA.1 In the European transition economies (ETE)the lack 
of jobs has led to persistent open unemployment. In the Commonwealth of Independent States 
(CIS) it has led to hidden unemployment (underemployment or low-productivity employment). 
Unemployment in the European transition economies is supported by the developed social safety 
net. In contrast, in the CIS for most workers unemployment is not an affordable option. They 
either stick to their old, unproductive jobs in unrestructured enterprises, or work in the informal 
sector, or resort to subsistence agriculture. Low-productivity employment in the CIS is a mirror 
image of unemployment in the European transition economies. Accordingly, the high 
employment-to-population ratios still prevailing in many CIS countries do not necessarily signify 
favorable labor market performance. Instead they often indicate delayed enterprise restructuring, 
the maintenance of unsustainable jobs in uncompetitive firms, and the existence of a large 
informal sector as an employer of last resort. Labor market segmentation in transition economies 
has been caused by a sharp increase in earnings differentials and an attendant increase in the 
incidence of low-paid jobs, by the polarization of regional labor market conditions, and finally 
by the growth of the informal sector offering casual, low-productivity jobs. Labor market 
segmentation and accompanying inequalities are more pronounced in the CIS than in the 
European transition economies. 
The scope of this paper is limited to the review of key labor market developments during 
the transition. A more in depth analysis of labor market transition is provided in (Svejnar, 1999). 
Useful discussion of labor market outcomes during the transition is also provided in Boeri and 
Terrel (2002) and Riboud et al. (2002). Rashid and Rutkowski (2001) examine labor market 
outcomes at an earlier stage of the transition. 
The paper consists of four sections. Section I looks at labor force (quantity) adjustment 
to various macroeconomic shocks that hit transition economies countries during the 1990s. 
Section II focuses on the characteristics of unemployment in ECA. Section III examines the 
wage (price) adjustment. Section IV summarizes key stylized fact on labor market transition.. 
1 The term “European transition economies” (ETE) refers to countries of Central and Eastern Europe (CEE) and 
Southern and Eastern Europe (SEE). The latter includes countries of the former Yugoslavia except Slovenia plus 
Albania. The Commonwealth of Independent States (CIS) is comprised of the countries of the FSU: Belarus, Russia 
and Ukraine (BRU), and the other CIS countries. The latter include so called CIS-7 and Kazakhstan (CIS-7 + K). 
2
I. LABOR FORCE, EMPLOYMENT AND UNEMPLOYMENT 
Large employment reductions in European transition economies and modest ones in the 
CIS 
One key feature of the labor market under the soviet-style socialism was high labor force 
participation and full employment. Unemployment was virtually nonexistent. Full employment 
was achieved through overstaffing made possible by the soft budget constraint. Overstaffing, 
also referred to as labor hoarding, meant that enterprises were employing more workers that was 
necessary to produce given output. This meant “unemployment on the job” and low labor 
productivity, which translated into low wages. 
The situation was different in Yugoslavia, where enterprises were exposed to competition 
and faced harder budget constraint. In addition, labor managed firms – the salient feature of the 
Yugoslav system – did not have an incentive to maximize employment, but instead awarded 
workers, who formally owned the firm, higher wages. 
Profound institutional and structural changes associated with the economic transition – 
economic liberalization, privatization, hard budget constraint, and the emergence of product 
market competition – as well as the disintegration of existing economic ties led to a substantial 
drop in output. This was followed by both employment and wage adjustments, although the 
patterns of adjustment varied by sub-regions. Generally, in European transition economies the 
burden of adjustment fell on employment, while in the FSU countries the burden of adjustment 
fell on wages. 
In European transition economies employment is presently 20 to 30 percent lower than 
before the transition. The job loses were heavily concentrated during the first phase of the 
transition (until the mid-1990s) and continued at a much slower pace afterwards. After all, since 
the late 1990s some countries (the Baltic states, Hungary, Slovenia) have seen net job creation 
and employment growth. Romania is an exception to this pattern, as employment started to 
decline there later than in other countries, indicating delayed restructuring. 
As to the middle-income CIS, in Kazakhstan and Ukraine job losses were of similar 
magnitude as in the Central and East European (CEE) countries (some 30 percent), with job 
destruction accelerated in the second half of the 1990s, again pointing to delayed restructuring. 
In contrast, in Belarus and Russia, the drop in employment was much more modest, accounting 
for around 15 percent. 
In the low-income CIS countries the fall in employment apparently has been much more 
modest than in other transition economies, although for many countries consistent time series on 
employment are lacking. For example, in Moldova employment declined by less than 10 percent 
during 1990-2002. In a few CIS-7 countries (Azerbaijan, Kyrgyz Republic, Uzbekistan) 
employment has started to increase in the late 1990s. 
3
Box 1 Measurement of employment: household vs. firm based surveys 
The magnitude of measured employment decline in transition economies depends on the 
statistical source. It tends to be much larger if data come from firm based Employment surveys, and 
relatively smaller if data comes from the household based Labor Force Survey (LFS). The discrepancy 
stems from the fact that firm based surveys cover only registered, formal sector firms, while the LFS in 
principle provides data on all employed individuals. Thus, the difference in employment between those 
two sources is an approximate measure of informal sector employment, employment in small private 
firms, which often are under-represented in employer based-surveys, and self-employment. This 
difference also reflects the changing nature of jobs in ECA. There has been a partial shift from regular 
full-time jobs toward casual jobs, often in the informal sector, as well as a partial shift form wage and 
salary employment towards self-employment. The firm based employment surveys do not account for 
irregular jobs and overestimate the actual job loses, however they show quite accurately the decline in the 
number of traditional, regular jobs. 
Despite the substantial job loses the employment ratio is still relatively high 
The substantial job loses that have occurred during the transition are reflected in the 
lower degree of the utilization of labor resources. The employment ratio – which shows the 
percentage of the population of working age that is employed –is presently much lower than 
before the transition in virtually all transition economies. On average it dropped by close to 20 
percentage points in CEE, around 15 percentage points in Belarus, Russia and Ukraine, and some 
10 percentage points in other CIS (Figure 1). This means that 10 to 20 percent of the working 
age population which would have been employed under the old regime, is currently without 
work. Apparently, this is a large decline in the utilization of labor. However, despite this big 
decline, the employment ratio in most transition economies is still within the OECD range. 
Figure 1 Transition has been associated with a substantial fall in the employment-to-population 
4 
ratio 
Employment/Population Ratio, 2002 
80 
70 
60 
50 
40 
30 
20 
10 
0 
Geo 
Aze 
Kaz 
Cze 
Sl v 
Rus 
Est 
BRU 
Bel 
Lat 
Ukr 
Lit 
OECD 
CIS-7 + K 
CEE 
EU15 
Mol 
Uzb 
Kyr 
Rom 
Hun 
Bul 
Pol 
Sl k 
Cro 
Arm 
Taj 
Alb 
SEE 
Mac 
SAM 
Source: UNICEF TRansMONEE database; OECD Employment Outlook, 2003
The average employment ratio for CEE is presently about 64 percent, virtually the same 
as for the European Union (before the enlargement) and for the OECD. In the CIS it is even 
higher, above the OECD average. This somewhat surprising observation reflects the fact that 
under central planning the employment ratio tended to be at an unusually high level. The 
transition has been thus associated with a movement of employment rates towards a level 
characteristic of market economies. Such process is called a regression toward the mean. In 
many transition economies the current employment rates may be close to the equilibrium rates, 
which implies that there will be no return to the high employment rates prevailing before the 
transition. 
Obviously, there is a substantial variation in employment ratios across countries. On the 
one hand, there are transition economies where the ratio is around 70 percent, which is high by 
international standards. These include the Czech Republic, Estonia, Lithuania in CEE, Belarus 
and Russia, and Azerbaijan and Kazakhstan among the other CIS (Figure 2). 
Figure 2 Employment rates vary among transition economies 
Change in the Employment Rate, 1989-2001 
5 
0 
-2 
-4 
-6 
-8 
-10 
-12 
-14 
-16 
-18 
CEE BRU 0ther CIS 
percentage points 
Source: UNICEF TransMONEE database; Bank staff calculations 
1995-2001 
1989-1995 
On the other end of the spectrum are countries such as Bulgaria, Poland and Slovakia 
among the CEE countries, and Armenia and Tajikistan among the CIS, where the employment 
ratio is significantly below the OECD average. 
High employment rates in slowly restructuring countries may not be sustainable 
High employment rates may imply a successful transition (Estonia is probably a good 
example), but may also imply slow and delayed restructuring. In the latter case many existing 
jobs are of low productivity and probably are not viable in the longer-run. The symptoms 
indicating the existence of low-productivity and non-viable jobs include high prevalence of wage
arrears, forced unpaid leave, short working hours. These jobs can exist only as long as 
enterprises are not subject to competition and receive direct or indirect subsidies (e.g. tax arrears, 
non-payment of utility bills). Such non-viable jobs still exist largely in the CIS countries, 
including Belarus, Moldova, Russia and Ukraine, where enterprise restructuring has proceeded at 
a slower pace (See Box 2) 
Box 2 High employment but many of the jobs are of low productivity and unviable 
Moldova is an example of a country with a relatively high employment and a low unemployment 
rates where a large proportion of jobs is of low productivity and thus probably unsustainable. As much as 
20 percent of privatized firms reported overstaffing in 2001. Moreover, one of every 10 workers was on a 
forced unpaid leave and the average duration of such leave was three months. Many Moldovan firms 
close for a part of the year. As a result of the low level of activity in poorly performing firms the actual 
hours of work are very low. An average workers in Moldova works only 28 hours per week, while his 
Polish, say, counterpart works 42 hours. Similar problems, although to a lesser and decreasing degree 
occur in Russia (World Bank, 2003). 
Source: Rutkowski (2004) 
Emergence of unemployment and decline in labor force participation 
The dramatic decrease in the number of available jobs caused by the shocks associated 
with economic transition, especially at its early stage, gave rise to unemployment and the fall in 
labor force participation. The unemployed are, by definition, those workers who lack jobs and 
are actively looking for new ones. Persons out of the labor force (economically inactive) 
comprise of two categories. First, the discouraged workers, that is able bodied people of 
working age who would like to work, but who gave up job search as their efforts proved futile 
and they ceased to believe that they can find a job. Second, persons who for various reasons are 
not interested in having a job, for example students enrolled in full time education, homemakers, 
persons with disability, or older persons. The dynamics of unemployment and the labor force 
hinges on labor market conditions. Unemployment tends to increase as labor market conditions 
deteriorate. However, it may temporarily increase in response to the increase in the availability 
of job opportunities as workers who had been inactive enter the labor market and start looking 
for jobs. Labor force participation as a rule falls when labor market conditions worsen. Some 
workers become discouraged, and cease looking for jobs (thus, rather than being classified as 
unemployed they are classified as inactive). Younger people may chose to stay longer in 
education to delay the entering the labor market. Some workers may take advantage of benefits 
offered by the welfare state: social assistance, disability pensions, or early retirement. Older 
workers chose retirement and do not try to supplement their pensions with income from work. 
In the transition economies all these effects have occurred in response to the fall in 
aggregate and, consequently labor, demand. Labor force participation rates fell and 
unemployment rose across the board. However, in various countries these effects have occurred 
in different proportions. In some countries the loss of jobs has translated largely into an increase 
in unemployment. In others, it has mainly led to a fall in labor force participation rates. Thus, 
labor force patterns differ across ECA countries (Table 1). For example, in the late 1990s the 
employment ratio – and thus roughly the number of available jobs – in Hungary and Poland was 
virtually the same. However, unemployment in Poland was high (well over 15 percent), while in 
Hungary it was relatively low (below 10 percent). Thus, Hungary and Poland exhibited different 
6
pattern of adjustment to the fall in demand and job losses: in Hungary the reaction was mainly 
labor force withdrawal, whereas in Poland it was mainly active search for new jobs. These 
differential responses can be accounted for by differences in labor market institutions (e.g. 
benefit systems). 
Table 1 Employment, unemployment and labor force participation, 2001 
7 
Employment 
Rate 
Unemployment 
rate 
Labor force 
participation 
rate 
CEE 59.3 11.0 67.1 
Bulgaria 50.6 18.1 61.9 
Czech Republic 65.5 7.3 70.7 
Estonia 62.0 9.1 69.3 
Hungary 56.6 5.6 60.1 
Latvia 60.4 12.8 68.8 
Lithuania 59.9 13.1 69.6 
Poland 51.5 19.9 64.6 
Romania 57.6 7.0 63.4 
Slovakia 56.8 18.6 69.9 
Slovenia 63.4 6.0 67.8 
SEE 45.7 19.1 56.8 
Bosnia and Herzegovina 40.1 16.4 48.0 
Croatia 53.7 14.4 62.9 
Macedonia, FYR 40.4 31.9 59.8 
Serbia and Montenegro b) 48.5 13.8 56.3 
BRU 67.9 9.6 72.6 
Belarus - - - 
Russia a) 75.8 8.0 82.5 
Ukraine 60.0 11.1 62.7 
Other CIS 56.9 11.0 63.7 
Armenia - - - 
Azerbaijan - - - 
Georgia b) 56.8 12.3 65 
Kazakhstan c) 63.6 9.3 70.1 
Kyrgyzstan - 12.5 - 
Moldova d) 50.4 9.8 56.0 
Tajikistan - - - 
Uzbekistan - - - 
Memorandum 
OECD 65.1 6.9 69.9 
EU15 64.3 7.7 69.7 
- Data not available 
Note: Labor Force Survey data 
Definitions: 
Working-age population: 15-64 
Labor force = employed plus unemployed (aged 15+) 
Labor force participation rate = labor force 15-64 as a percentage of working age population 
Employment rate = employed 15-64 as a percentage of working age population 
Unemployment rate = unemployed as a percentage of the labor force
a) Working age population: 20-59 
b) Working age populations: 15+ 
c) Working age population: 15-74 
d) 1st quarter of 2003 
Source: 
CEE countries and EU: Eurostat (Employment in Europe 2003) 
Bosnia and Herzegovina: World Bank (2002b) 
Croatia: Central Bureau of Statistics, Labour Force Survey 2002 (second half), Bank staff calculations. 
Serbia and Montenegro: Republic of Serbia, Republican Statistical Office, Labor Force Survey 2002 (October), Bank staff 
calculations 
Georgia, Kazakhstan and Kyrgyzstan: ILO LABORSTA Labour Statistics Database; Bank staff calculations. 
Russia: Goskomstat; Bank staff calculations. 
Moldova: Department of Statistics and Sociology of the Republic of Moldova; Bank staff calculations 
Different labor force responses to the accelerated job destruction occurring in the wake of 
economic restructuring have given rise to different labor market patterns, which are summarized 
in Table 2. 
Table 2 Patterns of labor force adjustments 
8 
Unemployment 
Labor force participation 
High Low 
High 
Limited job opportunities. But 
workers look for jobs. 
Georgia, Lithuania (late 
1990s), Poland (late 1990s), 
Serbia, Slovakia, Ukraine 
High employment. But are the 
jobs sustainable? 
Czech R., Estonia, Lithuania 
(2000s), Moldova, Romania, 
Russia, Slovenia 
Low 
Scarcity of jobs. Some workers 
get discouraged while others 
continue searching for jobs. 
Bulgaria, BiH, Croatia, Latvia, 
Macedonia, Poland (early 
2000s) 
Limited job opportunities. 
Most workers cease looking 
for jobs. 
Hungary 
The four basic patterns of adjustment are as follows. 
High employment. The category combining high labor force participation rate and low 
unemployment rate implies a high employment-to-population ration, and thus is apparently the 
most desirable one. However, it comprises two distinctly different sub categories: countries such 
as Estonia or Slovenia, where high employment is a consequence of successful transition, and 
countries, such as Moldova or Romania, where high employment is associated with slow 
restructuring and a high share of low productivity jobs (e.g. in subsistence agriculture, or in non-profitable 
enterprises). To some extent, the delayed restructuring can be tracked back to the 
nature of the privatization process in this countries (mass privatization schemes with dispersed 
ownership structures and thus weaker governance). 
Limited job opportunities: in search of jobs. This category comprises countries such as 
Georgia or Slovakia, where labor force participation rates are high, but so is unemployment. 
This combination suggests that unemployed workers still see employment opportunities and thus 
actively search for jobs. Relatively few workers are discouraged and gave up job search. As a
result, employment level is still relatively high. In a way, this labor market state is a transient 
one. It can evolve into a depressed labor market, as it has happened in Poland in early 2000s, or 
into vibrant labor market as it has happened in Lithuania at around the same time. 
Limited job opportunities: discouragement. Hungary is an example of a country where in 
the face of limited job opportunities a large fraction of jobless workers withdraws from the labor 
force. Unemployment is thus low, but so is the labor force participation rate (which may be 
possible thanks to the availability of non-employment benefits). As a result, low unemployment 
coincides with relatively low employment. The employment effect is similar to that in countries 
where both the labor force participation and unemployment are higher (the previous group). 
Scarcity of jobs: unemployment and discouragement. This combination of high 
unemployment and low labor force participation rates, prevailing in countries such as Bulgaria 
and Croatia, signifies a depressed labor market, with the resulting low employment level. High 
unemployment in this case is likely to reflect the fact that many jobless workers (e.g. primary 
earners, the poor) cannot afford to be out of the labor force and are compelled to actively search 
for work. 
To sum up, labor force adjustment has taken various forms during economic transition. 
In some countries, changes in labor demand led mainly to changes in unemployment, in others 
mainly to changes in labor force participation. Moreover, labor market adjustment during the 
transition has been a dynamic process, with changes in labor market conditions inducing 
movements between unemployment and economic inactivity (Boeri, 1995). 
Disproportionately low male employment rates 
The male employment rate is significantly higher than the female employment rate in all 
transition economies.2 This is due to the difference in the labor force participation rate, which is 
much lower for women, rather than the unemployment rate which tends to be similar for men 
and women (Figure 3). 
Figure 3 Labor force indicators by gender, 2002 
A. Employment/populaion Ratio, 2002 
9 
80 
70 
60 
50 
40 
30 
20 
10 
0 
CEE EU15 
percent 
Men 
Women 
2 This statement is based on data for CEE countries and Russia. However, it is highly unlikely that the common 
pattern of higher male than female employment rate does not apply to other ECA countries.
B. Labor Force Participation Rate, 2002 
10 
90 
80 
70 
60 
50 
40 
30 
20 
10 
0 
CEE EU15 
percent 
Men 
Women 
C. Unemployment rate by gender, 2002 
90 
80 
70 
60 
50 
40 
30 
20 
10 
0 
CEE EU15 
percent 
Men 
Women 
This is not surprising, however, as the female labor force participation rate, and 
correspondingly the employment rate, is lower than that of men in virtually all societies, and the 
transition economies are no exception to this regularity. For example in the EU15, the gap 
between the male and female labor force participation rate is 17 percentage points, compared 
with 12 percentage points in CEE. So, the gap between the male and female labor force 
participation rate is significantly smaller in CEE countries than in the EU15. Given that the 
female labor force participation rate in CEE is the same as in the EU15 (on average 61 percent), 
and the employment rates are pretty similar, there is no sign of the underutilization of female 
labor in CEE. The picture is different, however, in the low-income CIS countries, where female 
labor force participation rate has been traditionally lower. 
Where CEE countries differ from the EU15 countries is not female but male employment. 
It is male labor resources that are underutilized. In CEE both the male labor force participation 
rate and the employment rate are much lower than in EU15, which is in stark contrast with the 
female rates. To illustrate, there is a 6 percentage points gap in the male labor force participation 
rate between the EU15 and CEE (no such gap in the case of the female labor force participation 
rate). Given that male unemployment is much higher in CEE than in EU, this translates into an 
even bigger difference in the male employment rate: 64 percent in CEE compared with 73
percent in EU15. Thus, if one uses the EU15 as a benchmark, men are underemployed in CEE, 
while women are not. 
What explains these particularly low male employment rates? On possible explanations 
is that the restructuring process has been biased against manual, less skilled labor and this has 
put men at disadvantage. The industries that have been declining, especially the heavy industry, 
were employing predominantly male labor. In contrast, the expanding service sector relies to a 
much greater extent on female labor. Moreover, the restructuring is associated with the increase 
in the relative demand for higher, mainly non-manual, skills which benefits women more, as in 
many transition economies women tend to be better educated than men. In other words, there is 
indication that during the transition the demand for male labor, which tends to be manual and 
less skilled – has been hurt more than that for the female labor, which tends to be non-manual 
and more skilled. 
In addition, one should bear in mind that the female labor force participation rates were 
very high by international standards in most socialist countries, and accordingly the gender gap 
in labor force participation was relatively small. The transition shock lowered both male and 
female employment rates, but while it has brought female employment rates to the EU level, it 
brought the male rates well below the EU level. This and other aspects of the gender labor 
market differences in transition economies are explored in more detail in Paci (2002). 
The changing nature of employment 
In socialist economies workers were used to having regular, full time wage and salary 
employment. Jobs were secure (permanent employment contracts were the norm; dismissals 
were possible only for major misdemeanor, and thus very rare) and employment was providing a 
range of fringe benefits. This has changed dramatically during the course of transition. Job 
security was largely lost as attested by high job separation rates prevailing in most transition 
economies. In addition, employers have increasingly turned to fixed-term or temporary 
employment contracts to facilitate workforce adjustment. Benefits were cut-off as subsidies 
were removed and enterprises had to become competitive in order to stay in business. The 
proportion of regular secure jobs has gone down, while that of casual, precarious jobs has gone 
up. This changing nature of job has been associated with the growth of the informal sector, 
which by definition provides less protected jobs with fewer benefits. On top of this, many 
workers who lost (or were not able to find) wage and salary employment turned into self-employment, 
which largely is a coping strategy as opposed to a means of securing higher 
earnings (Verme, 2004). Informality and self-employment are often associated with agricultural 
activities, especially in countries with a high share of agriculture in employment (the CIS, 
Poland, Romania, FYR Macedonia). Agriculture tended to act as a shock-absorber for some 
workers released from manufacturing, however underemployment in agriculture is substantial, 
and accordingly productivity is low. Subsistence farming is common. 
These trends are difficult to document with hard data. We will focus here on three 
aspects of the changing nature of employment in ECA: informal sector employment, self-employment, 
and irregular jobs. In the next section we will show the evolution of the industrial 
structure, including changes in the size of the agricultural sector. 
11
12 
Large informal sector 
The size of the informal sector (measured by its share in total employment) varies visibly 
across sub-regions within ECA, as well as across countries.3 Still, the informal sector is an 
important source of jobs in all sub-regions and in virtually all countries (Figure 4). For 
comparison, its role in ECA is much greater than in OECD countries. In CEE, for example, the 
informal sector contributes to GDP nearly twice as much as in OECD countries (respectively 29 
and 17 percent on average in 2000). 
Figure 4 Informal sector employment plays an important part in all transition economies, 
but especially in less developed ones 
Employment in the Informal Sector, 1998/1999 
60 
50 
40 
30 
20 
10 
0 
Azerbaijan 
Kazahstan 
_BRU 
Belarus 
Russian Fed. 
Ukraine 
_CIS-7 + K 
Macedonia, FYR 
Moldova, Rep. of 
Armenia 
Kyrgyz Republic 
_SEE 
Bulgaria 
Estonia 
Georgia 
Uzbekistan 
_CEE 
Slovenia 
Latvia 
Croatia 
Romania 
Hungary 
Slovakia 
Czech Republic 
Poland 
Lithuania 
percent 
Source: Schneidr (2002), Scheider and Klingmair (2004) 
The size of the informal sector seems to be smaller – although not negligible – in the 
more advanced CEE countries, and is particularly large in low-income economies of the CIS. In 
CEE one in five to one in four workers work in the informal sector. In Southeastern Europe 
(SEE) the proportion goes up to one in three. In the CIS every third to every second worker has 
an informal sector job. 
The cross country variation is substantial. On the one end of the spectrum are the Czech 
Republic and Slovakia, where the informal sector accounts for around 15 percent of 
employment, which is close to the OECD average. The percentage is about twice as high in 
Bulgaria, Estonia and Latvia and reaches 40 percent in Belarus, Russia and Ukraine. At the 
3 The commonly used definition of the informal sector is: “all currently unregistered economic activities which 
contribute to the officially calculated (or observed) Gross National Product” (Schneider, 2002). Specifically, the 
“shadow labor market includes all cases, where the employees or the employers, or both occupy a “shadow 
economy” position (ibidem). Unfortunately, Schneider (2002) does not provide details on how the estimates of the 
“shadow economy labor force” (presented below) were obtained.
other end of the spectrum are Azerbaijan and Kazakhstan, where the informal sector accounts for 
half of the economy. 
There are important differences in informal sector characteristics between the European 
and the CIS transition economies. Apart from the differences in size, there are also differences 
in the underlying causes and functions of the informal sector activity (see Box 3). 
Box 3 The meaning of informality: European vs. CIS transition economies 
The informal sector has grown across all transition economies. However, the key characteristics 
of the sector differ between the European and the CIS transition economies at least in three main respects. 
First, the size of the informal sector in European economies is smaller than in CIS economies. Second, in 
the European transition economies workers and firms move to the informal sector mainly to evade high 
taxes and avoid strict regulations. In contrast, in the CIS economies the informal sector is largely an 
employer of last resort providing subsistence income. Small firms prefer to stay in the informal sector to 
avoid corruption and extortion. Third, in the European transition economies informal sector activity is 
often a preferred alternative to work in the formals sector, or complements work in the formal sector (e.g. 
moonlighting). In the CIS economies, in contrast, informal sector activity is usually a necessity reflecting 
lack of employment opportunities in the formal sector and is a primary source of income. In addition, the 
characteristics of informal sector employment differ between both groups of countries. For example, in 
the CIS economies most informal sector jobs are in agriculture while in the European transition 
economies they are frequently located in the services sector, including informal employment in registered 
firms. Table A summarizes these differences. 
Table A Informal sector in European and CIS transition economies. Stylized facts 
Informal sector 
European transition 
characteristics 
economies CIS transition economies 
Size Modest Large 
13 
Causes 
tax avoidance and evasion; 
stringent regulations in 
regulations 
lack of alternative job 
opportunities; 
corruption and extortion in the 
formal sector 
Functions 
preferred alternative to formal 
sector employment; source of 
secondary income 
employer of last resort; 
primary source of subsistence 
income 
Employment status 
self-employment; 
dependent employment in 
unregistered enterprises; 
informal employment in 
registered enterprises; 
self-employment; 
employment in family 
enterprises 
Nature of jobs regular jobs, part-time jobs, 
temporary jobs; second jobs 
agricultural, casual, occasional 
and seasonal jobs 
Obviously, the table presents highly stylized fact and in reality the differences are not so sharp. 
The informal sector in European transition economies shares some features of that in the CIS ones, and 
vice versa. The above characteristics thus highlights the dominant distinctive features while it disregards 
similarities.
The importance of self-employment varies across the region 
Self-employment plays the most important part in the low-income CIS, where on average 
it accounts for 50 percent of total employment. The share of self-employment is much lower in 
the middle-income CIS (17 percent), and in CEE (20 percent). By way of comparison, in EU15 
countries, self-employment accounts for about 15 percent of total employment. 
There is substantial degree of variation in the share of self-employment within regions. It 
is particularly pronounced in CEE (Figure 5). On the one extreme are countries such as Estonia 
and Slovakia, where self-employment plays a minor part, accounting for less than 10 percent of 
total employment. On the other extreme there are countries such as Romania, Lithuania or 
Poland, where self-employment plays a major role, accounting for some 30 to 40 percent of total 
employment. In interpreting these figures one should notice that self-employment is often 
agricultural employment by a different name. That is, in countries where agriculture plays an 
important part self-employment as a share of total employment tends to be high as farmers are as 
a rule counted as the self-employed. This is obviously not to deny, that self-employment plays 
an important part outside agriculture. 
In addition, cross-country and time comparisons may be obscured by the fact that in some 
cases there is little difference between dependent wage employment and self-employment. For 
example in Bulgaria and Poland some health care sector employees were turned into 
independence, self-employed contractors. This obviously inflated the number of the self-employed, 
although there was no corresponding change in the nature of jobs. These 
measurement problems notwithstanding, there is little doubt that self-employment gained in 
prominence in transition economies and often accounts for a considerable fraction of jobs. 
Figure 5 Self-employment plays a critical role in CIS-7 and a negligible one in BRU 
whereas CEE countries are between these two extremes 
Self-employment, 2002 
as percentage of total employment 
_CEE 
Latvia 
14 
80.0 
70.0 
60.0 
50.0 
40.0 
30.0 
20.0 
10.0 
0.0 
Kyrgiz R. 
Azerbaijan 
Georgia 
Armenia 
Moldova 
Romania 
_CIS-7 
Tajikistan 
Lithuania 
Poland 
Uzbekistan 
Slovenia 
Czech R. 
EU15 
Hungary 
_BRU 
Estonia 
Ukraine 
Slovak R. 
Russia 
Belarus 
percent 
Source: Eurostat, CIS-stat (2003)
What are the reasons behind this development? On the one hand people are pushed into 
self-employment by lack of work opportunities. In such a case self-employment is the only 
available means of earning subsistence income. Also sometimes employers force workers into 
self-employment as a means lowering hiring and firing costs, as in the above example of health 
care sector reform in Bulgaria and Poland. In this case self-employment is a forced choice 
reflecting the lack of a gainful alternative. On the other hand people can be pulled into self-employment 
if the expected benefits, mainly earnings, exceed than those of wage employment. 
Self-employment in this case is a voluntary welfare-maximizing choice among different 
alternatives. In such a case self-employment often becomes a springboard for firm creation. 
In reality self-employed workers comprise of both categories: aspiring entrepreneurs and 
subsistence workers for whom unemployment is not a viable alternative (Box 4). However, there 
is some evidence that in ECA the push factors tend to prevail, and the majority of self-employed 
resort to self-employment to avoid unemployment and earn subsistence income (Earle and 
Sakova, 2000; Verme, 2004). The recourse to subsistence agriculture (as it has happened in 
Poland, Romania, FYR Macedonia and in the most of CIS) is the point in case. Thus, the 
evidence does not support the optimistic view that the rise in self-employment reflects the 
development of entrepreneurship and new business opportunities. To a large extent it reflects 
difficult labor market conditions and lack of work opportunities. 
Box 4 Self-employment: a springboard for firm creation, or a coping strategy? 
Is the growth in self-employment observed in transition economies a positive phenomenon? On 
the one hand it is an indication of a developing entrepreneurial spirit, and a springboard to starting a small 
business. Self employment can be a source of an “entrepreneurship premium” and as such offer better 
than normal earning opportunities. 
On the other hand, the growth in self-employment may be a symptom of a depressed labor 
market, where firms create few jobs, and employment opportunities are scarce. It can be associated with 
low value-added activates, which barely provide substance income. So, the assessment depends on the 
distribution of productivity and earnings associated with self-employment jobs (relative to that of 
dependent employment). At the same time, self-employment needs to be assessed against the 
counterfactual, which is either lower earnings or no earnings whatsoever. From such a perspective, self-employment 
is unambiguously a welfare enhancing economic activity. 
For example, in Albania or in Georgia the self-employed account for a large proportion of the 
poor, and thus self-employment is a copying strategy, a means of earning subsistence income. In contrast, 
in more developed countries, such as Estonia or Hungary, the incidence of poverty among the self-employed 
is negligible. In this context self employment is likely to be a gainful entrepreneurial activity 
15 
(World Bank, 2000). 
Rising incidence of irregular jobs? 
The nature of dependent wage employment has been also changing. Before the transition 
employment meant full time permanent labor contract. At present, fixed-term and part-time jobs 
account for a significant part of total formal sector employment in transition economies. On 
average, fixed term jobs share in total employment exceeds 7 percent, and that of part-time jobs 
is another 7 percent (Table 3). In both cases, there is visible cross-country variation. The 
incidence of fixed-term contracts ranges from less than 3 percent in Estonia to over 15 percent in 
Poland. For comparison, the EU15 average is 13 percent. As to part-time jobs, their incidence
ranges from less than 3 percent in Bulgaria to over 10 percent in Latvia, Poland and Romania. It 
is noteworthy, that the incidence of part-time jobs in CEE is substantially below the EU15 
average of 18 percent. 
Table 3 Flexible jobs in CEE are less prevalent than in EU 
16 
Self-employed 
Fixed 
term 
contracts 
Part-time 
employment 
Bulgaria - 5.3 2.5 
Czech R. 16.0 8.1 4.9 
Estonia 8.1 2.7 7.7 
Hungary 13.7 7.3 3.6 
Latvia a) 16.9 6.7 11.3 
Lithuania b) 30.5 6.3 9.7 
Poland 28.1 15.4 10.8 
Romania 40.2 1.0 11.8 
Slovak R. 8.6 4.9 1.9 
Slovenia 16.0 14.2 6.1 
CEE 19.8 7.2 7.0 
EU15 14.6 13.0 18.1 
- Data not available 
a) 2000 
b) 2001 
Source: Eurostat 
Although the incidence of irregular jobs has risen in transition economies, it is still low in 
the comparative perspective. However, one should bear in mind, that the comparison is limited 
to the formal sector, while the majority of casual and temporary jobs are in the informal sector. 
Given that the size of the informal sector is much larger in transition economies than in the EU, 
the actual incidence of irregular or casual jobs is likely to be correspondingly higher, too. 
The growing use of fixed-term contracts is a means to lower employment adjustment 
costs if terminating a permanent employment contract is difficult or costly. Thus, their incidence 
can be expected to be higher in countries where firing costs are high, although restrictions on 
their use may hamper this tendency. Croatia and Slovenia, countries where the employment 
protection legislation is particularly stringent are the cases in point. 
To conclude, it is not only the number of jobs but their “quality”, including earnings, that 
matter. The relevant question is not only the standard one “How many jobs”, but also one that is 
often overlooked, which is “What kind of jobs”. There is limited but rather plausible evidence 
that there has been a switch from stable regular jobs towards temporary, casual and precarious 
jobs, partly in the formal sector, but largely in the informal one. 
Inter-sectoral shifts and the changing structure of employment 
Economic transition in ECA by its very nature has been associated with the reallocation 
of labor and jobs across economic sectors. One part of this process has been a shift of resources, 
including labor, from the public to the private sector. Another part – which is the focus of this 
section -- has been the movements of labor across industries. Reallocation of labor across 
industries was meant to redress the misallocation of resources inherited from the previous 
economic regime. Under central planning industry was overdeveloped while the service sector 
was underdeveloped. Thus, one would expect, that transition will lead to the increase in the
relative size of the services sector and a simultaneous decrease in the size of the industry 
(manufacturing) sector. That is what has indeed happened, although the patterns vary across 
sub-regions. In European transition economies the service sector has expanded at the expense of 
the agriculture sector and to somewhat lesser extent at the expense of the manufacturing sector.4 
In Belarus, Russia and Ukraine the services sector has expanded largely at the expense of the 
manufacturing sector, while the fall in the share of the agricultural sector was less pronounced. 
In other CIS the direction of structural change has been different. In contrast to European 
transition economies, the share of agriculture has significantly increased in virtually all low-income 
CIS countries. As elsewhere, the manufacturing sector has diminished, however the 
17 
service sector has hardly expanded. 
Estonia provides perhaps the most dramatic example of the change in the employment 
structure. The market services sector expanded by 14 percentage points from 1990 through 
2002, while agriculture and manufacturing contracted by 14 and 5 percentage points, 
respectively. In Poland changes were less dramatic but more typical of European transition 
economies. Market services as a share of total employment went up by 7 percentage points, 
whereas agriculture dropped by 5 percentage points and manufacturing by 4 percentage points 
(from 1994 through 2002). In Russia de-industrialization was more pronounced, as the share of 
manufacturing decreased by as much as 12 percentage points, however market services expanded 
at a slower pace, their share increasing by mere 2 percentage points (from 1990 through 1999). 
The example of Azerbaijan is quite typical of the low-income CIS. The share of agriculture 
increased by some 4 percentage points (form 1990 through 2002). So, did the share of market 
services, which went up by 5 percentage points. At the same time, the share of manufacturing 
dropped dramatically by 13 percentage points.5 
Transition economies differ substantially as regards the sectoral structure of employment. 
In CEE the economy is dominated in equal measure by manufacturing and market services 
(jointly about 60 percent of all jobs). Public services (health, education, administration, etc.) 
provide additional 25 percent of jobs. The share of agriculture is relatively small (15 percent). 
Outliers in this group are Bulgaria and Romania, where the share of agriculture is well above the 
average for the group. If the group is limited to current EU member transition economies, then 
the share of agriculture is correspondingly lower, and that of manufacturing is higher. 
In Belarus, Russia and Ukraine relatively more jobs are provided by agriculture and 
public services at the cost of significantly smaller market services sector. Belarus, Russia and 
Ukraine apparently move towards similar sectoral employment structure as CEE, however the 
pace of structural changes is slower and thus the economic structure seems “less advanced”. 
In the other CIS countries the employment structure looks dramatically different. It is 
heavily dominated by agriculture, which accounts for close to half of total employment. The 
manufacturing sector tends to be small, providing on average less than 15 percent of all jobs. 
The market services sector is also substantially smaller than in other ECA sub-regions, 
accounting for less than 20 percent of all jobs. Only the share of public services (which is the 
least varying component of the employment structure) is comparable to that in other ECA 
transition economies. 
4 This does not necessarily imply that labor has moved directly from agriculture to services. An alternative 
scenario is also possible that agricultural labor moved to manufacturing and manufacturing labor moved to services. 
Data which would allow one to discriminate between those two scenarios is absent. 
5 These figures come from an employer based survey, and thus probably underestimate the growth in the 
employment share of the services and agriculture sectors.
Changes in employment structure are important in at least two ways. First, they tend to 
have far reaching labor market ramifications. Reallocation of labor across industries and sectors 
entails also reallocation across occupations and regions and as such is likely to give rise to 
structural mismatches. Jobs that are created in expanding industries usually require different 
skills and are located in different regions than jobs that are destroyed in declining industries. 
Particularly, the shift from industry to market services has been associated with a shift from blue-collar 
jobs to white-collar jobs requiring different skills. This imposes transition costs (in terms 
of time and effort) on workers who move from old to new jobs. Moreover, massive job and 
worker reallocation contributes to frictional and structural unemployment (when the skill and 
vocational structure of job openings differs from that of the unemployment). Accordingly it 
partially accounts for he high unemployment rates associated with the economic transition. 
Second, the employment structure is an indicator of the level of economic development 
as well as the progress of the transition. In the particular case of transition economies, the share 
of market services, which was abnormally small before the transition, is a measure of successful 
labor reallocation. Figure 6 provides a ranking of ECA countries on this scale, indicating the 
progress of the transition toward a mature market economy. 
Figure 6 Market services account for a much larger share of employment in European 
transition economies than in the CIS. 
Market Services as a Percentage of Total Employment, 2002 
18 
40.0 
35.0 
30.0 
25.0 
20.0 
15.0 
10.0 
5.0 
0.0 
Croatia 
Czech R. 
Estonia 
Hungary 
Latvia 
Slovenia 
Slovakia 
Bulgaria 
Lithuania 
Kazahstan 
_CEE 
Poland 
Russia 
Ukraine 
Azerbaijan 
_BRU 
Georgia 
_CIS-7 + K 
Moldova 
Romania 
Belarus 
Kyrgyzstan 
Uzbekistan 
Tajikistan 
percent 
Source: ILO LABORSTA database (LFS data) 
The employment share of market services is the highest in fast reforming and most 
advanced transition economies, such as Estonia, Hungary, and the Czech Republic (above 30 
percent), and is the lowest in slow reforming and less advanced economies, such as Belarus and 
most of the low-income CIS countries (below 20 percent).
II. KEY FEATURES OF UNEMPLOYMENT IN TRANSITION ECONOMIES 
The unemployment rate is customarily used as a key indicator of labor market conditions. 
There are important reasons for this. First, the unemployment rate is an indicator of the overall 
health of the economy. High and persistent unemployment usually points to unresolved 
structural problems. Second, unemployment is very costly from both the individual and the 
social perspective. Job loss is associated with the loss of income, and often leads to poverty. 
Prolonged unemployment leads to the erosion of skills and morale, and often to social 
marginalization. To help the unemployed cope with joblessness the state provides income 
support and services intended to place the unemployment back to jobs. Such programs are costly 
and increase the burden of taxation. Finally, high unemployment can be costly politically, as in 
voters’ opinion the government is responsible for ensuring job opportunities and good 
employment prospects. Thus high and rising unemployment poses a significant political risk for 
the ruling parties. 
Open unemployment in European transition economies and hidden unemployment in the 
CIS 
The transition shock has led to underutilization of labor in virtually all transition 
economies. But the underutilization of labor has taken different forms depending on the speed of 
market oriented reforms. Rapid enterprise restructuring has led to the growth in open 
unemployment. In contrast, the gradual approach to restructuring resulted in hidden 
unemployment (underemployment or low-productivity employment). 
In Central and Eastern Europe unemployment was virtually nonexistent under central 
planning, but has risen sharply already at the early stage of the transition. This was an 
unavoidable and expected process, since some degree of unemployment (the so called “natural” 
unemployment rate) is characteristic of a market economy. Frictional unemployment is a natural 
product of workers moving across jobs in search of better worker-job matches and associated 
higher earnings. However, the rise in unemployment at the early stage of the transition had 
additional sources. First, the substantial drop in output translated into lower labor demand and 
gave rise to demand deficiency unemployment. Second, as mentioned earlier, massive labor and 
job reallocation associated with economic restructuring engendered structural mismatches which 
contributed to structural unemployment. Finally, enterprises which become subject to 
competitive pressure had to cut cost in order to remain profitable. Accordingly, they started to 
shed redundant labor and eliminate overstaffing typical of state owned firms. 
These factors caused unemployment in most CEE economies to peak 4-5 years after the 
beginning of market oriented reforms. The CEE average unemployment rate reached about 12 
percent in the peak period 1994-95 and started do go down since then until 1998 when it reached 
the through of 10 percent (Figure 7). In 1999 unemployment in the region rose again in response 
to the Russian crisis and global financial turmoil, and the second peak occurred in 2001. While 
the initial increase in unemployment was caused by factors specific to the transition, the increase 
in the wake of the Russian crisis was mainly of cyclical nature. 
In Southeastern Europe (which is largely former Yugoslavia) unemployment existed even 
before the transition. In this case the transition shock (as well as the regional war) led to an 
increase in the unemployment rate to levels still higher than those in CEE. For example in FYR 
Macedonia the unemployment rate is about 30 percent and in Croatia it is close to 20 percent. 
The unemployment rate has also been gradually rising in Serbia and Montenegro, which have 
started the market oriented reforms later than other countries in the region. 
19
Figure 7 Unemployment fluctuates with changes in business conditions, but remains high 
in CEE countries 
Unemployment Rate, 1992-2002 
20 
CEE 
25.0 
20.0 
15.0 
10.0 
5.0 
0.0 
1992 1993 1994 1995 1996 1997 1998 1999 2000 2001 2002 
percent 
Source: ILO LABORSTA database (LFS data) 
Czech R. 
Bulgaria 
Estonia 
Hungary 
Latvia 
Lithuania 
Poland 
Romania 
Slovakia 
Slovenia 
In Russia and Ukraine the evolution of unemployment has been somewhat different from 
that in CEE. Unemployment reached its peak later, only in 1998 (i.e. four years later than in 
CEE). This is likely to reflect delayed restructuring and initially heavier reliance on wage 
adjustment (as opposed to employment adjustment) in response to the negative output shock. 
Since 1999 unemployment in both Russia and Ukraine has begun to decline. Again, it is too 
early to tell whether or not this decline represents a transitory movement, or a movement toward 
the equilibrium unemployment rate. Unemployment in Russia and Ukraine coincides with 
significant underemployment among workers in unrestructured firms or workers employed in the 
large informal sector. This is a still bigger problem in other CIS countries. 
In the low-income CIS countries unemployment has also increased, but the problem is 
not so much open unemployment as underemployment. It takes the form of employment in 
subsistence agriculture, irregular or casual employment in the informal sector (e.g. petty trade), 
or employment in unprofitable and unviable enterprises, which often are not even able to pay 
wages. Underemployment is closely associated with low productivity and thus translates into 
lower output and social welfare, similarly as does unemployment. In a way, underemployment is 
a mirror image of unemployment in societies where people cannot afford to be unemployed, 
because there is no effective social safety net in place.
Unemployment rates vary strongly across the region but are generally high 
The unemployment rates are on average higher in European transition economies than in 
the CIS. In the CIS the LFS/ILO unemployment rate hovers around 10 percent showing 
relatively little cross-country variation. In contrast, in CEE the average unemployment rate was 
12 percent in 2002, with visible intra-regional variation. The average unemployment rate in SEE 
is still higher (20 percent if FYR Macedonia is included, 14 percent if it is not.). 
Overall, unemployment in transition economies is relatively high, significantly above the 
average of the OECD ( about 7 percents). In low unemployment CEE countries the 
unemployment rate is still significantly higher than in low unemployment EU15 economies. For 
example, the unemployment rate in the Czech Republic (7.3 percent in 2002) is significantly 
above that in Denmark and Ireland or the U.K. (about 5 percent). This discrepancy between the 
level of unemployment in transition economies, which still undergo industrial restructuring and 
are more exposed to shocks, and market economies with flexible labor markets is obviously not 
surprising. The point is that currently unemployment in transition economies is probably above 
its long-run equilibrium level, provided that the OECD is an adequate benchmark. 
Despite the apparently similar initial conditions and similar experience of the transition, 
the unemployment rates vary strongly across transition economies. For example in Poland the 
unemployment rate was over 3 times higher than in Hungary (20 percent against 6 percent in 
2002). In Slovakia the unemployment rate is 2.5 times as high as in the Czech Republic (19 
percent against 7 percent). Even stronger differentiation of labor market conditions exists among 
countries of former Yugoslavia. The unemployment rate in FYR Macedonia is over 5 times as 
high as in Slovenia, and in Croatia the rate is 2.5 times as high as in Slovenia. Figure 8 
illustrates this huge dispersion in unemployment rates in ECA. 
Figure 8 Unemployment rates vary strongly across transition economies 
Unemployment rate, 2002 
21 
35 
30 
25 
20 
percent 
15 
10 
5 
0 
Macedonia, FYR 
_SEE 
Poland 
Bulgaria 
Slovakia 
BIH 
Croatia 
Lithuania 
Serbia and Montenegro 
Georgia 
Latvia 
_CEE 
Estonia 
Russia 
Romania 
Ukraine 
_EU15 
Czech Republic 
Slovenia 
_OECD 
Moldova 
Hungary 
Source: ILO LABORSTA database (LFS data)
Inflows into unemployment are high while outflows are limited 
The level of unemployment depends on the probability of becoming unemployed, and on 
the expected duration of the unemployment spell. The latter in turn depends on the probability 
of escaping unemployment. Accordingly, the level and the durational structure of 
unemployment vary depending on the relationship between the inflow rate and the expected 
duration of unemployment (probability of escaping unemployment). In a simple way this 
relationship is depicted in Table 4. 
Table 4 Labor flows and unemployment 
Outflows from unemployment 
• unemployment to jobs 
• unemployment to inactivity 
22 
Inflows into unemployment 
• employment to unemployment 
• inactivity to unemployment 
High: dynamic labor 
market 
Low: stagnant labor 
market 
High moderate unemployment high unemployment 
Low 
Low unemployment moderate unemployment 
Unemployment can have different durational structure. For example, in a dynamic labor 
market the risk of losing a job may be high, but so is are the chances of finding a new one. 
Accordingly the expected duration of unemployment will be short, which will result in a 
“moderate” unemployment rate (or low unemployment rate if inflows into unemployment are 
low). 
An opposite example is that of a stagnant labor market. In such a market the risk of 
losing a job may be low, but the prospects of finding a new one are poor. The expected duration 
of unemployment spells will be long and level unemployment will be elevated despite low 
inflows into joblessness. If inflows into joblessness increase (e.g. due to economic downturn, 
restructuring, or demographical pressures), unemployment will reach a high level. 
A typical example of a flexible, dynamic labor market is the U.S. Indeed, 66 percent of 
the unemployed find a job within a year (Boeri and Terrel, 2002). The median duration of 
unemployment fluctuates around 10 weeks and correspondingly the incidence of long term 
unemployment is very low (less than 10 percent). 
Labor markets in transition economies are in sharp contrast to the dynamic labor market, 
such as the US.6 Expectedly, flows from employment to unemployment are higher, as transition 
economies undergo rapid restructuring, which be its very nature is associated with a high rate of 
job destruction. For example, the flows from employment to jobs in Poland or Russia in the mid 
1990 were roughly twice those in the US. However, the outflow rate from unemployment to jobs 
is also much lower in the transition economies than in the U.S., showing that the rate of job 
creation is too low to absorb the accumulated unemployment pool. The chance that a worker 
finds a job within a year after entering unemployment is in virtually all transition economies 
substantially smaller that in the US. Roughly speaking, the probability that an unemployed 
persons find a job is in transition economies half that in the US. Thus, all else being equal, if the 
outflow rate from unemployment to jobs in Poland, say, were the same as in the US then the 
6 Data on labor flows is available for CEE countries and Russia but not for other CIS countries.
Polish unemployment rate would be by about one-fourth lower.7 Some examples of the 
differences in flows into and out of unemployment are shown in Table 5. 
Table 5. Jobless workers in transition economies face low chances of escaping 
unemployment 
23 
Country Year 
Employment 
to 
Unemployme 
nt 
Employment 
to Out of the 
Labor Force 
Unemployme 
nt to 
Employment 
Unemployment 
to Out of the 
Labor Force 
Out of the 
Labor Force 
to 
Employment 
Out of the 
Labor Force 
to 
Unemployme 
nt 
Central and Eastern European Countries 
Bulgaria 1994-1995 0.059 0.092 0.323 0.244 0.092 0.044 
Czech. R 1994-1995 0.013 0.028 0.496 0.129 0.042 0.012 
Czech. R 1996-1997 0.08 0.025 0.457 0.101 0.04 0.008 
Czech. R 1998-1999 0.018 0.025 0.335 0.09 0.036 0.017 
Poland 1992-1993 0.04 0.076 0.361 0.158 0.095 0.045 
Poland 1993-1994 0.04 0.063 0.354 0.159 0.074 0.043 
Slovakia 1994-1995 0.023 0.045 0.237 0.078 0.018 0.017 
Former Soviet Union 
Estonia 1992 0.048 0.097 0.465 0.093 0.143 0.036 
Estonia 1997 0.047 0.04 0.372 0.064 0.074 0.038 
Russia 1992-1993 0.032 0.058 0.52 0.157 0.087 0.014 
Russia 1995-1996 0.056 0.062 0.395 0.145 0.076 0.034 
United 
States 1992-1993 0.028 0.053 0.659 0.288 0.043 0.161 
Source: Boeri and Terrel (2002) 
Data in Table 5 suggest that initially high unemployment in transition economies was the 
product of relatively high inflows into unemployment and limited outflows to jobs. Most of the 
economies were thus in the high unemployment/depressed (stagnant) labor market state. 
As the restructuring process slowed down with the progress of the transition, the initially 
high inflow rates gradually declined, although they still remain higher than in a mature market 
economy, such as the US. This entailed a movement toward the moderate 
unemployment/stagnant labor market state, as the job finding chances hardly improved and thus 
the duration of unemployment remained high. At this stage unemployment is a stagnant pool: 
few workers enter unemployment but also few are able to exit it. 
Recent examples of a substantial fall in unemployment in some CEE countries (e.g. 
Lithuania) suggest that these successful countries might have begun a movement toward 
moderate unemployment/dynamic labor market and eventually. It is obviously an open question 
if the movement will continue toward the low unemployment/dynamic labor market state. 
7 Outflows from unemployment to jobs account for about two-thirds of all outflows from unemployment (the other 
being to inactivity), so doubling the outflows to jobs rate (holding the outflows to inactivity rate constant) results in 
shortening of the average duration of unemployment and thus lowering the unemployment rate by one-fourth.
24 
Long duration of unemployment 
Poor employment opportunities along with skill and location mismatches lead to long 
duration of unemployment, which is the mirror image of low exit rates from unemployment, 
which prevail in transition economies. As a result, transition economies have seen the growth in 
the incidence of long-term unemployment. Presently the long term unemployment in CEE 
accounts for over 50 percent of total unemployment, which is much more than in EU, where it 
accounts for 40 percent. (Figure 9). After all, in the flexible, well performing EU labor markets 
the incidence of long-term unemployment at around 25 percent is still much lower. It is 
noteworthy, that in every EU transition economy the incidence of long-term unemployment is 
higher than the already high EU average. In Latvia, where long term unemployment is the least 
prevalent among European transition countries, it still accounts for 45 of total unemployment. 
Bulgaria is an extreme case, with two-thirds of all the unemployed suffering from long-term 
joblessness. 
Figure 9: Long-term unemployment looms large in all European transition economies 
Long-term unemployment, 2002 
as percentage of total unemployment 
90 
80 
70 
60 
50 
40 
30 
20 
10 
0 
OECD 
EU 
Hungary 
Latvia 
Czech R. 
Poland 
Romania 
Estonia 
Lithuania 
Croatia 
Slovenia 
Bulgaria 
Serbia and Montenegro 
Slovakia 
FYR Macedonia 
percent 
Source: Eurostat, OECD (2003) and national Statistcal Offices; Bank staff calculations. 
The problem of long duration of unemployment is even more severe in the Southeastern 
transition economies, such as Croatia and FYR Macedonia, where stringent employment 
protection legislation has for long discouraged employers from hiring. This has led to the 
accumulation of a large pool of workers who find it extremely difficult to enter or re-enter the 
labor market (World Bank, 2003c; Rutkowski, 2003c). 
To conclude, the high incidence of long-term unemployment in most transition 
economies points to a depressed, stagnant labor markets and possibly to structural mismatches. 
Once unemployed, people have little chances to find new employment. Long duration of
unemployment spells is associated with high individual and social costs. It tends to cause the 
erosion of human capital, and often leads to poverty and social exclusion. Accordingly it is the 
high long-term unemployment rates prevailing in ECA transition economies which are of 
particular policy concern. 
High unemployment among less skilled workers 
Unemployment in the European transition economies is heavily concentrated among less 
educated workers. Generally, the unemployment rate is the higher, the lower is the educational 
level (Table 6). Unemployment rates among workers with primary and lower secondary 
education tend to be extremely high, usually well above 20 percent. They are significantly lower 
– although often still high -- for workers with upper secondary education, on average around 13 
percent. The unemployment rate drops dramatically to 4 percent for workers with university 
education (the CEE average). It is noteworthy that the unemployment rate for university 
educated workers tends to be low even in high unemployment countries, such as Bulgaria (8.5 
percent) or Poland (5.6 percent), suggesting that the fall in labor demand has been biased against 
the less skilled workers. A notable exception is FYR Macedonia, where the unemployment rate 
is very high even among workers with tertiary education (16.6 percent), although still half the 
overall unemployment rate. This exception notwithstanding, university education seems to be 
the best protection against unemployment in the European transition economies. Unfortunately, 
lack of relevant data makes it impossible to ascertain whether or not this result holds also for 
other ECA countries. 
Table 6 Unemployment hits less educated workers particularly strong 
25 
Less than 
upper 
secondary 
Upper 
secondary Tertiary 
CEE 
Bulgaria 33.1 19.4 8.8 
Czech Republic 21.5 7.1 2.5 
Estonia 18.6 13.3 8.0 
Hungary 11.2 5.2 1.2 
Latvia 21.0 13.0 5.5 
Lithuania 23.1 21.7 10.1 
Poland 23.9 19.4 5.6 
Romania 4.0 8.6 3.9 
Slovakia 42.5 18.7 5.2 
Slovenia 8.9 5.5 2.3 
SEE 
Croatia a) 13.7 16.7 7.6 
Macedonia, FYR - - - 
Serbia and Montenegro a) 24.9 19.7 9.5 
- Data not available 
Note: Labor Force Survey 
data 
a) 2002 
Source: 
CEE: Eurostat 
Croatia: Central Bureau of Statistics, Labour Force Survey 2002 (second half), Bank staff calculations. 
Serbia and Montenegro: Republic of Serbia, Republican Statistical Office, Labor Force Survey 2002 (October), 
Bank staff calculations
Although workers with primary education face a high risk of unemployment, they ere not 
numerous in most European transition economies, where most of the labor force has at least 
lower secondary education. Given their high share in the labor force and the relatively high 
unemployment rate among this group, it is workers with secondary education which are 
preponderant among the unemployed. 
Less skilled workers have lower chances to find work, and accordingly face longer 
unemployment spells. As a result, they are disproportionately represented among the long-term 
unemployed. For example, in Poland workers with less than upper secondary education 
accounted for 60 percent of short term unemployment, and 65 percent of long-term 
unemployment (2002 data). 
Disproportionately high unemployment among less skilled workers is a common 
phenomenon in developed countries, and transition economies are no exception in this regard. 
These high unemployment rates are explained by technological change which tends to be biased 
against less skilled manual labor. At the same time, new generations of capital require higher 
skills, which explains demand for well educated workers. A more in depth analysis of the 
changing demand for skills in transition economies is provided in Commander and Kollo (2004). 
High youth unemployment 
An issue of particular concern in transition economies is high youth unemployment. 
Indeed young workers (15-24) face the risk of unemployment much higher than that faced by 
older workers. In most cases the youth unemployment rate is about twice as high as the overall 
unemployment rate (Table 7). However, relatively high youth unemployment rates are typical 
of all developed countries. In EU/OECD countries the ratio of the youth unemployment rate to 
the overall unemployment rate is virtually the same as in transition economies. What 
distinguishes transition economies from OECD economies is high absolute youth unemployment 
rates, rather than high relative rates. 
26
Table 7 Unemployment rates are particularly high among young workers 
27 
Youth unemployment 
as % of labor force 15- 
24 
Youth unemployment 
rate/overall 
unemployment rate 
CEE 
Bulgaria 35.5 2.0 
Czech R. 16.9 2.3 
Estonia 17.7 1.9 
Hungary 11.9 2.1 
Latvia 24.6 1.9 
Lithuania 21.4 1.6 
Poland 41.7 2.1 
Romania 18.5 2.6 
Slovakia 37.3 2.0 
Slovenia 15.3 2.6 
Turkey 17.8 1.6 
SEE 
Croatia 34.5 2.4 
Serbia and Montenegro 
a) 58.0 3.1 
Memorandum 
EU15 14.7 1.9 
OECD Europe 17.6 2.0 
Total OECD 13.1 1.9 
Note: Labor Force Survey data 
a) The unemployed include persons who in the reference period did a temporary job 
Source: 
CEE and EU: Eurostat 
Turkey and OECD: Employment Outlook, OECD 
Croatia: Central Bureau of Statistics, Labour Force Survey 2002 (second half), Bank staff calculations. 
Serbia and Montenegro: Republic of Serbia, Republican Statistical Office, Labor Force Survey 2002 (October), 
Bank staff calculations 
For example, in Poland youth unemployment rate is above 40 percent. In Bulgaria and 
Slovakia it is between 35 and 37 percent. On average, the youth unemployment rate in CEE is 
close to 25 percent. This is almost twice as high as the average youth unemployment rate for the 
OECD countries. Unemployment rates of such magnitude are likely lead to social tension. 
The disproportionately high youth unemployment rates largely reflect higher levels of 
labor turnover among young workers, who tend to change jobs more often than older workers, 
presumably looking for the best worker-job match. However, they may also be associated with 
labor market rigidities and barriers created by stringent employment protection legislation, which 
favors insiders (workers with secure jobs) at the cost of outsiders (the unemployed, contingent 
workers). For example, an extremely high fraction of young labor market entrants among the 
unemployed in FYR Macedonia can be at least partly attributed to high degree of job protection 
granted to incumbent workers (World Bank, 1998). Another possible source of high youth 
unemployment is the minimum wage set at above market clearing level. For example, in 
economically depressed, high unemployment regions of Poland the minimum wage accounted
for over 80 percent of the going wage rate for low skilled workers. Given that many young 
workers lack labor market experience and skills, they are likely to be negatively affected by high 
minimum wages (World Bank, 2001; Kertesi and Kollo, 2003; Rutkowski 2003a,). These 
considerations led the Polish government to introduce a youth sub minimum wage accounting 
for 80 percent of the adult minimum wage in 2002. 
Youth unemployment matters because evidence shows that it is often associated with 
poverty. A priori this is not an obvious result, as it may be the case that young people looking 
for work are predominantly secondary earners in relatively well-to-do families, who just want to 
earn additional income. However, in many transition economies the unemployed youth live in 
poverty. For example, in Macedonia and Bulgaria the incidence of poverty among the 
unemployed youth is significantly higher than the average (World Bank 1999; Rutkowski, 
1999),. In this case the likely reason is that young people in poor families cannot afford to be out 
of the labor force. Low family income forces people to enter the labor market at a relatively 
young age. As long as young people are searching for jobs they are counted as the unemployed, 
and in this sense poverty gives rise to youth unemployment. Obviously, prolonged and 
unsuccessful job search by young family members can also contribute to poverty. Either way, 
youth unemployment has significant negative poverty effects. The issue of youth 
unemployment in SEE is explored in more detail in Kolev and Saget (2003). 
Large and persistent regional disparities in labor market conditions 
There are substantial disparities in labor market conditions in most ECA countries. Most 
regions are economically depressed with high unemployment rates, often coupled with low labor 
force participation rates (in large part due to the “discouraged worker” effect) and, consequently, 
low employment rates. In these regions the job creation and hiring rates are low, severely 
limiting the chances to escape unemployment. At the same time, in a small number of expanding 
regions unemployment is relatively low, the job creation rate is high, and employment 
opportunities are plentiful. Table 8 illustrates a particular dimension of regional labor market 
imbalances: differences in the unemployment and employment rates. 
The dispersion in unemployment rates in the six European transition economies in the 
sample is substantial. The unemployment rate in the highest unemployment region is in most 
cases at least twice as high as in the lowest unemployment region (with Poland being an 
exception).8 For example, in Bulgaria the unemployment rate in north-west region is 32 percent, 
compared with 16 percent in the south-western region (see Annex Table A1). The differentials 
increase with the level of regional dis-aggregation, i.e. when the analysis concerns a larger 
number of smaller regions. Particularly, if the capital region is shown separately then the 
disparity between the highest and the lowest unemployment region becomes even more 
pronounced. For example, the unemployment rate in the highest unemployment region of 
Slovakia is almost tree times as high as in the capital region (24.5 percent and 8.5 percent, 
respectively). 
Regional unemployment inequality reflects strong regional concentration of job creation 
and employment growth. Often it is only a few regions which create jobs on a net basis (that is 
where the job creation rates exceeds the job destruction rate) and where the jobless face good 
8 The degree of regional variation of unemployment rates is influenced by the size of the regions (in general, the 
larger are the regional units, the lesser the variation). Thus the variation of unemployment rates is not comparable 
across countries, as regions differ in size. Nevertheless, the comparison gives a rough idea of the regional disparities 
in labor market conditions. 
28
employment prospects. In most regions the rate of job destruction still exceeds that of job 
creation implying net employment loss. If the number of jobs declines, chances to escape 
unemployment are poor. For example, in Bulgaria it is only the capital region, where 
employment expands (Rutkowski, 2003b). In Croatia employment grows only in 4 out of 21 
regions, and in Poland in 3 out 16 regions (Rutkowski 2003c; World Bank 2001). So 
employment creation in regions of high unemployment has not picked up. 
Regional labor market disparities are not specific to transition countries and occur also in 
developed market economies. However two factors are specific to European transition 
economies. First, most transition countries (including Russia) display a degree of variation in 
unemployment rates generally higher than most Western European countries, let alone the USA. 
For example, the coefficient of variation of unemployment for France and the USA is roughly 
half that for the Czech Republic and one third that for Hungary (Boeri and Scarpetta, 1996; 
Bornhorst and Commander, 2004). These large differences in regional unemployment rates are 
associated with strong concentration of net job creation in few relatively economically vibrant 
regions and the dominance of job destruction in most other, economically depressed, regions. 
Second, labor market imbalances tend to be highly persistent in transition economies. 
The ranking of regions by the unemployment rate hardly changes over time. High 
unemployment regions at the early stage of the transition tend to remain relatively high 
unemployment regions today. This points to the weakness of equilibrating mechanisms, such as 
wage adjustment or inter-regional labor mobility to accommodate region specific shocks and 
lower regional imbalances (Boeri and Scarpetta, 1996; Fidrmuc, 2003, Huber, 2003a; Bornhorst 
and Commander, 2004). 
Why are regional unemployment disparities so large in transition economies? There two 
factors at work. First, large region specific shocks to product and consequently labor demand. A 
study of regional unemployment in Poland found that higher unemployment regions are those 
experiencing greater change in industrial structure. Moreover, high unemployment regions are 
those with higher inflow rates to unemployment rather than longer spells of unemployment. 
These findings suggest that regional unemployment varies importantly with job destruction in 
Poland and thus region specific labor demand shocks (Newell, 2000). 
Second, underlying structural factors, which determine regions’ growth potential. These 
structural factors include sectoral and industrial structure, the degree of urbanization, the 
development of the infrastructure, and last but not least, human capital endowment. As regions in 
transition economies differ substantially with respect to their economic structure, these 
differences translate into differences in labor market conditions. Generally, regions which fare 
best in terms of job creation and employment prospects are urbanized (especially those with 
large agglomerations), with a large service sector, with developed infrastructure (both traditional 
and modern, such as telecommunication networks), and with well educated, skilled workforce. 
In contrast, regions which fare worst in terms of labor market conditions are industrial regions 
with obsolete, non-competitive, declining industries (especially heavy industries, such as steel or 
mining). The performance of agricultural regions is mixed. Agriculture is often an employer of 
last resort and thus open unemployment in agricultural regions is relatively low, but 
underemployment is considerable. The issue of factors accounting for regional unemployment 
inequalities and the typology of regions with respect of their labor market performance is 
analyzed in more depth in Huber and Scarpetta (1995), Scarpetta (1995), Rutkowski and 
Przybyla (2002), and Huber (2003b). 
How to improve the employment prospects in high unemployment regions? European 
experience demonstrates that labor mobility and wage flexibility by itself play only a modest role 
29
and are insufficient to visibly lessen regional imbalances. The key to economic growth and thus 
better labor market conditions in depressed regions is investment and the consequent job 
creation. Thus, the challenge facing depressed regions is to attract investment, which requires 
creating incentives for firm entry, developing infrastructure, and investments in human capital to 
improve labor productivity. 
To conclude, there are large regional unemployment disparities in transition economies, 
driven by region specific labor demand shocks as well as by regions’ structural characteristics. 
Particularly, the response to these idiosyncratic shocks depends on structural factors, such as the 
sectoral structure, presence of strong urban centers, the skill composition of the labor force, and 
the development of the infrastructure. Regional unemployment inequalities tend to be persistent, 
pointing to the weakness of equilibrating mechanisms, such as wage adjustments and labor 
mobility. However, they may also reflect regional differences in steady-state unemployment 
levels. To overcome these disparities depressed regions need to be turned into attractive 
locations for private firms to invest and create jobs. This in turn requires public investments in 
infrastructure and human capital. 
III. WAGE DEVELOPMENTS 
Economic transition has been associated with profound changes in the wage level and 
structure (relative wages). Changes in the wage level represented a response to the changing 
level of output and productivity. Changes in the wage structure reflected changes in the wage 
setting mechanism (from bureaucratic and centralized one to a market based and decentralized 
one) as well as changes in the relative demand for and supply of different types of labor. A 
direct consequence the changes in the wage structure has been an increase in wage inequality. In 
the ensuing part of this section we analyze these developments in turn. 
Real wages have been growing in all transition economies since the mid 1990s 
After an initial sharp drop in the early 1990s, real wages in virtually all transition 
economies have been growing at a pretty high rate since the mid 1990s, following gains in labor 
productivity. 9 However, the pattern of wage adjustment has differed considerably across ECA 
sub-regions. Generally, the wage drop has been much deeper in the CIS than in CEE. While in 
the CIS real wages are currently at around 50 percent of their pre-transition level, they close to it 
in CEE (Figure 10). After all in a few CEE countries wages are already higher than before the 
transition. Coupled with the earlier analysis of employment dynamics, these data suggest that 
while in CEE the brunt of adjustment to the transition shock was borne by employment, in the 
CIS it was borne by wages. 
9 In most transition economies real wages are still lower than before the transition, but this result needs to be treated 
with caution. The actual real wages decline was most probably much less then the measured one This is due to the 
fact that the pre-transition level of real wages was overestimated in most of the transition economies. This 
overestimation resulted from prices being set at below-the equilibrium level, as attested by pervasive consumer good 
shortages. If prices were set so as to equate the demand for and the supply of goods, as it is the case in a market 
economy, then real wages before the transition would be correspondingly lower. In other words, real wages before 
the transition were often not quite “real” in terms of consumer purchasing power. If this factor were taken into 
account, the reported wage drop would be much less, although the degree of the correction varies by country. In 
addition, wage data are likely to be affected by wage arrears and non-payment of wages, a problem particularly 
pronounced in CIS (particularly at the early stage of the transition). Finally, a widespread practice of underreporting 
of wages to avoid tax payments also means that the actual wage growth during the transition is likely to be 
underestimated. 
30
Figure 10 Real wages rebounded in the mid-1990s 
Real Wage Growth 
31 
150.0 
100.0 
50.0 
0.0 
-50.0 
-100.0 
EU member TE EU accession TE Russia and Ukraine CIS-7 
percent 
Source: UNICEF TransMONEE database; Bank staff calculations 
1989-1995 
1995-2001 
1989-2001 
Individual country experiences regarding wage dynamics vary strongly across the region 
(Figure 11). Among CEE, wages in the Czech Republic and Poland are almost 20 percent higher 
than before the transition and close to the pre-transition level in Hungary and Slovenia. At the 
same time, in Bulgaria and Lithuania wages much lower than before the transition. 
Figure 11 Real wages are close to the pre-transition level in CEE countries and below it in 
CIS-7. 
Real Wages in 2001 
1989=100 
140 
120 
100 
80 
60 
40 
20 
0 
Croatia 
Czech Republic 
Hungary 
Slovenia 
Poland 
Georgia 
Slovakia 
_CEE 
Romania 
Latvia 
Moldova 
Estonia 
Ukraine 
Russia 
Macedonia, FYR 
_RU 
Kazahstan 
Bulgaria 
Azerbaijan 
Armenia 
Lithuania 
_CIS-7 + K 
Kyrgyzstan 
Uzbekistan 
Tajikistan 
Percent 
Source: UNICEF, TransMONEE database; Bank staff calculations.
In the CIS the variation in wage growth has been much less than in CEE and in most 
cases wages are 40 to 50 percent lower than before the transition. However, in a few countries 
(Kyrgyzstan, Tajikistan, and Uzbekistan) according to official data wages are at only 30 percent 
or even less of their pre-transition level 
Wage drop was strongly concentrated in the early phase of the transition followed by a 
strong wage growth since the mid 1990s 
Wage dynamics in ECA transition economies mirrored that of output and productivity. 
Wages fell sharply during the first half of the 1990s, when output was contracting, and have 
begun to growth since the mid 1990s, when output and productivity started to rise. Figure 10 
shows the dramatic drop in wages during the first phase of the transition, and the strong wage 
growth during the following phase. 
It is worth noting, that the strong wage growth since the mid-1990s has occurred in all 
transition economies, with no exception. Thus, output and productivity growth, which followed 
the initial output collapse, have been translated into higher wages. Given that productivity 
growth has to a large extent been driven by eliminating labor hoardings and shedding of 
redundant labor, there has been a negative correlation between wages and employment growth. 
That is, the growth of wages was associated with the fall in employment. This renders the 
welfare effect of labor market developments during the second phase (associated with output 
recovery) of the transition ambiguous. There have been winners: employed insiders who 
enjoyed higher wages, and the outsiders, suffering from joblessness and income loss. 
Wage inequality has strong increased and reached high levels 
Wage inequality was relatively low in socialist countries, reflecting the egalitarian 
ideology. Wage grids were as a rule determined centrally, and specified the minimum and the 
maximum wage, with the latter being a pre-determined multiple of the latter. In some countries 
(e.g. Hungary, Poland) the system was somewhat more flexible, nonetheless wage distribution 
remained compressed either under the trade union pressure, or to buy social peace and maintain 
the legitimacy of the socialist system. The Gini coefficient, which is a summary measure of 
income inequality, was at a low level of 20-25 in European socialist economies and at somewhat 
higher level of around 25 in the Soviet Union (Atkinson and Micklewright, 1992).10 
Wage distribution has widened considerably during the transition in all ECA countries, 
and wage inequality has reached high levels by international standards. However, there are 
substantial differences across country groups. Wage inequality tends to be higher in 
economically less developed countries. It is by far the largest in the low-income CIS, where the 
Gini coefficient is in the range of 45-50. In middle-income CIS the Gini coefficient ranges from 
about 35 in Belarus to over 40 in Ukraine, to nearly 50 in Russia. These values imply high levels 
of inequality by international standards. Wage disparities in the CIS are comparable to those in 
developing countries. 
In European transition economies wage dispersion is significantly lower than in the CIS, 
but higher than the EU average. The Gini coefficient is in most cases in the range of 30-40, 
which is high by European standards. The Czech Republic stands out as relatively low wage 
inequality transition economy (Gini less than 30), while Romania and Serbia and Montenegro are 
at the other extreme (Gini about 40). 
10 The Gini coefficient ranges from 0, which indicates no inequality to 100, which means that all income is received 
by one person. In practice, the Gini coefficient is ranges from 20 to 50. 
32
Overall, there are quite substantial differences in the degree of wage inequality both 
between country groups and within groups. This variation in wage inequality is depicted in 
Figure 12.11 
Figure 12 Summary of wage distribution, 2002 
Summary of Wage Distribution, 2002 
Ukraine 
Bulgaria 
33 
300 
250 
200 
150 
100 
50 
0 
Azerbaijan 
-50 
-100 
Russia 
Kyrgyzstan 
SAM 
Armenia 
Estonia a) 
Romania 
Hungary a) 
Belarus 
Lithnuania 
Slovenia 
Latvia 
Poland 
Czech R. 
percent 
Source: UNICEF TransMONEE database; Bank staff calculation 
14 
12 
10 
8 
6 
4 
2 
0 
P10 
P90 
Decile Ratio 
a) 2001 
P10 = bottom decile/median 
P90 = top decile/median 
Decile ration = top decile/bottom decile 
In the European transition economies the wage distribution has widened especially at the 
upper tail, meaning the high wages have become more prevalent and also the emergence of very 
high wages, not seen under the previous regime. For example, in Poland before the transition a 
top-paid workers (top decile) was earning 60 percent more than the median worker. At present a 
top paid worker earns twice as much a the median worker. Thus, the earnings status of top paid 
workers has improved quite substantially. 
Changes at the lower tail of the wage distribution were less pronounced in CEE. Sticking 
to the example of Poland, which is quite typical, before the transition a low-paid (bottom decile) 
worker was earning 35 percent less than the median worker. Currently, a low-paid worker earns 
11 The measures of wage inequality shown in Figure 12 are defined as follows. The decile ratio is the ratio of the 
top decile wage to the bottom decile wage, and can be thought of a ratio of “high” to “low” wages. The P90 ratio is 
the ratio of the top decile wage to the median wage, and shows the relative wage position of top paid workers. The 
P10 ratio is the ratio of bottom decile wage to the median wage and shows the relative wage position of low-paid 
workers.
half the wage of the median worker. This represents a significant although not a dramatic 
deterioration of the relative earnings status of low-paid workers. 
In contrast, in the CIS the wage distribution has widened at both the lower and the upper 
tail, implying the emergence of very high and very low wages. Particularly, the earning status of 
low-paid workers has deteriorated in the CIS much more than in the European transition 
economies. For instance, in Russia before the transition a top paid worker was earning about 80 
percent more than the median worker. Presently he/she earns tree times as much. A low-paid 
worker was earning 45 percent less than the median worker, now he/she earns about 70 percent 
less. This represents a dramatic deterioration of the relative wage position of low-paid workers 
in Russia. The contrast with Poland is quite striking. The relative wage status of a low-paid 
Russian worker is much worse than that of his Polish counterpart. At the same time, the a top-paid 
Russian worker earns, in relative terms, much more than his Polish counterpart. 
Welfare effects of the increase in wage dispersion: low-paid employment and the working 
poor 
The increase in wage inequality that has occurred during the transition to some extent has 
been a natural process, reflecting wages becoming better aligned with productivity differentials 
among workers. To the extent this has been the case, the increase in wage dispersion has played 
a positive economic function by rewarding effort and providing better incentives for skill 
acquisition. At the same time, in some cases the increase in wage inequality might have resulted 
from non-competitive wage setting practices. On the one hand, firms with monopsony power 
might have used it to suppress wages of workers, especially those whose bargaining position is 
weak (e.g. less skilled workers who are easier to replace). On the other, managers might have 
appropriated rents enjoyed by firms with some monopoly power, and thus award themselves 
salaries above the competitive level. 
Regardless of the causes of the increase in wage inequality, it has important welfare 
effects. This is particularly the case if the wage distribution widens at the bottom, as it has 
actually happened during the transition in all transition countries, but especially in the CIS. 
Low-paid workers have become more numerous and their relative wage position has 
deteriorated. And low-pay often translates into poverty. After all, a substantial proportion – in 
some countries the majority– of the poor in transition countries are the “working poor” (World 
Bank, 2000). 
The incidence of low-pay has increased substantially along with the increase in wage 
inequality.12 In many countries the increase has been dramatic. For example, in Latvia and 
Romania the fraction of low-paid workers increased from virtually zero to 13-14 percent of total 
(formal sector) employment. In Serbia and Montenegro, the fraction of low-paid workers 
quadrupled and currently exceeds 20 percent. In Russia the incidence of low-pay has risen from 
7 percent before the transition to the current level of 23 percent. In Kyrgyzstan the fraction of 
low-paid workers has almost tripled, reaching 14 percent. Although in other countries the 
increase was more modest, it still has been considerable. 
In most of the transition economies the incidence of low-pay is presently high by 
international standards. In European OECD economies the incidence of low-pay is usually well 
below 10 percent. In contrast in most ECA transition economies the incidence of low-pay much 
12 We are using here a relative rather than an absolute concept of low-pay. According to the relative approach, 
low-pay is customarily defined as earnings lower than 50 percent of the median wage. This is a narrow definition 
which delimits very low wages. A broader definition (not used here) delimits low-pay as earnings less than 66 
percent of the median wage. 
34
exceeds 10 percent. Only in the Czech Republic and Hungary the incidence of low-pay is within 
the EU range (Rutkowski, 2001). 
Is the high incidence of low-pay a blessing or a curse? It is usually deemed as a curse, as 
frequently low-paid workers are poor. However, the high incidence of low-paid jobs can be also 
viewed as demonstrating the ability of the economy to provide employment to low-productivity 
workers who otherwise would be unemployed. Hence, to the extent the alternative to low-paid 
employment is unemployment, the availability of low-paid jobs actually helps to alleviate 
poverty. 
An increase in educational wage premia has been a major factor behind the rise in wage 
inequality 
The increase in wage dispersion is brought about by widening wage differentials between 
worker groups (e.g. skill groups) as well as by widening wage differentials within a given group. 
In other words, rising wage inequality reflects an increase in wage premier to various worker and 
firm characteristics. These include education and skills, occupation, sector of the economy, 
industry, or region. There is some evidence that during the transition there has been an increase 
in wage premia along all of these dimensions. For example, in Poland there is an evidence of the 
increased wage premia to education, to growing sectors and regions in the economy and to senior 
occupations (Newell, 2001). 
The increase in wage premia to education is probably the most important and the best 
documented observable factor that has caused the increase in wage dispersion in the transition 
economies.13 Under central planning wage differentials between highly educated workers and 
less educated workers tended to be relatively small. Evidence for CEE and Russia shows that the 
situation changed dramatically already during the first few years of the transition (Fleischer et 
al., 2004). Apparently the demand for high, blue collar skills has sharply risen, and that for less 
skilled manual labor has fallen. As a result wages and salaries of well educated and highly 
skilled workers have gone up, while wages of less educated workers have gone down, not only in 
relative terms but often also in absolute terms. These developments have led to a substantial 
increase in returns to education, especially to university education. At present, the annualized 
rate of return to education is similar or higher than that in West European economies (Orazem 
and Vodopivec, 1994, Vecernik, 1995; Rutkowski, 1996, 2001; Kertesi and Kollo, 2001; Newell 
and Reilly, 1997; Munich et al., 2000; Sabirianova, 2003). 
The increase in the premia to high skills and education (especially university education) 
has been driven by the private sector. That is, the private sector rewards high educational 
qualifications better than does the public sector. 
More generally, the pace of increase in returns to schooling has been positively related to 
the speed of market reforms. Returns to education increased faster in countries, where regulatory 
and institutional constraints on wage-setting were removed earlier. For example, in Ukraine, 
where the pace of market reforms has been slow, the increase in returns to schooling has been 
modest and they are still lower than in faster reforming economies of CEE as well as in Russia 
(Fleischer et al., 2004; Sabirianova Peter and Gorodnichenko, 2004). 
13 Evidence comes mainly from CEE, Russia and Ukraine. An earlier study (Newell and Reilly, 1997) found that 
returns to university education in Uzbekistan in 1995 were significantly lower than in CEE, Russia and in 
Kazakhstan. 
35
Minimum wages are relatively high in CEE and low in CIS 
Virtually all transition countries have in place minimum wages, although their “bite” 
measured by the ration of the minimum wage to the average wage differs considerably across 
country groups. In he European transition economies minimum wages are pitched at a relatively 
high level, on average around 40 percent of the average wage (Figure 13). The minimum ranges 
from about one-third of the average wage in Bulgaria and Romania, to over 50 percent of the 
average wage in Slovakia to two-thirds of the average wage in Slovenia. These minimum 
wage/average wage ratios are well within the OECD range, although in Europe the ratio is 
usually higher than in non-EU OECD members. 
Figure 13 The “bite” of the minimum wage varies across ECA countries 
Minimum Wage as Percentage of the Average Wage 
36 
2002 
70.00 
60.00 
50.00 
40.00 
30.00 
20.00 
10.00 
0.00 
Azerbaijan 
Russia 
Belarus 
CIS-7 
Moldova 
Armenia 
BRU 
Estonia 
Bulgaria 
Romania 
Latvia 
Czech Republic 
Poland 
Slovakia 
Ukraine 
Lithuania 
CEE 
Hungary 
Slovenia 
percent 
Source: UNICEF TransMONEE database; Bank staff calculations. 
In SEE in most cases there is no national minimum wage. However, minimum wages 
are fixed at the industry level by collective agreements between trade unions and employer 
representatives. In addition, these countries apply the minimum social security contribution 
threshold, which tends to be substituted for the minimum wage.14 
In the CIS national minimum wages are pitched at a much lower proportion of the 
average wage, with the notable exception of Ukraine, where currently (2002) the minimum wage 
accounts for 44 percent of the average wage, which is in the upper end of the CEE range. 
14 The minimum social security contributions threshold is the lowest notional wage which is used as the basis to 
calculate the amount of social security contributions. In principle workers can received wages that are lower than 
the threshold, although in practice this seems to be rare.
Labor market developments during economic transition

More Related Content

What's hot

How do regulated and unregulated labor markets respond to shocks? Evidence fr...
How do regulated and unregulated labor markets respond to shocks? Evidence fr...How do regulated and unregulated labor markets respond to shocks? Evidence fr...
How do regulated and unregulated labor markets respond to shocks? Evidence fr...
Stockholm Institute of Transition Economics
 
CASE Network Studies and Analyses 253 - When Should the Central Europeans Joi...
CASE Network Studies and Analyses 253 - When Should the Central Europeans Joi...CASE Network Studies and Analyses 253 - When Should the Central Europeans Joi...
CASE Network Studies and Analyses 253 - When Should the Central Europeans Joi...
CASE Center for Social and Economic Research
 
CASE Network Studies and Analyses 270 - Nominal and Real Convergence in Alter...
CASE Network Studies and Analyses 270 - Nominal and Real Convergence in Alter...CASE Network Studies and Analyses 270 - Nominal and Real Convergence in Alter...
CASE Network Studies and Analyses 270 - Nominal and Real Convergence in Alter...
CASE Center for Social and Economic Research
 
Klibel5 econ 6_
Klibel5 econ 6_Klibel5 econ 6_
Klibel5 econ 6_
KLIBEL
 
CASE Network Studies and Analyses 307 - Business Climate in CIS Countries
CASE Network Studies and Analyses 307 - Business Climate in CIS CountriesCASE Network Studies and Analyses 307 - Business Climate in CIS Countries
CASE Network Studies and Analyses 307 - Business Climate in CIS Countries
CASE Center for Social and Economic Research
 
CASE Network Studies and Analyses 455 - What Affects the Main Engine of Growt...
CASE Network Studies and Analyses 455 - What Affects the Main Engine of Growt...CASE Network Studies and Analyses 455 - What Affects the Main Engine of Growt...
CASE Network Studies and Analyses 455 - What Affects the Main Engine of Growt...
CASE Center for Social and Economic Research
 
Implications of Recession on Graduate Jobs, UK
Implications of Recession on Graduate Jobs, UKImplications of Recession on Graduate Jobs, UK
Implications of Recession on Graduate Jobs, UK
Renjith Sreekumar
 
CASE Network Report 64 - Tax Wedge and Skills: Case of Poland in Internationa...
CASE Network Report 64 - Tax Wedge and Skills: Case of Poland in Internationa...CASE Network Report 64 - Tax Wedge and Skills: Case of Poland in Internationa...
CASE Network Report 64 - Tax Wedge and Skills: Case of Poland in Internationa...
CASE Center for Social and Economic Research
 
60 sergey savchenko1 olena sukach2 volume 29 (5),
60 sergey savchenko1 olena sukach2 volume 29 (5), 60 sergey savchenko1 olena sukach2 volume 29 (5),
60 sergey savchenko1 olena sukach2 volume 29 (5),
smile790243
 
Yerkyebulan Bagdat
Yerkyebulan Bagdat Yerkyebulan Bagdat
Yerkyebulan Bagdat
erdddesddd
 
CASE Network Studies and Analyses 266 - Exchange Rate Regimes and the Nominal...
CASE Network Studies and Analyses 266 - Exchange Rate Regimes and the Nominal...CASE Network Studies and Analyses 266 - Exchange Rate Regimes and the Nominal...
CASE Network Studies and Analyses 266 - Exchange Rate Regimes and the Nominal...
CASE Center for Social and Economic Research
 
Perception of Job Instability in Europe
Perception of Job Instability in EuropePerception of Job Instability in Europe
Perception of Job Instability in Europe
Palkansaajien tutkimuslaitos
 
Nuraliyev Aidar_The economic relations between Russia and China
Nuraliyev Aidar_The economic relations between Russia and ChinaNuraliyev Aidar_The economic relations between Russia and China
Nuraliyev Aidar_The economic relations between Russia and ChinaAidar Nuraliyev
 
Jobs and Demographic change Ukraine 2013
Jobs and Demographic change Ukraine 2013Jobs and Demographic change Ukraine 2013
The Latvian Economy - 2010 September (pdf)
The Latvian Economy - 2010 September (pdf)The Latvian Economy - 2010 September (pdf)
The Latvian Economy - 2010 September (pdf)
Swedbank
 
Jobless Growth in Finland? Evidence from the 1990s
Jobless Growth in Finland? Evidence from the 1990sJobless Growth in Finland? Evidence from the 1990s
Jobless Growth in Finland? Evidence from the 1990s
Palkansaajien tutkimuslaitos
 
Unravelling the Mystery of Regional Unemployment in Finland
Unravelling the Mystery of Regional Unemployment in FinlandUnravelling the Mystery of Regional Unemployment in Finland
Unravelling the Mystery of Regional Unemployment in Finland
Palkansaajien tutkimuslaitos
 

What's hot (19)

How do regulated and unregulated labor markets respond to shocks? Evidence fr...
How do regulated and unregulated labor markets respond to shocks? Evidence fr...How do regulated and unregulated labor markets respond to shocks? Evidence fr...
How do regulated and unregulated labor markets respond to shocks? Evidence fr...
 
CASE Network Studies and Analyses 253 - When Should the Central Europeans Joi...
CASE Network Studies and Analyses 253 - When Should the Central Europeans Joi...CASE Network Studies and Analyses 253 - When Should the Central Europeans Joi...
CASE Network Studies and Analyses 253 - When Should the Central Europeans Joi...
 
CASE Network Studies and Analyses 270 - Nominal and Real Convergence in Alter...
CASE Network Studies and Analyses 270 - Nominal and Real Convergence in Alter...CASE Network Studies and Analyses 270 - Nominal and Real Convergence in Alter...
CASE Network Studies and Analyses 270 - Nominal and Real Convergence in Alter...
 
Klibel5 econ 6_
Klibel5 econ 6_Klibel5 econ 6_
Klibel5 econ 6_
 
CASE Network Studies and Analyses 307 - Business Climate in CIS Countries
CASE Network Studies and Analyses 307 - Business Climate in CIS CountriesCASE Network Studies and Analyses 307 - Business Climate in CIS Countries
CASE Network Studies and Analyses 307 - Business Climate in CIS Countries
 
CASE Network Studies and Analyses 455 - What Affects the Main Engine of Growt...
CASE Network Studies and Analyses 455 - What Affects the Main Engine of Growt...CASE Network Studies and Analyses 455 - What Affects the Main Engine of Growt...
CASE Network Studies and Analyses 455 - What Affects the Main Engine of Growt...
 
Implications of Recession on Graduate Jobs, UK
Implications of Recession on Graduate Jobs, UKImplications of Recession on Graduate Jobs, UK
Implications of Recession on Graduate Jobs, UK
 
CASE Network Report 64 - Tax Wedge and Skills: Case of Poland in Internationa...
CASE Network Report 64 - Tax Wedge and Skills: Case of Poland in Internationa...CASE Network Report 64 - Tax Wedge and Skills: Case of Poland in Internationa...
CASE Network Report 64 - Tax Wedge and Skills: Case of Poland in Internationa...
 
60 sergey savchenko1 olena sukach2 volume 29 (5),
60 sergey savchenko1 olena sukach2 volume 29 (5), 60 sergey savchenko1 olena sukach2 volume 29 (5),
60 sergey savchenko1 olena sukach2 volume 29 (5),
 
Yerkyebulan Bagdat
Yerkyebulan Bagdat Yerkyebulan Bagdat
Yerkyebulan Bagdat
 
CASE Network Studies and Analyses 266 - Exchange Rate Regimes and the Nominal...
CASE Network Studies and Analyses 266 - Exchange Rate Regimes and the Nominal...CASE Network Studies and Analyses 266 - Exchange Rate Regimes and the Nominal...
CASE Network Studies and Analyses 266 - Exchange Rate Regimes and the Nominal...
 
MasterThesis_Arsova
MasterThesis_ArsovaMasterThesis_Arsova
MasterThesis_Arsova
 
Perception of Job Instability in Europe
Perception of Job Instability in EuropePerception of Job Instability in Europe
Perception of Job Instability in Europe
 
20081121 sme-rus
20081121 sme-rus20081121 sme-rus
20081121 sme-rus
 
Nuraliyev Aidar_The economic relations between Russia and China
Nuraliyev Aidar_The economic relations between Russia and ChinaNuraliyev Aidar_The economic relations between Russia and China
Nuraliyev Aidar_The economic relations between Russia and China
 
Jobs and Demographic change Ukraine 2013
Jobs and Demographic change Ukraine 2013Jobs and Demographic change Ukraine 2013
Jobs and Demographic change Ukraine 2013
 
The Latvian Economy - 2010 September (pdf)
The Latvian Economy - 2010 September (pdf)The Latvian Economy - 2010 September (pdf)
The Latvian Economy - 2010 September (pdf)
 
Jobless Growth in Finland? Evidence from the 1990s
Jobless Growth in Finland? Evidence from the 1990sJobless Growth in Finland? Evidence from the 1990s
Jobless Growth in Finland? Evidence from the 1990s
 
Unravelling the Mystery of Regional Unemployment in Finland
Unravelling the Mystery of Regional Unemployment in FinlandUnravelling the Mystery of Regional Unemployment in Finland
Unravelling the Mystery of Regional Unemployment in Finland
 

Viewers also liked

Featured insight heatingwithoutglobalwarming_final
Featured insight heatingwithoutglobalwarming_finalFeatured insight heatingwithoutglobalwarming_final
Featured insight heatingwithoutglobalwarming_finalDr Lendy Spires
 
Creating competitive-advantage-in-retail
Creating competitive-advantage-in-retailCreating competitive-advantage-in-retail
Creating competitive-advantage-in-retailDr Lendy Spires
 
Bsr ungc supply_chainreport
Bsr ungc supply_chainreportBsr ungc supply_chainreport
Bsr ungc supply_chainreportDr Lendy Spires
 
The role of the informal sector in contributing to the urban landscape
The role of the informal sector in contributing to the urban landscapeThe role of the informal sector in contributing to the urban landscape
The role of the informal sector in contributing to the urban landscapeDr Lendy Spires
 
.Cliffe dekker-hofmeyr-bee-brochure
.Cliffe dekker-hofmeyr-bee-brochure.Cliffe dekker-hofmeyr-bee-brochure
.Cliffe dekker-hofmeyr-bee-brochureDr Lendy Spires
 
Tanzania deepening engagement with india through better market access
Tanzania   deepening engagement with india through better market accessTanzania   deepening engagement with india through better market access
Tanzania deepening engagement with india through better market accessDr Lendy Spires
 
Organizing in the informal economy
Organizing in the informal economyOrganizing in the informal economy
Organizing in the informal economyDr Lendy Spires
 
Effects of carbon taxes in an economy with large informal sector and rural ur...
Effects of carbon taxes in an economy with large informal sector and rural ur...Effects of carbon taxes in an economy with large informal sector and rural ur...
Effects of carbon taxes in an economy with large informal sector and rural ur...Dr Lendy Spires
 
Atlas eHealth country profile
Atlas eHealth country profileAtlas eHealth country profile
Atlas eHealth country profile
Dr Lendy Spires
 

Viewers also liked (13)

Featured insight heatingwithoutglobalwarming_final
Featured insight heatingwithoutglobalwarming_finalFeatured insight heatingwithoutglobalwarming_final
Featured insight heatingwithoutglobalwarming_final
 
Creating competitive-advantage-in-retail
Creating competitive-advantage-in-retailCreating competitive-advantage-in-retail
Creating competitive-advantage-in-retail
 
Memo 13-367 en(1)
Memo 13-367 en(1)Memo 13-367 en(1)
Memo 13-367 en(1)
 
Bsr ungc supply_chainreport
Bsr ungc supply_chainreportBsr ungc supply_chainreport
Bsr ungc supply_chainreport
 
The role of the informal sector in contributing to the urban landscape
The role of the informal sector in contributing to the urban landscapeThe role of the informal sector in contributing to the urban landscape
The role of the informal sector in contributing to the urban landscape
 
.Cliffe dekker-hofmeyr-bee-brochure
.Cliffe dekker-hofmeyr-bee-brochure.Cliffe dekker-hofmeyr-bee-brochure
.Cliffe dekker-hofmeyr-bee-brochure
 
153108
153108153108
153108
 
Tanzania deepening engagement with india through better market access
Tanzania   deepening engagement with india through better market accessTanzania   deepening engagement with india through better market access
Tanzania deepening engagement with india through better market access
 
Organizing in the informal economy
Organizing in the informal economyOrganizing in the informal economy
Organizing in the informal economy
 
Effects of carbon taxes in an economy with large informal sector and rural ur...
Effects of carbon taxes in an economy with large informal sector and rural ur...Effects of carbon taxes in an economy with large informal sector and rural ur...
Effects of carbon taxes in an economy with large informal sector and rural ur...
 
Bic bbi sira_web
Bic bbi sira_webBic bbi sira_web
Bic bbi sira_web
 
Memo 13-367 en
Memo 13-367 enMemo 13-367 en
Memo 13-367 en
 
Atlas eHealth country profile
Atlas eHealth country profileAtlas eHealth country profile
Atlas eHealth country profile
 

Similar to Labor market developments during economic transition

CASE Network Studies and Analyses 311 - Labor Markets in CIS Countries
CASE Network Studies and Analyses 311 - Labor Markets in CIS CountriesCASE Network Studies and Analyses 311 - Labor Markets in CIS Countries
CASE Network Studies and Analyses 311 - Labor Markets in CIS Countries
CASE Center for Social and Economic Research
 
Labour markets in the post soviet space
Labour markets in the post soviet spaceLabour markets in the post soviet space
Labour markets in the post soviet space
Markku Sippola
 
Earning inequality and the informal economy
Earning inequality and the informal economyEarning inequality and the informal economy
Earning inequality and the informal economyDr Lendy Spires
 
4.54mb.pdf
4.54mb.pdf4.54mb.pdf
4.54mb.pdf
FizaBatool34
 
CASE Network Studies and Analyses 351 - Analysis of cross-country differences...
CASE Network Studies and Analyses 351 - Analysis of cross-country differences...CASE Network Studies and Analyses 351 - Analysis of cross-country differences...
CASE Network Studies and Analyses 351 - Analysis of cross-country differences...
CASE Center for Social and Economic Research
 
Colliers International - Labour force riddle
Colliers International - Labour force riddleColliers International - Labour force riddle
Colliers International - Labour force riddle
Juliane Priesemeister
 
Swedbank Analysis
Swedbank AnalysisSwedbank Analysis
Swedbank Analysis
Swedbank
 
Nikos Papadakis - Labour Market and MicroCredentials
Nikos Papadakis - Labour Market and MicroCredentialsNikos Papadakis - Labour Market and MicroCredentials
Nikos Papadakis - Labour Market and MicroCredentials
EADTU
 
The impact of globalisation on the informal sector in africa
The impact of globalisation on the informal sector in africaThe impact of globalisation on the informal sector in africa
The impact of globalisation on the informal sector in africa
Dr Lendy Spires
 
The impact of globalization on the infromal sctor in africa
The impact of globalization on the infromal sctor in africaThe impact of globalization on the infromal sctor in africa
The impact of globalization on the infromal sctor in africaDr Lendy Spires
 
CASE Network Studies and Analyses 383 - Effects of the EU-Enlargement on Inco...
CASE Network Studies and Analyses 383 - Effects of the EU-Enlargement on Inco...CASE Network Studies and Analyses 383 - Effects of the EU-Enlargement on Inco...
CASE Network Studies and Analyses 383 - Effects of the EU-Enlargement on Inco...
CASE Center for Social and Economic Research
 
Full employment and decent work for all regional high lights
Full employment and decent work for all regional high lightsFull employment and decent work for all regional high lights
Full employment and decent work for all regional high lightsDr Lendy Spires
 
Demographic change and its impact on the EU labour markets
Demographic change and its impact on the EU labour marketsDemographic change and its impact on the EU labour markets
Demographic change and its impact on the EU labour markets
European Economic and Social Committee - SOC Section
 
Unemployment_in_the_European_Union[1]
Unemployment_in_the_European_Union[1]Unemployment_in_the_European_Union[1]
Unemployment_in_the_European_Union[1]Bobby Fraser
 
Global Wage Report 2012/13 Executive Summary
Global Wage Report 2012/13 Executive SummaryGlobal Wage Report 2012/13 Executive Summary
Global Wage Report 2012/13 Executive Summary
Dr Lendy Spires
 
Wage Structure Effects of International Trade: Evidence from a Small Open Eco...
Wage Structure Effects of International Trade: Evidence from a Small Open Eco...Wage Structure Effects of International Trade: Evidence from a Small Open Eco...
Wage Structure Effects of International Trade: Evidence from a Small Open Eco...trang89
 
Comparative analysis of the socioeconomic and demographic change in Europe: i...
Comparative analysis of the socioeconomic and demographic change in Europe: i...Comparative analysis of the socioeconomic and demographic change in Europe: i...
Comparative analysis of the socioeconomic and demographic change in Europe: i...
ifoasapereutile
 
Lurking in the Cities: Urbanization and the Informal Economy
Lurking in the Cities: Urbanization and the Informal Economy Lurking in the Cities: Urbanization and the Informal Economy
Lurking in the Cities: Urbanization and the Informal Economy
Dr Lendy Spires
 

Similar to Labor market developments during economic transition (20)

CASE Network Studies and Analyses 311 - Labor Markets in CIS Countries
CASE Network Studies and Analyses 311 - Labor Markets in CIS CountriesCASE Network Studies and Analyses 311 - Labor Markets in CIS Countries
CASE Network Studies and Analyses 311 - Labor Markets in CIS Countries
 
Labour markets in the post soviet space
Labour markets in the post soviet spaceLabour markets in the post soviet space
Labour markets in the post soviet space
 
Earning inequality and the informal economy
Earning inequality and the informal economyEarning inequality and the informal economy
Earning inequality and the informal economy
 
4.54mb.pdf
4.54mb.pdf4.54mb.pdf
4.54mb.pdf
 
CASE Network Studies and Analyses 351 - Analysis of cross-country differences...
CASE Network Studies and Analyses 351 - Analysis of cross-country differences...CASE Network Studies and Analyses 351 - Analysis of cross-country differences...
CASE Network Studies and Analyses 351 - Analysis of cross-country differences...
 
Colliers International - Labour force riddle
Colliers International - Labour force riddleColliers International - Labour force riddle
Colliers International - Labour force riddle
 
Swedbank Analysis
Swedbank AnalysisSwedbank Analysis
Swedbank Analysis
 
Nikos Papadakis - Labour Market and MicroCredentials
Nikos Papadakis - Labour Market and MicroCredentialsNikos Papadakis - Labour Market and MicroCredentials
Nikos Papadakis - Labour Market and MicroCredentials
 
The impact of globalisation on the informal sector in africa
The impact of globalisation on the informal sector in africaThe impact of globalisation on the informal sector in africa
The impact of globalisation on the informal sector in africa
 
The impact of globalization on the infromal sctor in africa
The impact of globalization on the infromal sctor in africaThe impact of globalization on the infromal sctor in africa
The impact of globalization on the infromal sctor in africa
 
CASE Network Studies and Analyses 383 - Effects of the EU-Enlargement on Inco...
CASE Network Studies and Analyses 383 - Effects of the EU-Enlargement on Inco...CASE Network Studies and Analyses 383 - Effects of the EU-Enlargement on Inco...
CASE Network Studies and Analyses 383 - Effects of the EU-Enlargement on Inco...
 
lse-uct essay 1
lse-uct essay 1lse-uct essay 1
lse-uct essay 1
 
Full employment and decent work for all regional high lights
Full employment and decent work for all regional high lightsFull employment and decent work for all regional high lights
Full employment and decent work for all regional high lights
 
Demographic change and its impact on the EU labour markets
Demographic change and its impact on the EU labour marketsDemographic change and its impact on the EU labour markets
Demographic change and its impact on the EU labour markets
 
Unemployment_in_the_European_Union[1]
Unemployment_in_the_European_Union[1]Unemployment_in_the_European_Union[1]
Unemployment_in_the_European_Union[1]
 
Global Wage Report 2012/13 Executive Summary
Global Wage Report 2012/13 Executive SummaryGlobal Wage Report 2012/13 Executive Summary
Global Wage Report 2012/13 Executive Summary
 
Reform maps of eastern europe have the roads to prosperity passed through t...
Reform maps of eastern europe   have the roads to prosperity passed through t...Reform maps of eastern europe   have the roads to prosperity passed through t...
Reform maps of eastern europe have the roads to prosperity passed through t...
 
Wage Structure Effects of International Trade: Evidence from a Small Open Eco...
Wage Structure Effects of International Trade: Evidence from a Small Open Eco...Wage Structure Effects of International Trade: Evidence from a Small Open Eco...
Wage Structure Effects of International Trade: Evidence from a Small Open Eco...
 
Comparative analysis of the socioeconomic and demographic change in Europe: i...
Comparative analysis of the socioeconomic and demographic change in Europe: i...Comparative analysis of the socioeconomic and demographic change in Europe: i...
Comparative analysis of the socioeconomic and demographic change in Europe: i...
 
Lurking in the Cities: Urbanization and the Informal Economy
Lurking in the Cities: Urbanization and the Informal Economy Lurking in the Cities: Urbanization and the Informal Economy
Lurking in the Cities: Urbanization and the Informal Economy
 

Labor market developments during economic transition

  • 1. WPS3894 LABOR MARKET DEVELOPMENTS DURING ECONOMIC TRANSITION* Jan Rutkowski World Bank Policy Research Working Paper 3894, April 2006 The Policy Research Working Paper Series disseminates the findings of work in progress to encourage the exchange of ideas about development issues. An objective of the series is to get the findings out quickly, even if the presentations are less than fully polished. The papers carry the names of the authors and should be cited accordingly. The findings, interpretations, and conclusions expressed in this paper are entirely those of the authors. They do not necessarily represent the view of the World Bank, its Executive Directors, or the countries they represent. Policy Research Working Papers are available online at http://econ.worldbank.org. *This paper was prepared as a background paper for the 2005 ECA Labor Market Study. I would like to thank Mamta Murthi for helpful comments, and Barbara Ziolkowska for preparing the paper for publication.
  • 2. INTRODUCTION The purpose of this paper is to identify key labor market trends and patterns which have emerged during the economic transition in Europe and Central Asia (ECA). The paper argues that the scarcity of productive job opportunities and growing labor market segmentation are the two main labor market problems in ECA.1 In the European transition economies (ETE)the lack of jobs has led to persistent open unemployment. In the Commonwealth of Independent States (CIS) it has led to hidden unemployment (underemployment or low-productivity employment). Unemployment in the European transition economies is supported by the developed social safety net. In contrast, in the CIS for most workers unemployment is not an affordable option. They either stick to their old, unproductive jobs in unrestructured enterprises, or work in the informal sector, or resort to subsistence agriculture. Low-productivity employment in the CIS is a mirror image of unemployment in the European transition economies. Accordingly, the high employment-to-population ratios still prevailing in many CIS countries do not necessarily signify favorable labor market performance. Instead they often indicate delayed enterprise restructuring, the maintenance of unsustainable jobs in uncompetitive firms, and the existence of a large informal sector as an employer of last resort. Labor market segmentation in transition economies has been caused by a sharp increase in earnings differentials and an attendant increase in the incidence of low-paid jobs, by the polarization of regional labor market conditions, and finally by the growth of the informal sector offering casual, low-productivity jobs. Labor market segmentation and accompanying inequalities are more pronounced in the CIS than in the European transition economies. The scope of this paper is limited to the review of key labor market developments during the transition. A more in depth analysis of labor market transition is provided in (Svejnar, 1999). Useful discussion of labor market outcomes during the transition is also provided in Boeri and Terrel (2002) and Riboud et al. (2002). Rashid and Rutkowski (2001) examine labor market outcomes at an earlier stage of the transition. The paper consists of four sections. Section I looks at labor force (quantity) adjustment to various macroeconomic shocks that hit transition economies countries during the 1990s. Section II focuses on the characteristics of unemployment in ECA. Section III examines the wage (price) adjustment. Section IV summarizes key stylized fact on labor market transition.. 1 The term “European transition economies” (ETE) refers to countries of Central and Eastern Europe (CEE) and Southern and Eastern Europe (SEE). The latter includes countries of the former Yugoslavia except Slovenia plus Albania. The Commonwealth of Independent States (CIS) is comprised of the countries of the FSU: Belarus, Russia and Ukraine (BRU), and the other CIS countries. The latter include so called CIS-7 and Kazakhstan (CIS-7 + K). 2
  • 3. I. LABOR FORCE, EMPLOYMENT AND UNEMPLOYMENT Large employment reductions in European transition economies and modest ones in the CIS One key feature of the labor market under the soviet-style socialism was high labor force participation and full employment. Unemployment was virtually nonexistent. Full employment was achieved through overstaffing made possible by the soft budget constraint. Overstaffing, also referred to as labor hoarding, meant that enterprises were employing more workers that was necessary to produce given output. This meant “unemployment on the job” and low labor productivity, which translated into low wages. The situation was different in Yugoslavia, where enterprises were exposed to competition and faced harder budget constraint. In addition, labor managed firms – the salient feature of the Yugoslav system – did not have an incentive to maximize employment, but instead awarded workers, who formally owned the firm, higher wages. Profound institutional and structural changes associated with the economic transition – economic liberalization, privatization, hard budget constraint, and the emergence of product market competition – as well as the disintegration of existing economic ties led to a substantial drop in output. This was followed by both employment and wage adjustments, although the patterns of adjustment varied by sub-regions. Generally, in European transition economies the burden of adjustment fell on employment, while in the FSU countries the burden of adjustment fell on wages. In European transition economies employment is presently 20 to 30 percent lower than before the transition. The job loses were heavily concentrated during the first phase of the transition (until the mid-1990s) and continued at a much slower pace afterwards. After all, since the late 1990s some countries (the Baltic states, Hungary, Slovenia) have seen net job creation and employment growth. Romania is an exception to this pattern, as employment started to decline there later than in other countries, indicating delayed restructuring. As to the middle-income CIS, in Kazakhstan and Ukraine job losses were of similar magnitude as in the Central and East European (CEE) countries (some 30 percent), with job destruction accelerated in the second half of the 1990s, again pointing to delayed restructuring. In contrast, in Belarus and Russia, the drop in employment was much more modest, accounting for around 15 percent. In the low-income CIS countries the fall in employment apparently has been much more modest than in other transition economies, although for many countries consistent time series on employment are lacking. For example, in Moldova employment declined by less than 10 percent during 1990-2002. In a few CIS-7 countries (Azerbaijan, Kyrgyz Republic, Uzbekistan) employment has started to increase in the late 1990s. 3
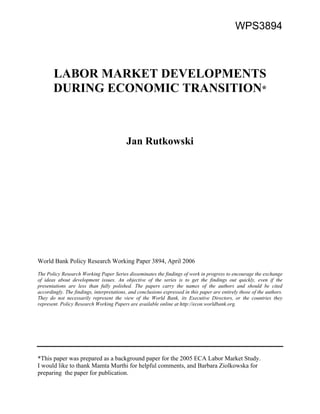
  • 4. Box 1 Measurement of employment: household vs. firm based surveys The magnitude of measured employment decline in transition economies depends on the statistical source. It tends to be much larger if data come from firm based Employment surveys, and relatively smaller if data comes from the household based Labor Force Survey (LFS). The discrepancy stems from the fact that firm based surveys cover only registered, formal sector firms, while the LFS in principle provides data on all employed individuals. Thus, the difference in employment between those two sources is an approximate measure of informal sector employment, employment in small private firms, which often are under-represented in employer based-surveys, and self-employment. This difference also reflects the changing nature of jobs in ECA. There has been a partial shift from regular full-time jobs toward casual jobs, often in the informal sector, as well as a partial shift form wage and salary employment towards self-employment. The firm based employment surveys do not account for irregular jobs and overestimate the actual job loses, however they show quite accurately the decline in the number of traditional, regular jobs. Despite the substantial job loses the employment ratio is still relatively high The substantial job loses that have occurred during the transition are reflected in the lower degree of the utilization of labor resources. The employment ratio – which shows the percentage of the population of working age that is employed –is presently much lower than before the transition in virtually all transition economies. On average it dropped by close to 20 percentage points in CEE, around 15 percentage points in Belarus, Russia and Ukraine, and some 10 percentage points in other CIS (Figure 1). This means that 10 to 20 percent of the working age population which would have been employed under the old regime, is currently without work. Apparently, this is a large decline in the utilization of labor. However, despite this big decline, the employment ratio in most transition economies is still within the OECD range. Figure 1 Transition has been associated with a substantial fall in the employment-to-population 4 ratio Employment/Population Ratio, 2002 80 70 60 50 40 30 20 10 0 Geo Aze Kaz Cze Sl v Rus Est BRU Bel Lat Ukr Lit OECD CIS-7 + K CEE EU15 Mol Uzb Kyr Rom Hun Bul Pol Sl k Cro Arm Taj Alb SEE Mac SAM Source: UNICEF TRansMONEE database; OECD Employment Outlook, 2003
  • 5. The average employment ratio for CEE is presently about 64 percent, virtually the same as for the European Union (before the enlargement) and for the OECD. In the CIS it is even higher, above the OECD average. This somewhat surprising observation reflects the fact that under central planning the employment ratio tended to be at an unusually high level. The transition has been thus associated with a movement of employment rates towards a level characteristic of market economies. Such process is called a regression toward the mean. In many transition economies the current employment rates may be close to the equilibrium rates, which implies that there will be no return to the high employment rates prevailing before the transition. Obviously, there is a substantial variation in employment ratios across countries. On the one hand, there are transition economies where the ratio is around 70 percent, which is high by international standards. These include the Czech Republic, Estonia, Lithuania in CEE, Belarus and Russia, and Azerbaijan and Kazakhstan among the other CIS (Figure 2). Figure 2 Employment rates vary among transition economies Change in the Employment Rate, 1989-2001 5 0 -2 -4 -6 -8 -10 -12 -14 -16 -18 CEE BRU 0ther CIS percentage points Source: UNICEF TransMONEE database; Bank staff calculations 1995-2001 1989-1995 On the other end of the spectrum are countries such as Bulgaria, Poland and Slovakia among the CEE countries, and Armenia and Tajikistan among the CIS, where the employment ratio is significantly below the OECD average. High employment rates in slowly restructuring countries may not be sustainable High employment rates may imply a successful transition (Estonia is probably a good example), but may also imply slow and delayed restructuring. In the latter case many existing jobs are of low productivity and probably are not viable in the longer-run. The symptoms indicating the existence of low-productivity and non-viable jobs include high prevalence of wage
  • 6. arrears, forced unpaid leave, short working hours. These jobs can exist only as long as enterprises are not subject to competition and receive direct or indirect subsidies (e.g. tax arrears, non-payment of utility bills). Such non-viable jobs still exist largely in the CIS countries, including Belarus, Moldova, Russia and Ukraine, where enterprise restructuring has proceeded at a slower pace (See Box 2) Box 2 High employment but many of the jobs are of low productivity and unviable Moldova is an example of a country with a relatively high employment and a low unemployment rates where a large proportion of jobs is of low productivity and thus probably unsustainable. As much as 20 percent of privatized firms reported overstaffing in 2001. Moreover, one of every 10 workers was on a forced unpaid leave and the average duration of such leave was three months. Many Moldovan firms close for a part of the year. As a result of the low level of activity in poorly performing firms the actual hours of work are very low. An average workers in Moldova works only 28 hours per week, while his Polish, say, counterpart works 42 hours. Similar problems, although to a lesser and decreasing degree occur in Russia (World Bank, 2003). Source: Rutkowski (2004) Emergence of unemployment and decline in labor force participation The dramatic decrease in the number of available jobs caused by the shocks associated with economic transition, especially at its early stage, gave rise to unemployment and the fall in labor force participation. The unemployed are, by definition, those workers who lack jobs and are actively looking for new ones. Persons out of the labor force (economically inactive) comprise of two categories. First, the discouraged workers, that is able bodied people of working age who would like to work, but who gave up job search as their efforts proved futile and they ceased to believe that they can find a job. Second, persons who for various reasons are not interested in having a job, for example students enrolled in full time education, homemakers, persons with disability, or older persons. The dynamics of unemployment and the labor force hinges on labor market conditions. Unemployment tends to increase as labor market conditions deteriorate. However, it may temporarily increase in response to the increase in the availability of job opportunities as workers who had been inactive enter the labor market and start looking for jobs. Labor force participation as a rule falls when labor market conditions worsen. Some workers become discouraged, and cease looking for jobs (thus, rather than being classified as unemployed they are classified as inactive). Younger people may chose to stay longer in education to delay the entering the labor market. Some workers may take advantage of benefits offered by the welfare state: social assistance, disability pensions, or early retirement. Older workers chose retirement and do not try to supplement their pensions with income from work. In the transition economies all these effects have occurred in response to the fall in aggregate and, consequently labor, demand. Labor force participation rates fell and unemployment rose across the board. However, in various countries these effects have occurred in different proportions. In some countries the loss of jobs has translated largely into an increase in unemployment. In others, it has mainly led to a fall in labor force participation rates. Thus, labor force patterns differ across ECA countries (Table 1). For example, in the late 1990s the employment ratio – and thus roughly the number of available jobs – in Hungary and Poland was virtually the same. However, unemployment in Poland was high (well over 15 percent), while in Hungary it was relatively low (below 10 percent). Thus, Hungary and Poland exhibited different 6
  • 7. pattern of adjustment to the fall in demand and job losses: in Hungary the reaction was mainly labor force withdrawal, whereas in Poland it was mainly active search for new jobs. These differential responses can be accounted for by differences in labor market institutions (e.g. benefit systems). Table 1 Employment, unemployment and labor force participation, 2001 7 Employment Rate Unemployment rate Labor force participation rate CEE 59.3 11.0 67.1 Bulgaria 50.6 18.1 61.9 Czech Republic 65.5 7.3 70.7 Estonia 62.0 9.1 69.3 Hungary 56.6 5.6 60.1 Latvia 60.4 12.8 68.8 Lithuania 59.9 13.1 69.6 Poland 51.5 19.9 64.6 Romania 57.6 7.0 63.4 Slovakia 56.8 18.6 69.9 Slovenia 63.4 6.0 67.8 SEE 45.7 19.1 56.8 Bosnia and Herzegovina 40.1 16.4 48.0 Croatia 53.7 14.4 62.9 Macedonia, FYR 40.4 31.9 59.8 Serbia and Montenegro b) 48.5 13.8 56.3 BRU 67.9 9.6 72.6 Belarus - - - Russia a) 75.8 8.0 82.5 Ukraine 60.0 11.1 62.7 Other CIS 56.9 11.0 63.7 Armenia - - - Azerbaijan - - - Georgia b) 56.8 12.3 65 Kazakhstan c) 63.6 9.3 70.1 Kyrgyzstan - 12.5 - Moldova d) 50.4 9.8 56.0 Tajikistan - - - Uzbekistan - - - Memorandum OECD 65.1 6.9 69.9 EU15 64.3 7.7 69.7 - Data not available Note: Labor Force Survey data Definitions: Working-age population: 15-64 Labor force = employed plus unemployed (aged 15+) Labor force participation rate = labor force 15-64 as a percentage of working age population Employment rate = employed 15-64 as a percentage of working age population Unemployment rate = unemployed as a percentage of the labor force
  • 8. a) Working age population: 20-59 b) Working age populations: 15+ c) Working age population: 15-74 d) 1st quarter of 2003 Source: CEE countries and EU: Eurostat (Employment in Europe 2003) Bosnia and Herzegovina: World Bank (2002b) Croatia: Central Bureau of Statistics, Labour Force Survey 2002 (second half), Bank staff calculations. Serbia and Montenegro: Republic of Serbia, Republican Statistical Office, Labor Force Survey 2002 (October), Bank staff calculations Georgia, Kazakhstan and Kyrgyzstan: ILO LABORSTA Labour Statistics Database; Bank staff calculations. Russia: Goskomstat; Bank staff calculations. Moldova: Department of Statistics and Sociology of the Republic of Moldova; Bank staff calculations Different labor force responses to the accelerated job destruction occurring in the wake of economic restructuring have given rise to different labor market patterns, which are summarized in Table 2. Table 2 Patterns of labor force adjustments 8 Unemployment Labor force participation High Low High Limited job opportunities. But workers look for jobs. Georgia, Lithuania (late 1990s), Poland (late 1990s), Serbia, Slovakia, Ukraine High employment. But are the jobs sustainable? Czech R., Estonia, Lithuania (2000s), Moldova, Romania, Russia, Slovenia Low Scarcity of jobs. Some workers get discouraged while others continue searching for jobs. Bulgaria, BiH, Croatia, Latvia, Macedonia, Poland (early 2000s) Limited job opportunities. Most workers cease looking for jobs. Hungary The four basic patterns of adjustment are as follows. High employment. The category combining high labor force participation rate and low unemployment rate implies a high employment-to-population ration, and thus is apparently the most desirable one. However, it comprises two distinctly different sub categories: countries such as Estonia or Slovenia, where high employment is a consequence of successful transition, and countries, such as Moldova or Romania, where high employment is associated with slow restructuring and a high share of low productivity jobs (e.g. in subsistence agriculture, or in non-profitable enterprises). To some extent, the delayed restructuring can be tracked back to the nature of the privatization process in this countries (mass privatization schemes with dispersed ownership structures and thus weaker governance). Limited job opportunities: in search of jobs. This category comprises countries such as Georgia or Slovakia, where labor force participation rates are high, but so is unemployment. This combination suggests that unemployed workers still see employment opportunities and thus actively search for jobs. Relatively few workers are discouraged and gave up job search. As a
  • 9. result, employment level is still relatively high. In a way, this labor market state is a transient one. It can evolve into a depressed labor market, as it has happened in Poland in early 2000s, or into vibrant labor market as it has happened in Lithuania at around the same time. Limited job opportunities: discouragement. Hungary is an example of a country where in the face of limited job opportunities a large fraction of jobless workers withdraws from the labor force. Unemployment is thus low, but so is the labor force participation rate (which may be possible thanks to the availability of non-employment benefits). As a result, low unemployment coincides with relatively low employment. The employment effect is similar to that in countries where both the labor force participation and unemployment are higher (the previous group). Scarcity of jobs: unemployment and discouragement. This combination of high unemployment and low labor force participation rates, prevailing in countries such as Bulgaria and Croatia, signifies a depressed labor market, with the resulting low employment level. High unemployment in this case is likely to reflect the fact that many jobless workers (e.g. primary earners, the poor) cannot afford to be out of the labor force and are compelled to actively search for work. To sum up, labor force adjustment has taken various forms during economic transition. In some countries, changes in labor demand led mainly to changes in unemployment, in others mainly to changes in labor force participation. Moreover, labor market adjustment during the transition has been a dynamic process, with changes in labor market conditions inducing movements between unemployment and economic inactivity (Boeri, 1995). Disproportionately low male employment rates The male employment rate is significantly higher than the female employment rate in all transition economies.2 This is due to the difference in the labor force participation rate, which is much lower for women, rather than the unemployment rate which tends to be similar for men and women (Figure 3). Figure 3 Labor force indicators by gender, 2002 A. Employment/populaion Ratio, 2002 9 80 70 60 50 40 30 20 10 0 CEE EU15 percent Men Women 2 This statement is based on data for CEE countries and Russia. However, it is highly unlikely that the common pattern of higher male than female employment rate does not apply to other ECA countries.
  • 10. B. Labor Force Participation Rate, 2002 10 90 80 70 60 50 40 30 20 10 0 CEE EU15 percent Men Women C. Unemployment rate by gender, 2002 90 80 70 60 50 40 30 20 10 0 CEE EU15 percent Men Women This is not surprising, however, as the female labor force participation rate, and correspondingly the employment rate, is lower than that of men in virtually all societies, and the transition economies are no exception to this regularity. For example in the EU15, the gap between the male and female labor force participation rate is 17 percentage points, compared with 12 percentage points in CEE. So, the gap between the male and female labor force participation rate is significantly smaller in CEE countries than in the EU15. Given that the female labor force participation rate in CEE is the same as in the EU15 (on average 61 percent), and the employment rates are pretty similar, there is no sign of the underutilization of female labor in CEE. The picture is different, however, in the low-income CIS countries, where female labor force participation rate has been traditionally lower. Where CEE countries differ from the EU15 countries is not female but male employment. It is male labor resources that are underutilized. In CEE both the male labor force participation rate and the employment rate are much lower than in EU15, which is in stark contrast with the female rates. To illustrate, there is a 6 percentage points gap in the male labor force participation rate between the EU15 and CEE (no such gap in the case of the female labor force participation rate). Given that male unemployment is much higher in CEE than in EU, this translates into an even bigger difference in the male employment rate: 64 percent in CEE compared with 73
  • 11. percent in EU15. Thus, if one uses the EU15 as a benchmark, men are underemployed in CEE, while women are not. What explains these particularly low male employment rates? On possible explanations is that the restructuring process has been biased against manual, less skilled labor and this has put men at disadvantage. The industries that have been declining, especially the heavy industry, were employing predominantly male labor. In contrast, the expanding service sector relies to a much greater extent on female labor. Moreover, the restructuring is associated with the increase in the relative demand for higher, mainly non-manual, skills which benefits women more, as in many transition economies women tend to be better educated than men. In other words, there is indication that during the transition the demand for male labor, which tends to be manual and less skilled – has been hurt more than that for the female labor, which tends to be non-manual and more skilled. In addition, one should bear in mind that the female labor force participation rates were very high by international standards in most socialist countries, and accordingly the gender gap in labor force participation was relatively small. The transition shock lowered both male and female employment rates, but while it has brought female employment rates to the EU level, it brought the male rates well below the EU level. This and other aspects of the gender labor market differences in transition economies are explored in more detail in Paci (2002). The changing nature of employment In socialist economies workers were used to having regular, full time wage and salary employment. Jobs were secure (permanent employment contracts were the norm; dismissals were possible only for major misdemeanor, and thus very rare) and employment was providing a range of fringe benefits. This has changed dramatically during the course of transition. Job security was largely lost as attested by high job separation rates prevailing in most transition economies. In addition, employers have increasingly turned to fixed-term or temporary employment contracts to facilitate workforce adjustment. Benefits were cut-off as subsidies were removed and enterprises had to become competitive in order to stay in business. The proportion of regular secure jobs has gone down, while that of casual, precarious jobs has gone up. This changing nature of job has been associated with the growth of the informal sector, which by definition provides less protected jobs with fewer benefits. On top of this, many workers who lost (or were not able to find) wage and salary employment turned into self-employment, which largely is a coping strategy as opposed to a means of securing higher earnings (Verme, 2004). Informality and self-employment are often associated with agricultural activities, especially in countries with a high share of agriculture in employment (the CIS, Poland, Romania, FYR Macedonia). Agriculture tended to act as a shock-absorber for some workers released from manufacturing, however underemployment in agriculture is substantial, and accordingly productivity is low. Subsistence farming is common. These trends are difficult to document with hard data. We will focus here on three aspects of the changing nature of employment in ECA: informal sector employment, self-employment, and irregular jobs. In the next section we will show the evolution of the industrial structure, including changes in the size of the agricultural sector. 11
  • 12. 12 Large informal sector The size of the informal sector (measured by its share in total employment) varies visibly across sub-regions within ECA, as well as across countries.3 Still, the informal sector is an important source of jobs in all sub-regions and in virtually all countries (Figure 4). For comparison, its role in ECA is much greater than in OECD countries. In CEE, for example, the informal sector contributes to GDP nearly twice as much as in OECD countries (respectively 29 and 17 percent on average in 2000). Figure 4 Informal sector employment plays an important part in all transition economies, but especially in less developed ones Employment in the Informal Sector, 1998/1999 60 50 40 30 20 10 0 Azerbaijan Kazahstan _BRU Belarus Russian Fed. Ukraine _CIS-7 + K Macedonia, FYR Moldova, Rep. of Armenia Kyrgyz Republic _SEE Bulgaria Estonia Georgia Uzbekistan _CEE Slovenia Latvia Croatia Romania Hungary Slovakia Czech Republic Poland Lithuania percent Source: Schneidr (2002), Scheider and Klingmair (2004) The size of the informal sector seems to be smaller – although not negligible – in the more advanced CEE countries, and is particularly large in low-income economies of the CIS. In CEE one in five to one in four workers work in the informal sector. In Southeastern Europe (SEE) the proportion goes up to one in three. In the CIS every third to every second worker has an informal sector job. The cross country variation is substantial. On the one end of the spectrum are the Czech Republic and Slovakia, where the informal sector accounts for around 15 percent of employment, which is close to the OECD average. The percentage is about twice as high in Bulgaria, Estonia and Latvia and reaches 40 percent in Belarus, Russia and Ukraine. At the 3 The commonly used definition of the informal sector is: “all currently unregistered economic activities which contribute to the officially calculated (or observed) Gross National Product” (Schneider, 2002). Specifically, the “shadow labor market includes all cases, where the employees or the employers, or both occupy a “shadow economy” position (ibidem). Unfortunately, Schneider (2002) does not provide details on how the estimates of the “shadow economy labor force” (presented below) were obtained.
  • 13. other end of the spectrum are Azerbaijan and Kazakhstan, where the informal sector accounts for half of the economy. There are important differences in informal sector characteristics between the European and the CIS transition economies. Apart from the differences in size, there are also differences in the underlying causes and functions of the informal sector activity (see Box 3). Box 3 The meaning of informality: European vs. CIS transition economies The informal sector has grown across all transition economies. However, the key characteristics of the sector differ between the European and the CIS transition economies at least in three main respects. First, the size of the informal sector in European economies is smaller than in CIS economies. Second, in the European transition economies workers and firms move to the informal sector mainly to evade high taxes and avoid strict regulations. In contrast, in the CIS economies the informal sector is largely an employer of last resort providing subsistence income. Small firms prefer to stay in the informal sector to avoid corruption and extortion. Third, in the European transition economies informal sector activity is often a preferred alternative to work in the formals sector, or complements work in the formal sector (e.g. moonlighting). In the CIS economies, in contrast, informal sector activity is usually a necessity reflecting lack of employment opportunities in the formal sector and is a primary source of income. In addition, the characteristics of informal sector employment differ between both groups of countries. For example, in the CIS economies most informal sector jobs are in agriculture while in the European transition economies they are frequently located in the services sector, including informal employment in registered firms. Table A summarizes these differences. Table A Informal sector in European and CIS transition economies. Stylized facts Informal sector European transition characteristics economies CIS transition economies Size Modest Large 13 Causes tax avoidance and evasion; stringent regulations in regulations lack of alternative job opportunities; corruption and extortion in the formal sector Functions preferred alternative to formal sector employment; source of secondary income employer of last resort; primary source of subsistence income Employment status self-employment; dependent employment in unregistered enterprises; informal employment in registered enterprises; self-employment; employment in family enterprises Nature of jobs regular jobs, part-time jobs, temporary jobs; second jobs agricultural, casual, occasional and seasonal jobs Obviously, the table presents highly stylized fact and in reality the differences are not so sharp. The informal sector in European transition economies shares some features of that in the CIS ones, and vice versa. The above characteristics thus highlights the dominant distinctive features while it disregards similarities.
  • 14. The importance of self-employment varies across the region Self-employment plays the most important part in the low-income CIS, where on average it accounts for 50 percent of total employment. The share of self-employment is much lower in the middle-income CIS (17 percent), and in CEE (20 percent). By way of comparison, in EU15 countries, self-employment accounts for about 15 percent of total employment. There is substantial degree of variation in the share of self-employment within regions. It is particularly pronounced in CEE (Figure 5). On the one extreme are countries such as Estonia and Slovakia, where self-employment plays a minor part, accounting for less than 10 percent of total employment. On the other extreme there are countries such as Romania, Lithuania or Poland, where self-employment plays a major role, accounting for some 30 to 40 percent of total employment. In interpreting these figures one should notice that self-employment is often agricultural employment by a different name. That is, in countries where agriculture plays an important part self-employment as a share of total employment tends to be high as farmers are as a rule counted as the self-employed. This is obviously not to deny, that self-employment plays an important part outside agriculture. In addition, cross-country and time comparisons may be obscured by the fact that in some cases there is little difference between dependent wage employment and self-employment. For example in Bulgaria and Poland some health care sector employees were turned into independence, self-employed contractors. This obviously inflated the number of the self-employed, although there was no corresponding change in the nature of jobs. These measurement problems notwithstanding, there is little doubt that self-employment gained in prominence in transition economies and often accounts for a considerable fraction of jobs. Figure 5 Self-employment plays a critical role in CIS-7 and a negligible one in BRU whereas CEE countries are between these two extremes Self-employment, 2002 as percentage of total employment _CEE Latvia 14 80.0 70.0 60.0 50.0 40.0 30.0 20.0 10.0 0.0 Kyrgiz R. Azerbaijan Georgia Armenia Moldova Romania _CIS-7 Tajikistan Lithuania Poland Uzbekistan Slovenia Czech R. EU15 Hungary _BRU Estonia Ukraine Slovak R. Russia Belarus percent Source: Eurostat, CIS-stat (2003)
  • 15. What are the reasons behind this development? On the one hand people are pushed into self-employment by lack of work opportunities. In such a case self-employment is the only available means of earning subsistence income. Also sometimes employers force workers into self-employment as a means lowering hiring and firing costs, as in the above example of health care sector reform in Bulgaria and Poland. In this case self-employment is a forced choice reflecting the lack of a gainful alternative. On the other hand people can be pulled into self-employment if the expected benefits, mainly earnings, exceed than those of wage employment. Self-employment in this case is a voluntary welfare-maximizing choice among different alternatives. In such a case self-employment often becomes a springboard for firm creation. In reality self-employed workers comprise of both categories: aspiring entrepreneurs and subsistence workers for whom unemployment is not a viable alternative (Box 4). However, there is some evidence that in ECA the push factors tend to prevail, and the majority of self-employed resort to self-employment to avoid unemployment and earn subsistence income (Earle and Sakova, 2000; Verme, 2004). The recourse to subsistence agriculture (as it has happened in Poland, Romania, FYR Macedonia and in the most of CIS) is the point in case. Thus, the evidence does not support the optimistic view that the rise in self-employment reflects the development of entrepreneurship and new business opportunities. To a large extent it reflects difficult labor market conditions and lack of work opportunities. Box 4 Self-employment: a springboard for firm creation, or a coping strategy? Is the growth in self-employment observed in transition economies a positive phenomenon? On the one hand it is an indication of a developing entrepreneurial spirit, and a springboard to starting a small business. Self employment can be a source of an “entrepreneurship premium” and as such offer better than normal earning opportunities. On the other hand, the growth in self-employment may be a symptom of a depressed labor market, where firms create few jobs, and employment opportunities are scarce. It can be associated with low value-added activates, which barely provide substance income. So, the assessment depends on the distribution of productivity and earnings associated with self-employment jobs (relative to that of dependent employment). At the same time, self-employment needs to be assessed against the counterfactual, which is either lower earnings or no earnings whatsoever. From such a perspective, self-employment is unambiguously a welfare enhancing economic activity. For example, in Albania or in Georgia the self-employed account for a large proportion of the poor, and thus self-employment is a copying strategy, a means of earning subsistence income. In contrast, in more developed countries, such as Estonia or Hungary, the incidence of poverty among the self-employed is negligible. In this context self employment is likely to be a gainful entrepreneurial activity 15 (World Bank, 2000). Rising incidence of irregular jobs? The nature of dependent wage employment has been also changing. Before the transition employment meant full time permanent labor contract. At present, fixed-term and part-time jobs account for a significant part of total formal sector employment in transition economies. On average, fixed term jobs share in total employment exceeds 7 percent, and that of part-time jobs is another 7 percent (Table 3). In both cases, there is visible cross-country variation. The incidence of fixed-term contracts ranges from less than 3 percent in Estonia to over 15 percent in Poland. For comparison, the EU15 average is 13 percent. As to part-time jobs, their incidence
  • 16. ranges from less than 3 percent in Bulgaria to over 10 percent in Latvia, Poland and Romania. It is noteworthy, that the incidence of part-time jobs in CEE is substantially below the EU15 average of 18 percent. Table 3 Flexible jobs in CEE are less prevalent than in EU 16 Self-employed Fixed term contracts Part-time employment Bulgaria - 5.3 2.5 Czech R. 16.0 8.1 4.9 Estonia 8.1 2.7 7.7 Hungary 13.7 7.3 3.6 Latvia a) 16.9 6.7 11.3 Lithuania b) 30.5 6.3 9.7 Poland 28.1 15.4 10.8 Romania 40.2 1.0 11.8 Slovak R. 8.6 4.9 1.9 Slovenia 16.0 14.2 6.1 CEE 19.8 7.2 7.0 EU15 14.6 13.0 18.1 - Data not available a) 2000 b) 2001 Source: Eurostat Although the incidence of irregular jobs has risen in transition economies, it is still low in the comparative perspective. However, one should bear in mind, that the comparison is limited to the formal sector, while the majority of casual and temporary jobs are in the informal sector. Given that the size of the informal sector is much larger in transition economies than in the EU, the actual incidence of irregular or casual jobs is likely to be correspondingly higher, too. The growing use of fixed-term contracts is a means to lower employment adjustment costs if terminating a permanent employment contract is difficult or costly. Thus, their incidence can be expected to be higher in countries where firing costs are high, although restrictions on their use may hamper this tendency. Croatia and Slovenia, countries where the employment protection legislation is particularly stringent are the cases in point. To conclude, it is not only the number of jobs but their “quality”, including earnings, that matter. The relevant question is not only the standard one “How many jobs”, but also one that is often overlooked, which is “What kind of jobs”. There is limited but rather plausible evidence that there has been a switch from stable regular jobs towards temporary, casual and precarious jobs, partly in the formal sector, but largely in the informal one. Inter-sectoral shifts and the changing structure of employment Economic transition in ECA by its very nature has been associated with the reallocation of labor and jobs across economic sectors. One part of this process has been a shift of resources, including labor, from the public to the private sector. Another part – which is the focus of this section -- has been the movements of labor across industries. Reallocation of labor across industries was meant to redress the misallocation of resources inherited from the previous economic regime. Under central planning industry was overdeveloped while the service sector was underdeveloped. Thus, one would expect, that transition will lead to the increase in the
  • 17. relative size of the services sector and a simultaneous decrease in the size of the industry (manufacturing) sector. That is what has indeed happened, although the patterns vary across sub-regions. In European transition economies the service sector has expanded at the expense of the agriculture sector and to somewhat lesser extent at the expense of the manufacturing sector.4 In Belarus, Russia and Ukraine the services sector has expanded largely at the expense of the manufacturing sector, while the fall in the share of the agricultural sector was less pronounced. In other CIS the direction of structural change has been different. In contrast to European transition economies, the share of agriculture has significantly increased in virtually all low-income CIS countries. As elsewhere, the manufacturing sector has diminished, however the 17 service sector has hardly expanded. Estonia provides perhaps the most dramatic example of the change in the employment structure. The market services sector expanded by 14 percentage points from 1990 through 2002, while agriculture and manufacturing contracted by 14 and 5 percentage points, respectively. In Poland changes were less dramatic but more typical of European transition economies. Market services as a share of total employment went up by 7 percentage points, whereas agriculture dropped by 5 percentage points and manufacturing by 4 percentage points (from 1994 through 2002). In Russia de-industrialization was more pronounced, as the share of manufacturing decreased by as much as 12 percentage points, however market services expanded at a slower pace, their share increasing by mere 2 percentage points (from 1990 through 1999). The example of Azerbaijan is quite typical of the low-income CIS. The share of agriculture increased by some 4 percentage points (form 1990 through 2002). So, did the share of market services, which went up by 5 percentage points. At the same time, the share of manufacturing dropped dramatically by 13 percentage points.5 Transition economies differ substantially as regards the sectoral structure of employment. In CEE the economy is dominated in equal measure by manufacturing and market services (jointly about 60 percent of all jobs). Public services (health, education, administration, etc.) provide additional 25 percent of jobs. The share of agriculture is relatively small (15 percent). Outliers in this group are Bulgaria and Romania, where the share of agriculture is well above the average for the group. If the group is limited to current EU member transition economies, then the share of agriculture is correspondingly lower, and that of manufacturing is higher. In Belarus, Russia and Ukraine relatively more jobs are provided by agriculture and public services at the cost of significantly smaller market services sector. Belarus, Russia and Ukraine apparently move towards similar sectoral employment structure as CEE, however the pace of structural changes is slower and thus the economic structure seems “less advanced”. In the other CIS countries the employment structure looks dramatically different. It is heavily dominated by agriculture, which accounts for close to half of total employment. The manufacturing sector tends to be small, providing on average less than 15 percent of all jobs. The market services sector is also substantially smaller than in other ECA sub-regions, accounting for less than 20 percent of all jobs. Only the share of public services (which is the least varying component of the employment structure) is comparable to that in other ECA transition economies. 4 This does not necessarily imply that labor has moved directly from agriculture to services. An alternative scenario is also possible that agricultural labor moved to manufacturing and manufacturing labor moved to services. Data which would allow one to discriminate between those two scenarios is absent. 5 These figures come from an employer based survey, and thus probably underestimate the growth in the employment share of the services and agriculture sectors.
  • 18. Changes in employment structure are important in at least two ways. First, they tend to have far reaching labor market ramifications. Reallocation of labor across industries and sectors entails also reallocation across occupations and regions and as such is likely to give rise to structural mismatches. Jobs that are created in expanding industries usually require different skills and are located in different regions than jobs that are destroyed in declining industries. Particularly, the shift from industry to market services has been associated with a shift from blue-collar jobs to white-collar jobs requiring different skills. This imposes transition costs (in terms of time and effort) on workers who move from old to new jobs. Moreover, massive job and worker reallocation contributes to frictional and structural unemployment (when the skill and vocational structure of job openings differs from that of the unemployment). Accordingly it partially accounts for he high unemployment rates associated with the economic transition. Second, the employment structure is an indicator of the level of economic development as well as the progress of the transition. In the particular case of transition economies, the share of market services, which was abnormally small before the transition, is a measure of successful labor reallocation. Figure 6 provides a ranking of ECA countries on this scale, indicating the progress of the transition toward a mature market economy. Figure 6 Market services account for a much larger share of employment in European transition economies than in the CIS. Market Services as a Percentage of Total Employment, 2002 18 40.0 35.0 30.0 25.0 20.0 15.0 10.0 5.0 0.0 Croatia Czech R. Estonia Hungary Latvia Slovenia Slovakia Bulgaria Lithuania Kazahstan _CEE Poland Russia Ukraine Azerbaijan _BRU Georgia _CIS-7 + K Moldova Romania Belarus Kyrgyzstan Uzbekistan Tajikistan percent Source: ILO LABORSTA database (LFS data) The employment share of market services is the highest in fast reforming and most advanced transition economies, such as Estonia, Hungary, and the Czech Republic (above 30 percent), and is the lowest in slow reforming and less advanced economies, such as Belarus and most of the low-income CIS countries (below 20 percent).
  • 19. II. KEY FEATURES OF UNEMPLOYMENT IN TRANSITION ECONOMIES The unemployment rate is customarily used as a key indicator of labor market conditions. There are important reasons for this. First, the unemployment rate is an indicator of the overall health of the economy. High and persistent unemployment usually points to unresolved structural problems. Second, unemployment is very costly from both the individual and the social perspective. Job loss is associated with the loss of income, and often leads to poverty. Prolonged unemployment leads to the erosion of skills and morale, and often to social marginalization. To help the unemployed cope with joblessness the state provides income support and services intended to place the unemployment back to jobs. Such programs are costly and increase the burden of taxation. Finally, high unemployment can be costly politically, as in voters’ opinion the government is responsible for ensuring job opportunities and good employment prospects. Thus high and rising unemployment poses a significant political risk for the ruling parties. Open unemployment in European transition economies and hidden unemployment in the CIS The transition shock has led to underutilization of labor in virtually all transition economies. But the underutilization of labor has taken different forms depending on the speed of market oriented reforms. Rapid enterprise restructuring has led to the growth in open unemployment. In contrast, the gradual approach to restructuring resulted in hidden unemployment (underemployment or low-productivity employment). In Central and Eastern Europe unemployment was virtually nonexistent under central planning, but has risen sharply already at the early stage of the transition. This was an unavoidable and expected process, since some degree of unemployment (the so called “natural” unemployment rate) is characteristic of a market economy. Frictional unemployment is a natural product of workers moving across jobs in search of better worker-job matches and associated higher earnings. However, the rise in unemployment at the early stage of the transition had additional sources. First, the substantial drop in output translated into lower labor demand and gave rise to demand deficiency unemployment. Second, as mentioned earlier, massive labor and job reallocation associated with economic restructuring engendered structural mismatches which contributed to structural unemployment. Finally, enterprises which become subject to competitive pressure had to cut cost in order to remain profitable. Accordingly, they started to shed redundant labor and eliminate overstaffing typical of state owned firms. These factors caused unemployment in most CEE economies to peak 4-5 years after the beginning of market oriented reforms. The CEE average unemployment rate reached about 12 percent in the peak period 1994-95 and started do go down since then until 1998 when it reached the through of 10 percent (Figure 7). In 1999 unemployment in the region rose again in response to the Russian crisis and global financial turmoil, and the second peak occurred in 2001. While the initial increase in unemployment was caused by factors specific to the transition, the increase in the wake of the Russian crisis was mainly of cyclical nature. In Southeastern Europe (which is largely former Yugoslavia) unemployment existed even before the transition. In this case the transition shock (as well as the regional war) led to an increase in the unemployment rate to levels still higher than those in CEE. For example in FYR Macedonia the unemployment rate is about 30 percent and in Croatia it is close to 20 percent. The unemployment rate has also been gradually rising in Serbia and Montenegro, which have started the market oriented reforms later than other countries in the region. 19
  • 20. Figure 7 Unemployment fluctuates with changes in business conditions, but remains high in CEE countries Unemployment Rate, 1992-2002 20 CEE 25.0 20.0 15.0 10.0 5.0 0.0 1992 1993 1994 1995 1996 1997 1998 1999 2000 2001 2002 percent Source: ILO LABORSTA database (LFS data) Czech R. Bulgaria Estonia Hungary Latvia Lithuania Poland Romania Slovakia Slovenia In Russia and Ukraine the evolution of unemployment has been somewhat different from that in CEE. Unemployment reached its peak later, only in 1998 (i.e. four years later than in CEE). This is likely to reflect delayed restructuring and initially heavier reliance on wage adjustment (as opposed to employment adjustment) in response to the negative output shock. Since 1999 unemployment in both Russia and Ukraine has begun to decline. Again, it is too early to tell whether or not this decline represents a transitory movement, or a movement toward the equilibrium unemployment rate. Unemployment in Russia and Ukraine coincides with significant underemployment among workers in unrestructured firms or workers employed in the large informal sector. This is a still bigger problem in other CIS countries. In the low-income CIS countries unemployment has also increased, but the problem is not so much open unemployment as underemployment. It takes the form of employment in subsistence agriculture, irregular or casual employment in the informal sector (e.g. petty trade), or employment in unprofitable and unviable enterprises, which often are not even able to pay wages. Underemployment is closely associated with low productivity and thus translates into lower output and social welfare, similarly as does unemployment. In a way, underemployment is a mirror image of unemployment in societies where people cannot afford to be unemployed, because there is no effective social safety net in place.
  • 21. Unemployment rates vary strongly across the region but are generally high The unemployment rates are on average higher in European transition economies than in the CIS. In the CIS the LFS/ILO unemployment rate hovers around 10 percent showing relatively little cross-country variation. In contrast, in CEE the average unemployment rate was 12 percent in 2002, with visible intra-regional variation. The average unemployment rate in SEE is still higher (20 percent if FYR Macedonia is included, 14 percent if it is not.). Overall, unemployment in transition economies is relatively high, significantly above the average of the OECD ( about 7 percents). In low unemployment CEE countries the unemployment rate is still significantly higher than in low unemployment EU15 economies. For example, the unemployment rate in the Czech Republic (7.3 percent in 2002) is significantly above that in Denmark and Ireland or the U.K. (about 5 percent). This discrepancy between the level of unemployment in transition economies, which still undergo industrial restructuring and are more exposed to shocks, and market economies with flexible labor markets is obviously not surprising. The point is that currently unemployment in transition economies is probably above its long-run equilibrium level, provided that the OECD is an adequate benchmark. Despite the apparently similar initial conditions and similar experience of the transition, the unemployment rates vary strongly across transition economies. For example in Poland the unemployment rate was over 3 times higher than in Hungary (20 percent against 6 percent in 2002). In Slovakia the unemployment rate is 2.5 times as high as in the Czech Republic (19 percent against 7 percent). Even stronger differentiation of labor market conditions exists among countries of former Yugoslavia. The unemployment rate in FYR Macedonia is over 5 times as high as in Slovenia, and in Croatia the rate is 2.5 times as high as in Slovenia. Figure 8 illustrates this huge dispersion in unemployment rates in ECA. Figure 8 Unemployment rates vary strongly across transition economies Unemployment rate, 2002 21 35 30 25 20 percent 15 10 5 0 Macedonia, FYR _SEE Poland Bulgaria Slovakia BIH Croatia Lithuania Serbia and Montenegro Georgia Latvia _CEE Estonia Russia Romania Ukraine _EU15 Czech Republic Slovenia _OECD Moldova Hungary Source: ILO LABORSTA database (LFS data)
  • 22. Inflows into unemployment are high while outflows are limited The level of unemployment depends on the probability of becoming unemployed, and on the expected duration of the unemployment spell. The latter in turn depends on the probability of escaping unemployment. Accordingly, the level and the durational structure of unemployment vary depending on the relationship between the inflow rate and the expected duration of unemployment (probability of escaping unemployment). In a simple way this relationship is depicted in Table 4. Table 4 Labor flows and unemployment Outflows from unemployment • unemployment to jobs • unemployment to inactivity 22 Inflows into unemployment • employment to unemployment • inactivity to unemployment High: dynamic labor market Low: stagnant labor market High moderate unemployment high unemployment Low Low unemployment moderate unemployment Unemployment can have different durational structure. For example, in a dynamic labor market the risk of losing a job may be high, but so is are the chances of finding a new one. Accordingly the expected duration of unemployment will be short, which will result in a “moderate” unemployment rate (or low unemployment rate if inflows into unemployment are low). An opposite example is that of a stagnant labor market. In such a market the risk of losing a job may be low, but the prospects of finding a new one are poor. The expected duration of unemployment spells will be long and level unemployment will be elevated despite low inflows into joblessness. If inflows into joblessness increase (e.g. due to economic downturn, restructuring, or demographical pressures), unemployment will reach a high level. A typical example of a flexible, dynamic labor market is the U.S. Indeed, 66 percent of the unemployed find a job within a year (Boeri and Terrel, 2002). The median duration of unemployment fluctuates around 10 weeks and correspondingly the incidence of long term unemployment is very low (less than 10 percent). Labor markets in transition economies are in sharp contrast to the dynamic labor market, such as the US.6 Expectedly, flows from employment to unemployment are higher, as transition economies undergo rapid restructuring, which be its very nature is associated with a high rate of job destruction. For example, the flows from employment to jobs in Poland or Russia in the mid 1990 were roughly twice those in the US. However, the outflow rate from unemployment to jobs is also much lower in the transition economies than in the U.S., showing that the rate of job creation is too low to absorb the accumulated unemployment pool. The chance that a worker finds a job within a year after entering unemployment is in virtually all transition economies substantially smaller that in the US. Roughly speaking, the probability that an unemployed persons find a job is in transition economies half that in the US. Thus, all else being equal, if the outflow rate from unemployment to jobs in Poland, say, were the same as in the US then the 6 Data on labor flows is available for CEE countries and Russia but not for other CIS countries.
  • 23. Polish unemployment rate would be by about one-fourth lower.7 Some examples of the differences in flows into and out of unemployment are shown in Table 5. Table 5. Jobless workers in transition economies face low chances of escaping unemployment 23 Country Year Employment to Unemployme nt Employment to Out of the Labor Force Unemployme nt to Employment Unemployment to Out of the Labor Force Out of the Labor Force to Employment Out of the Labor Force to Unemployme nt Central and Eastern European Countries Bulgaria 1994-1995 0.059 0.092 0.323 0.244 0.092 0.044 Czech. R 1994-1995 0.013 0.028 0.496 0.129 0.042 0.012 Czech. R 1996-1997 0.08 0.025 0.457 0.101 0.04 0.008 Czech. R 1998-1999 0.018 0.025 0.335 0.09 0.036 0.017 Poland 1992-1993 0.04 0.076 0.361 0.158 0.095 0.045 Poland 1993-1994 0.04 0.063 0.354 0.159 0.074 0.043 Slovakia 1994-1995 0.023 0.045 0.237 0.078 0.018 0.017 Former Soviet Union Estonia 1992 0.048 0.097 0.465 0.093 0.143 0.036 Estonia 1997 0.047 0.04 0.372 0.064 0.074 0.038 Russia 1992-1993 0.032 0.058 0.52 0.157 0.087 0.014 Russia 1995-1996 0.056 0.062 0.395 0.145 0.076 0.034 United States 1992-1993 0.028 0.053 0.659 0.288 0.043 0.161 Source: Boeri and Terrel (2002) Data in Table 5 suggest that initially high unemployment in transition economies was the product of relatively high inflows into unemployment and limited outflows to jobs. Most of the economies were thus in the high unemployment/depressed (stagnant) labor market state. As the restructuring process slowed down with the progress of the transition, the initially high inflow rates gradually declined, although they still remain higher than in a mature market economy, such as the US. This entailed a movement toward the moderate unemployment/stagnant labor market state, as the job finding chances hardly improved and thus the duration of unemployment remained high. At this stage unemployment is a stagnant pool: few workers enter unemployment but also few are able to exit it. Recent examples of a substantial fall in unemployment in some CEE countries (e.g. Lithuania) suggest that these successful countries might have begun a movement toward moderate unemployment/dynamic labor market and eventually. It is obviously an open question if the movement will continue toward the low unemployment/dynamic labor market state. 7 Outflows from unemployment to jobs account for about two-thirds of all outflows from unemployment (the other being to inactivity), so doubling the outflows to jobs rate (holding the outflows to inactivity rate constant) results in shortening of the average duration of unemployment and thus lowering the unemployment rate by one-fourth.
  • 24. 24 Long duration of unemployment Poor employment opportunities along with skill and location mismatches lead to long duration of unemployment, which is the mirror image of low exit rates from unemployment, which prevail in transition economies. As a result, transition economies have seen the growth in the incidence of long-term unemployment. Presently the long term unemployment in CEE accounts for over 50 percent of total unemployment, which is much more than in EU, where it accounts for 40 percent. (Figure 9). After all, in the flexible, well performing EU labor markets the incidence of long-term unemployment at around 25 percent is still much lower. It is noteworthy, that in every EU transition economy the incidence of long-term unemployment is higher than the already high EU average. In Latvia, where long term unemployment is the least prevalent among European transition countries, it still accounts for 45 of total unemployment. Bulgaria is an extreme case, with two-thirds of all the unemployed suffering from long-term joblessness. Figure 9: Long-term unemployment looms large in all European transition economies Long-term unemployment, 2002 as percentage of total unemployment 90 80 70 60 50 40 30 20 10 0 OECD EU Hungary Latvia Czech R. Poland Romania Estonia Lithuania Croatia Slovenia Bulgaria Serbia and Montenegro Slovakia FYR Macedonia percent Source: Eurostat, OECD (2003) and national Statistcal Offices; Bank staff calculations. The problem of long duration of unemployment is even more severe in the Southeastern transition economies, such as Croatia and FYR Macedonia, where stringent employment protection legislation has for long discouraged employers from hiring. This has led to the accumulation of a large pool of workers who find it extremely difficult to enter or re-enter the labor market (World Bank, 2003c; Rutkowski, 2003c). To conclude, the high incidence of long-term unemployment in most transition economies points to a depressed, stagnant labor markets and possibly to structural mismatches. Once unemployed, people have little chances to find new employment. Long duration of
  • 25. unemployment spells is associated with high individual and social costs. It tends to cause the erosion of human capital, and often leads to poverty and social exclusion. Accordingly it is the high long-term unemployment rates prevailing in ECA transition economies which are of particular policy concern. High unemployment among less skilled workers Unemployment in the European transition economies is heavily concentrated among less educated workers. Generally, the unemployment rate is the higher, the lower is the educational level (Table 6). Unemployment rates among workers with primary and lower secondary education tend to be extremely high, usually well above 20 percent. They are significantly lower – although often still high -- for workers with upper secondary education, on average around 13 percent. The unemployment rate drops dramatically to 4 percent for workers with university education (the CEE average). It is noteworthy that the unemployment rate for university educated workers tends to be low even in high unemployment countries, such as Bulgaria (8.5 percent) or Poland (5.6 percent), suggesting that the fall in labor demand has been biased against the less skilled workers. A notable exception is FYR Macedonia, where the unemployment rate is very high even among workers with tertiary education (16.6 percent), although still half the overall unemployment rate. This exception notwithstanding, university education seems to be the best protection against unemployment in the European transition economies. Unfortunately, lack of relevant data makes it impossible to ascertain whether or not this result holds also for other ECA countries. Table 6 Unemployment hits less educated workers particularly strong 25 Less than upper secondary Upper secondary Tertiary CEE Bulgaria 33.1 19.4 8.8 Czech Republic 21.5 7.1 2.5 Estonia 18.6 13.3 8.0 Hungary 11.2 5.2 1.2 Latvia 21.0 13.0 5.5 Lithuania 23.1 21.7 10.1 Poland 23.9 19.4 5.6 Romania 4.0 8.6 3.9 Slovakia 42.5 18.7 5.2 Slovenia 8.9 5.5 2.3 SEE Croatia a) 13.7 16.7 7.6 Macedonia, FYR - - - Serbia and Montenegro a) 24.9 19.7 9.5 - Data not available Note: Labor Force Survey data a) 2002 Source: CEE: Eurostat Croatia: Central Bureau of Statistics, Labour Force Survey 2002 (second half), Bank staff calculations. Serbia and Montenegro: Republic of Serbia, Republican Statistical Office, Labor Force Survey 2002 (October), Bank staff calculations
  • 26. Although workers with primary education face a high risk of unemployment, they ere not numerous in most European transition economies, where most of the labor force has at least lower secondary education. Given their high share in the labor force and the relatively high unemployment rate among this group, it is workers with secondary education which are preponderant among the unemployed. Less skilled workers have lower chances to find work, and accordingly face longer unemployment spells. As a result, they are disproportionately represented among the long-term unemployed. For example, in Poland workers with less than upper secondary education accounted for 60 percent of short term unemployment, and 65 percent of long-term unemployment (2002 data). Disproportionately high unemployment among less skilled workers is a common phenomenon in developed countries, and transition economies are no exception in this regard. These high unemployment rates are explained by technological change which tends to be biased against less skilled manual labor. At the same time, new generations of capital require higher skills, which explains demand for well educated workers. A more in depth analysis of the changing demand for skills in transition economies is provided in Commander and Kollo (2004). High youth unemployment An issue of particular concern in transition economies is high youth unemployment. Indeed young workers (15-24) face the risk of unemployment much higher than that faced by older workers. In most cases the youth unemployment rate is about twice as high as the overall unemployment rate (Table 7). However, relatively high youth unemployment rates are typical of all developed countries. In EU/OECD countries the ratio of the youth unemployment rate to the overall unemployment rate is virtually the same as in transition economies. What distinguishes transition economies from OECD economies is high absolute youth unemployment rates, rather than high relative rates. 26
  • 27. Table 7 Unemployment rates are particularly high among young workers 27 Youth unemployment as % of labor force 15- 24 Youth unemployment rate/overall unemployment rate CEE Bulgaria 35.5 2.0 Czech R. 16.9 2.3 Estonia 17.7 1.9 Hungary 11.9 2.1 Latvia 24.6 1.9 Lithuania 21.4 1.6 Poland 41.7 2.1 Romania 18.5 2.6 Slovakia 37.3 2.0 Slovenia 15.3 2.6 Turkey 17.8 1.6 SEE Croatia 34.5 2.4 Serbia and Montenegro a) 58.0 3.1 Memorandum EU15 14.7 1.9 OECD Europe 17.6 2.0 Total OECD 13.1 1.9 Note: Labor Force Survey data a) The unemployed include persons who in the reference period did a temporary job Source: CEE and EU: Eurostat Turkey and OECD: Employment Outlook, OECD Croatia: Central Bureau of Statistics, Labour Force Survey 2002 (second half), Bank staff calculations. Serbia and Montenegro: Republic of Serbia, Republican Statistical Office, Labor Force Survey 2002 (October), Bank staff calculations For example, in Poland youth unemployment rate is above 40 percent. In Bulgaria and Slovakia it is between 35 and 37 percent. On average, the youth unemployment rate in CEE is close to 25 percent. This is almost twice as high as the average youth unemployment rate for the OECD countries. Unemployment rates of such magnitude are likely lead to social tension. The disproportionately high youth unemployment rates largely reflect higher levels of labor turnover among young workers, who tend to change jobs more often than older workers, presumably looking for the best worker-job match. However, they may also be associated with labor market rigidities and barriers created by stringent employment protection legislation, which favors insiders (workers with secure jobs) at the cost of outsiders (the unemployed, contingent workers). For example, an extremely high fraction of young labor market entrants among the unemployed in FYR Macedonia can be at least partly attributed to high degree of job protection granted to incumbent workers (World Bank, 1998). Another possible source of high youth unemployment is the minimum wage set at above market clearing level. For example, in economically depressed, high unemployment regions of Poland the minimum wage accounted
  • 28. for over 80 percent of the going wage rate for low skilled workers. Given that many young workers lack labor market experience and skills, they are likely to be negatively affected by high minimum wages (World Bank, 2001; Kertesi and Kollo, 2003; Rutkowski 2003a,). These considerations led the Polish government to introduce a youth sub minimum wage accounting for 80 percent of the adult minimum wage in 2002. Youth unemployment matters because evidence shows that it is often associated with poverty. A priori this is not an obvious result, as it may be the case that young people looking for work are predominantly secondary earners in relatively well-to-do families, who just want to earn additional income. However, in many transition economies the unemployed youth live in poverty. For example, in Macedonia and Bulgaria the incidence of poverty among the unemployed youth is significantly higher than the average (World Bank 1999; Rutkowski, 1999),. In this case the likely reason is that young people in poor families cannot afford to be out of the labor force. Low family income forces people to enter the labor market at a relatively young age. As long as young people are searching for jobs they are counted as the unemployed, and in this sense poverty gives rise to youth unemployment. Obviously, prolonged and unsuccessful job search by young family members can also contribute to poverty. Either way, youth unemployment has significant negative poverty effects. The issue of youth unemployment in SEE is explored in more detail in Kolev and Saget (2003). Large and persistent regional disparities in labor market conditions There are substantial disparities in labor market conditions in most ECA countries. Most regions are economically depressed with high unemployment rates, often coupled with low labor force participation rates (in large part due to the “discouraged worker” effect) and, consequently, low employment rates. In these regions the job creation and hiring rates are low, severely limiting the chances to escape unemployment. At the same time, in a small number of expanding regions unemployment is relatively low, the job creation rate is high, and employment opportunities are plentiful. Table 8 illustrates a particular dimension of regional labor market imbalances: differences in the unemployment and employment rates. The dispersion in unemployment rates in the six European transition economies in the sample is substantial. The unemployment rate in the highest unemployment region is in most cases at least twice as high as in the lowest unemployment region (with Poland being an exception).8 For example, in Bulgaria the unemployment rate in north-west region is 32 percent, compared with 16 percent in the south-western region (see Annex Table A1). The differentials increase with the level of regional dis-aggregation, i.e. when the analysis concerns a larger number of smaller regions. Particularly, if the capital region is shown separately then the disparity between the highest and the lowest unemployment region becomes even more pronounced. For example, the unemployment rate in the highest unemployment region of Slovakia is almost tree times as high as in the capital region (24.5 percent and 8.5 percent, respectively). Regional unemployment inequality reflects strong regional concentration of job creation and employment growth. Often it is only a few regions which create jobs on a net basis (that is where the job creation rates exceeds the job destruction rate) and where the jobless face good 8 The degree of regional variation of unemployment rates is influenced by the size of the regions (in general, the larger are the regional units, the lesser the variation). Thus the variation of unemployment rates is not comparable across countries, as regions differ in size. Nevertheless, the comparison gives a rough idea of the regional disparities in labor market conditions. 28
  • 29. employment prospects. In most regions the rate of job destruction still exceeds that of job creation implying net employment loss. If the number of jobs declines, chances to escape unemployment are poor. For example, in Bulgaria it is only the capital region, where employment expands (Rutkowski, 2003b). In Croatia employment grows only in 4 out of 21 regions, and in Poland in 3 out 16 regions (Rutkowski 2003c; World Bank 2001). So employment creation in regions of high unemployment has not picked up. Regional labor market disparities are not specific to transition countries and occur also in developed market economies. However two factors are specific to European transition economies. First, most transition countries (including Russia) display a degree of variation in unemployment rates generally higher than most Western European countries, let alone the USA. For example, the coefficient of variation of unemployment for France and the USA is roughly half that for the Czech Republic and one third that for Hungary (Boeri and Scarpetta, 1996; Bornhorst and Commander, 2004). These large differences in regional unemployment rates are associated with strong concentration of net job creation in few relatively economically vibrant regions and the dominance of job destruction in most other, economically depressed, regions. Second, labor market imbalances tend to be highly persistent in transition economies. The ranking of regions by the unemployment rate hardly changes over time. High unemployment regions at the early stage of the transition tend to remain relatively high unemployment regions today. This points to the weakness of equilibrating mechanisms, such as wage adjustment or inter-regional labor mobility to accommodate region specific shocks and lower regional imbalances (Boeri and Scarpetta, 1996; Fidrmuc, 2003, Huber, 2003a; Bornhorst and Commander, 2004). Why are regional unemployment disparities so large in transition economies? There two factors at work. First, large region specific shocks to product and consequently labor demand. A study of regional unemployment in Poland found that higher unemployment regions are those experiencing greater change in industrial structure. Moreover, high unemployment regions are those with higher inflow rates to unemployment rather than longer spells of unemployment. These findings suggest that regional unemployment varies importantly with job destruction in Poland and thus region specific labor demand shocks (Newell, 2000). Second, underlying structural factors, which determine regions’ growth potential. These structural factors include sectoral and industrial structure, the degree of urbanization, the development of the infrastructure, and last but not least, human capital endowment. As regions in transition economies differ substantially with respect to their economic structure, these differences translate into differences in labor market conditions. Generally, regions which fare best in terms of job creation and employment prospects are urbanized (especially those with large agglomerations), with a large service sector, with developed infrastructure (both traditional and modern, such as telecommunication networks), and with well educated, skilled workforce. In contrast, regions which fare worst in terms of labor market conditions are industrial regions with obsolete, non-competitive, declining industries (especially heavy industries, such as steel or mining). The performance of agricultural regions is mixed. Agriculture is often an employer of last resort and thus open unemployment in agricultural regions is relatively low, but underemployment is considerable. The issue of factors accounting for regional unemployment inequalities and the typology of regions with respect of their labor market performance is analyzed in more depth in Huber and Scarpetta (1995), Scarpetta (1995), Rutkowski and Przybyla (2002), and Huber (2003b). How to improve the employment prospects in high unemployment regions? European experience demonstrates that labor mobility and wage flexibility by itself play only a modest role 29
  • 30. and are insufficient to visibly lessen regional imbalances. The key to economic growth and thus better labor market conditions in depressed regions is investment and the consequent job creation. Thus, the challenge facing depressed regions is to attract investment, which requires creating incentives for firm entry, developing infrastructure, and investments in human capital to improve labor productivity. To conclude, there are large regional unemployment disparities in transition economies, driven by region specific labor demand shocks as well as by regions’ structural characteristics. Particularly, the response to these idiosyncratic shocks depends on structural factors, such as the sectoral structure, presence of strong urban centers, the skill composition of the labor force, and the development of the infrastructure. Regional unemployment inequalities tend to be persistent, pointing to the weakness of equilibrating mechanisms, such as wage adjustments and labor mobility. However, they may also reflect regional differences in steady-state unemployment levels. To overcome these disparities depressed regions need to be turned into attractive locations for private firms to invest and create jobs. This in turn requires public investments in infrastructure and human capital. III. WAGE DEVELOPMENTS Economic transition has been associated with profound changes in the wage level and structure (relative wages). Changes in the wage level represented a response to the changing level of output and productivity. Changes in the wage structure reflected changes in the wage setting mechanism (from bureaucratic and centralized one to a market based and decentralized one) as well as changes in the relative demand for and supply of different types of labor. A direct consequence the changes in the wage structure has been an increase in wage inequality. In the ensuing part of this section we analyze these developments in turn. Real wages have been growing in all transition economies since the mid 1990s After an initial sharp drop in the early 1990s, real wages in virtually all transition economies have been growing at a pretty high rate since the mid 1990s, following gains in labor productivity. 9 However, the pattern of wage adjustment has differed considerably across ECA sub-regions. Generally, the wage drop has been much deeper in the CIS than in CEE. While in the CIS real wages are currently at around 50 percent of their pre-transition level, they close to it in CEE (Figure 10). After all in a few CEE countries wages are already higher than before the transition. Coupled with the earlier analysis of employment dynamics, these data suggest that while in CEE the brunt of adjustment to the transition shock was borne by employment, in the CIS it was borne by wages. 9 In most transition economies real wages are still lower than before the transition, but this result needs to be treated with caution. The actual real wages decline was most probably much less then the measured one This is due to the fact that the pre-transition level of real wages was overestimated in most of the transition economies. This overestimation resulted from prices being set at below-the equilibrium level, as attested by pervasive consumer good shortages. If prices were set so as to equate the demand for and the supply of goods, as it is the case in a market economy, then real wages before the transition would be correspondingly lower. In other words, real wages before the transition were often not quite “real” in terms of consumer purchasing power. If this factor were taken into account, the reported wage drop would be much less, although the degree of the correction varies by country. In addition, wage data are likely to be affected by wage arrears and non-payment of wages, a problem particularly pronounced in CIS (particularly at the early stage of the transition). Finally, a widespread practice of underreporting of wages to avoid tax payments also means that the actual wage growth during the transition is likely to be underestimated. 30
  • 31. Figure 10 Real wages rebounded in the mid-1990s Real Wage Growth 31 150.0 100.0 50.0 0.0 -50.0 -100.0 EU member TE EU accession TE Russia and Ukraine CIS-7 percent Source: UNICEF TransMONEE database; Bank staff calculations 1989-1995 1995-2001 1989-2001 Individual country experiences regarding wage dynamics vary strongly across the region (Figure 11). Among CEE, wages in the Czech Republic and Poland are almost 20 percent higher than before the transition and close to the pre-transition level in Hungary and Slovenia. At the same time, in Bulgaria and Lithuania wages much lower than before the transition. Figure 11 Real wages are close to the pre-transition level in CEE countries and below it in CIS-7. Real Wages in 2001 1989=100 140 120 100 80 60 40 20 0 Croatia Czech Republic Hungary Slovenia Poland Georgia Slovakia _CEE Romania Latvia Moldova Estonia Ukraine Russia Macedonia, FYR _RU Kazahstan Bulgaria Azerbaijan Armenia Lithuania _CIS-7 + K Kyrgyzstan Uzbekistan Tajikistan Percent Source: UNICEF, TransMONEE database; Bank staff calculations.
  • 32. In the CIS the variation in wage growth has been much less than in CEE and in most cases wages are 40 to 50 percent lower than before the transition. However, in a few countries (Kyrgyzstan, Tajikistan, and Uzbekistan) according to official data wages are at only 30 percent or even less of their pre-transition level Wage drop was strongly concentrated in the early phase of the transition followed by a strong wage growth since the mid 1990s Wage dynamics in ECA transition economies mirrored that of output and productivity. Wages fell sharply during the first half of the 1990s, when output was contracting, and have begun to growth since the mid 1990s, when output and productivity started to rise. Figure 10 shows the dramatic drop in wages during the first phase of the transition, and the strong wage growth during the following phase. It is worth noting, that the strong wage growth since the mid-1990s has occurred in all transition economies, with no exception. Thus, output and productivity growth, which followed the initial output collapse, have been translated into higher wages. Given that productivity growth has to a large extent been driven by eliminating labor hoardings and shedding of redundant labor, there has been a negative correlation between wages and employment growth. That is, the growth of wages was associated with the fall in employment. This renders the welfare effect of labor market developments during the second phase (associated with output recovery) of the transition ambiguous. There have been winners: employed insiders who enjoyed higher wages, and the outsiders, suffering from joblessness and income loss. Wage inequality has strong increased and reached high levels Wage inequality was relatively low in socialist countries, reflecting the egalitarian ideology. Wage grids were as a rule determined centrally, and specified the minimum and the maximum wage, with the latter being a pre-determined multiple of the latter. In some countries (e.g. Hungary, Poland) the system was somewhat more flexible, nonetheless wage distribution remained compressed either under the trade union pressure, or to buy social peace and maintain the legitimacy of the socialist system. The Gini coefficient, which is a summary measure of income inequality, was at a low level of 20-25 in European socialist economies and at somewhat higher level of around 25 in the Soviet Union (Atkinson and Micklewright, 1992).10 Wage distribution has widened considerably during the transition in all ECA countries, and wage inequality has reached high levels by international standards. However, there are substantial differences across country groups. Wage inequality tends to be higher in economically less developed countries. It is by far the largest in the low-income CIS, where the Gini coefficient is in the range of 45-50. In middle-income CIS the Gini coefficient ranges from about 35 in Belarus to over 40 in Ukraine, to nearly 50 in Russia. These values imply high levels of inequality by international standards. Wage disparities in the CIS are comparable to those in developing countries. In European transition economies wage dispersion is significantly lower than in the CIS, but higher than the EU average. The Gini coefficient is in most cases in the range of 30-40, which is high by European standards. The Czech Republic stands out as relatively low wage inequality transition economy (Gini less than 30), while Romania and Serbia and Montenegro are at the other extreme (Gini about 40). 10 The Gini coefficient ranges from 0, which indicates no inequality to 100, which means that all income is received by one person. In practice, the Gini coefficient is ranges from 20 to 50. 32
  • 33. Overall, there are quite substantial differences in the degree of wage inequality both between country groups and within groups. This variation in wage inequality is depicted in Figure 12.11 Figure 12 Summary of wage distribution, 2002 Summary of Wage Distribution, 2002 Ukraine Bulgaria 33 300 250 200 150 100 50 0 Azerbaijan -50 -100 Russia Kyrgyzstan SAM Armenia Estonia a) Romania Hungary a) Belarus Lithnuania Slovenia Latvia Poland Czech R. percent Source: UNICEF TransMONEE database; Bank staff calculation 14 12 10 8 6 4 2 0 P10 P90 Decile Ratio a) 2001 P10 = bottom decile/median P90 = top decile/median Decile ration = top decile/bottom decile In the European transition economies the wage distribution has widened especially at the upper tail, meaning the high wages have become more prevalent and also the emergence of very high wages, not seen under the previous regime. For example, in Poland before the transition a top-paid workers (top decile) was earning 60 percent more than the median worker. At present a top paid worker earns twice as much a the median worker. Thus, the earnings status of top paid workers has improved quite substantially. Changes at the lower tail of the wage distribution were less pronounced in CEE. Sticking to the example of Poland, which is quite typical, before the transition a low-paid (bottom decile) worker was earning 35 percent less than the median worker. Currently, a low-paid worker earns 11 The measures of wage inequality shown in Figure 12 are defined as follows. The decile ratio is the ratio of the top decile wage to the bottom decile wage, and can be thought of a ratio of “high” to “low” wages. The P90 ratio is the ratio of the top decile wage to the median wage, and shows the relative wage position of top paid workers. The P10 ratio is the ratio of bottom decile wage to the median wage and shows the relative wage position of low-paid workers.
  • 34. half the wage of the median worker. This represents a significant although not a dramatic deterioration of the relative earnings status of low-paid workers. In contrast, in the CIS the wage distribution has widened at both the lower and the upper tail, implying the emergence of very high and very low wages. Particularly, the earning status of low-paid workers has deteriorated in the CIS much more than in the European transition economies. For instance, in Russia before the transition a top paid worker was earning about 80 percent more than the median worker. Presently he/she earns tree times as much. A low-paid worker was earning 45 percent less than the median worker, now he/she earns about 70 percent less. This represents a dramatic deterioration of the relative wage position of low-paid workers in Russia. The contrast with Poland is quite striking. The relative wage status of a low-paid Russian worker is much worse than that of his Polish counterpart. At the same time, the a top-paid Russian worker earns, in relative terms, much more than his Polish counterpart. Welfare effects of the increase in wage dispersion: low-paid employment and the working poor The increase in wage inequality that has occurred during the transition to some extent has been a natural process, reflecting wages becoming better aligned with productivity differentials among workers. To the extent this has been the case, the increase in wage dispersion has played a positive economic function by rewarding effort and providing better incentives for skill acquisition. At the same time, in some cases the increase in wage inequality might have resulted from non-competitive wage setting practices. On the one hand, firms with monopsony power might have used it to suppress wages of workers, especially those whose bargaining position is weak (e.g. less skilled workers who are easier to replace). On the other, managers might have appropriated rents enjoyed by firms with some monopoly power, and thus award themselves salaries above the competitive level. Regardless of the causes of the increase in wage inequality, it has important welfare effects. This is particularly the case if the wage distribution widens at the bottom, as it has actually happened during the transition in all transition countries, but especially in the CIS. Low-paid workers have become more numerous and their relative wage position has deteriorated. And low-pay often translates into poverty. After all, a substantial proportion – in some countries the majority– of the poor in transition countries are the “working poor” (World Bank, 2000). The incidence of low-pay has increased substantially along with the increase in wage inequality.12 In many countries the increase has been dramatic. For example, in Latvia and Romania the fraction of low-paid workers increased from virtually zero to 13-14 percent of total (formal sector) employment. In Serbia and Montenegro, the fraction of low-paid workers quadrupled and currently exceeds 20 percent. In Russia the incidence of low-pay has risen from 7 percent before the transition to the current level of 23 percent. In Kyrgyzstan the fraction of low-paid workers has almost tripled, reaching 14 percent. Although in other countries the increase was more modest, it still has been considerable. In most of the transition economies the incidence of low-pay is presently high by international standards. In European OECD economies the incidence of low-pay is usually well below 10 percent. In contrast in most ECA transition economies the incidence of low-pay much 12 We are using here a relative rather than an absolute concept of low-pay. According to the relative approach, low-pay is customarily defined as earnings lower than 50 percent of the median wage. This is a narrow definition which delimits very low wages. A broader definition (not used here) delimits low-pay as earnings less than 66 percent of the median wage. 34
  • 35. exceeds 10 percent. Only in the Czech Republic and Hungary the incidence of low-pay is within the EU range (Rutkowski, 2001). Is the high incidence of low-pay a blessing or a curse? It is usually deemed as a curse, as frequently low-paid workers are poor. However, the high incidence of low-paid jobs can be also viewed as demonstrating the ability of the economy to provide employment to low-productivity workers who otherwise would be unemployed. Hence, to the extent the alternative to low-paid employment is unemployment, the availability of low-paid jobs actually helps to alleviate poverty. An increase in educational wage premia has been a major factor behind the rise in wage inequality The increase in wage dispersion is brought about by widening wage differentials between worker groups (e.g. skill groups) as well as by widening wage differentials within a given group. In other words, rising wage inequality reflects an increase in wage premier to various worker and firm characteristics. These include education and skills, occupation, sector of the economy, industry, or region. There is some evidence that during the transition there has been an increase in wage premia along all of these dimensions. For example, in Poland there is an evidence of the increased wage premia to education, to growing sectors and regions in the economy and to senior occupations (Newell, 2001). The increase in wage premia to education is probably the most important and the best documented observable factor that has caused the increase in wage dispersion in the transition economies.13 Under central planning wage differentials between highly educated workers and less educated workers tended to be relatively small. Evidence for CEE and Russia shows that the situation changed dramatically already during the first few years of the transition (Fleischer et al., 2004). Apparently the demand for high, blue collar skills has sharply risen, and that for less skilled manual labor has fallen. As a result wages and salaries of well educated and highly skilled workers have gone up, while wages of less educated workers have gone down, not only in relative terms but often also in absolute terms. These developments have led to a substantial increase in returns to education, especially to university education. At present, the annualized rate of return to education is similar or higher than that in West European economies (Orazem and Vodopivec, 1994, Vecernik, 1995; Rutkowski, 1996, 2001; Kertesi and Kollo, 2001; Newell and Reilly, 1997; Munich et al., 2000; Sabirianova, 2003). The increase in the premia to high skills and education (especially university education) has been driven by the private sector. That is, the private sector rewards high educational qualifications better than does the public sector. More generally, the pace of increase in returns to schooling has been positively related to the speed of market reforms. Returns to education increased faster in countries, where regulatory and institutional constraints on wage-setting were removed earlier. For example, in Ukraine, where the pace of market reforms has been slow, the increase in returns to schooling has been modest and they are still lower than in faster reforming economies of CEE as well as in Russia (Fleischer et al., 2004; Sabirianova Peter and Gorodnichenko, 2004). 13 Evidence comes mainly from CEE, Russia and Ukraine. An earlier study (Newell and Reilly, 1997) found that returns to university education in Uzbekistan in 1995 were significantly lower than in CEE, Russia and in Kazakhstan. 35
  • 36. Minimum wages are relatively high in CEE and low in CIS Virtually all transition countries have in place minimum wages, although their “bite” measured by the ration of the minimum wage to the average wage differs considerably across country groups. In he European transition economies minimum wages are pitched at a relatively high level, on average around 40 percent of the average wage (Figure 13). The minimum ranges from about one-third of the average wage in Bulgaria and Romania, to over 50 percent of the average wage in Slovakia to two-thirds of the average wage in Slovenia. These minimum wage/average wage ratios are well within the OECD range, although in Europe the ratio is usually higher than in non-EU OECD members. Figure 13 The “bite” of the minimum wage varies across ECA countries Minimum Wage as Percentage of the Average Wage 36 2002 70.00 60.00 50.00 40.00 30.00 20.00 10.00 0.00 Azerbaijan Russia Belarus CIS-7 Moldova Armenia BRU Estonia Bulgaria Romania Latvia Czech Republic Poland Slovakia Ukraine Lithuania CEE Hungary Slovenia percent Source: UNICEF TransMONEE database; Bank staff calculations. In SEE in most cases there is no national minimum wage. However, minimum wages are fixed at the industry level by collective agreements between trade unions and employer representatives. In addition, these countries apply the minimum social security contribution threshold, which tends to be substituted for the minimum wage.14 In the CIS national minimum wages are pitched at a much lower proportion of the average wage, with the notable exception of Ukraine, where currently (2002) the minimum wage accounts for 44 percent of the average wage, which is in the upper end of the CEE range. 14 The minimum social security contributions threshold is the lowest notional wage which is used as the basis to calculate the amount of social security contributions. In principle workers can received wages that are lower than the threshold, although in practice this seems to be rare.