Download to read offline

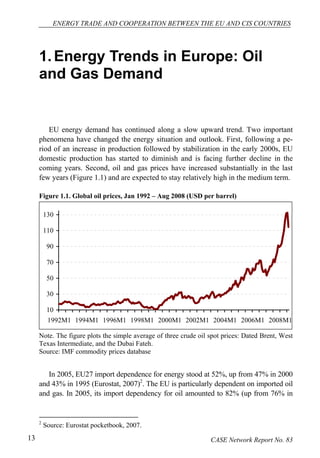
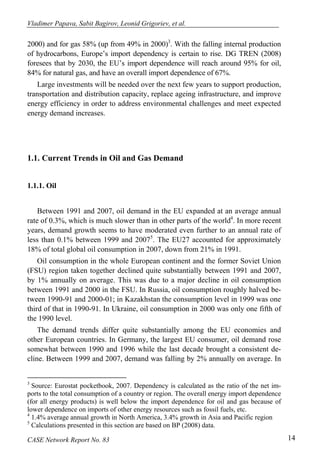
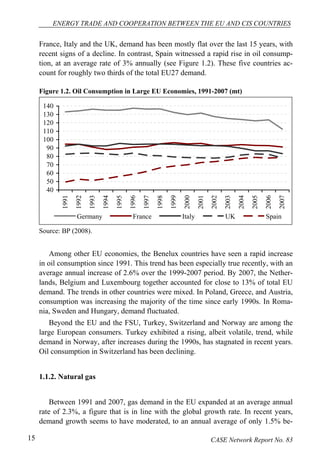

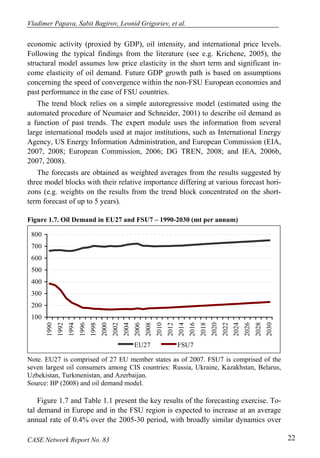
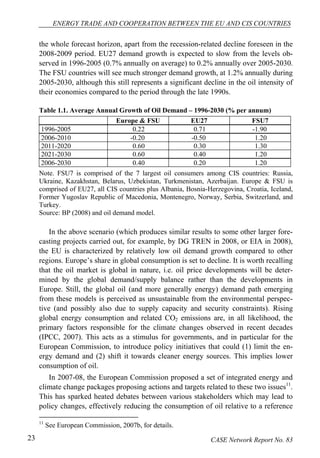


The document reviews key issues in energy trade and cooperation between the EU and CIS countries, including historical trends and forecasts of oil and gas demand. It discusses the production and export potential of these regions, along with the interests of transit countries and competition related to energy transportation. The report concludes with policy recommendations primarily aimed at the EU to enhance energy cooperation and security.


