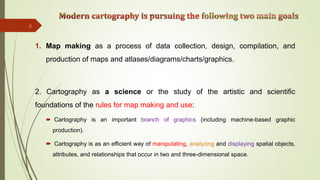
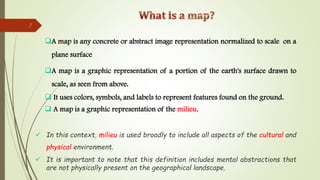
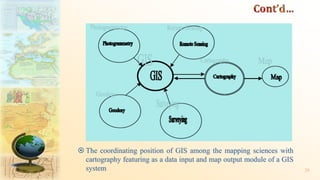
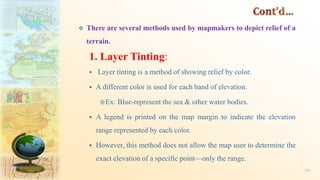
1
Ac year
2023/2024
2
Cartography has been called the science of communicating
information between individuals by the use of maps.
This statement implies that both map authors and map users
are part of the process; the cartographer must pay particular
attention to the needs of the user in designing each map.
Cartography is the method through which maps are studied,
created and designed.
A meeting between practice, science, and art, cartography
guides the principles and practical standards behind maps
and map making.
3
As the discipline has matured and become broader in scope,
many professional cartographers have come to make
distinction between mapmaking and cartography.
In general, cartography is viewed as broader than mapmaking,
for it requires the study of the philosophical and theoretical
bases of the rules for mapmaking.
 It is often thought to be the study of the artistic and scientific
foundations of mapmaking
4
The International Cartographic Association defines
Cartography as “The Art, Science, and Technology of making
maps, together with their study as scientific documents and
works of art’’.
In this context cartography can be regarded as including all
types of maps, plans, charts, and sections, three dimensional
models and globes representing the Earth or any celestial body
at any scale.
5
1. Map making as a process of data collection, design, compilation, and
production of maps and atlases/diagrams/charts/graphics.
2. Cartography as a science or the study of the artistic and scientific
foundations of the rules for map making and use:
 Cartography is an important branch of graphics (including machine-based graphic
production).
 Cartography is as an efficient way of manipulating, analyzing and displaying spatial objects,
attributes, and relationships that occur in two and three-dimensional space.
6
A map is any concrete or abstract image representation normalized to scale on a
plane surface
A map is a graphic representation of a portion of the earth's surface drawn to
scale, as seen from above.
 It uses colors, symbols, and labels to represent features found on the ground.
 A map is a graphic representation of the milieu.
 In this context, milieu is used broadly to include all aspects of the cultural and
physical environment.
 It is important to note that this definition includes mental abstractions that
are not physically present on the geographical landscape.
7
 A map is a portion or part of the features of the earth’s surface drawn to
scale on a plane surface such a paper, card, plastic, cloth or some
other material.
 Or a map is a representation on any plane surface of the features of
part or portion of the earth’s surface drawn to scale.
Main properties of maps:
 All maps are mathematical transformations of reality
 All maps use symbolization to represent reality
 All maps are abstractions of reality
8
 Map making involves the production of tangible maps and is defined as
the aggregate of those individual and largely technical process of data
collection, symbolization, cartographic design construction and
reproduction of maps.
 Cartography is a branch of graphics and extremely efficient way of
manipulating, analyzing, and expressing ideas, forms and relationships
that occur in 2D and 3D space
9
10
 cartography is more than mapping because it establishes the
philosophical and theoretical basis of the rules of map making
including the study of map communication.
 Combining science & technique, cartography builds on the premise
that reality can be modeled in ways that communicate special
information effectively
 Map interpretation refers to interpretation of the symbols and signs used
on map into ordinary language by indicating the features they represent
and draw logical conclusions from the information as represented by the
symbols
 Map interpretation is a high-level map use that may involve more than
one map to determine the nature of an area or distribution.
 It requires recognizing and describing spatial patterns, relating and
correlating geographic patterns, and essentially bringing all of the
available map information together to study a place or subject.
11
 GIS is an effective tool for visualizing spatial data, and when the
cartographer is ready to make a map for public viewing.
 In addition to visualization and map production, the real strength in GIS is
the capabilities of managing spatial data and for spatial analysis.
 So, the real strength GIS when combined with cartography is:
Artistic Drawing Programs
Cartographic abstraction
Selection
Classification
Simplification
Symbolization
12
So far, GIS-server mapping seems to have been applied more
to general purpose maps but there is great potential in these
technologies for thematic maps.
Artistic Drawing Programs: Created material, such as base
maps, can be edited and projected in the source program
(the GIS or computer mapping package), and transferred to
the drawing program for graphics enhancement (also called
a finishing program)
Cartographic abstraction: is that part of the mapping activity
wherein the map author or cartographer transforms
unmapped data into map form and selects and organizes the
information necessary to develop the user’s understanding of
the concepts.
13
 Selection: The selection process in the generalization operation of
cartographic design begins the mapmaking activity.
 Selection involves early decisions regarding the geographic space to be
mapped, map scale, map projection and aspect, which data variables are
appropriate for the map’s purpose, and any data gathering or sampling
methods that must be employed.
 Selection is critical and may involve working very closely with the map
author or map client.
 The selection activity requires the cartographer to be familiar with the
map’s content, especially the nature of the data being used in the
mapping process
14
Classification: Classification is a process in which objects are
placed in groups having identical or similar features.
The individuality and detail of each element is lost unless
Information is conveyed through identification of the
boundaries of the group.
Classification reduces the complexity of the map image, helps
to organize the mapped information, and thus enhances
communication.
Simplification: Selection and classification are examples of
simplification, but simplification may take other forms as well.
An example might be the smoothing of natural or man-made
lines on the map to eliminate unnecessary detail.
15
 Symbolization: Perhaps the most complex of the mapping abstractions is
symbolization.
 Developing a map requires symbolization, because it is not possible to
create a reduced image of the real world without devising a set of marks
(symbols) that stand for real-world things.
 In thematic mapping, if an element is mapped it is usually said to be
symbolized.
16
17
 Cartography, Geodesy, GIS and Remote sensing are interacting mapping
fields in the sense that they - at least partly - exhibit mutual dependencies
as far as sound information extraction is concerned.
 Geodesy provides accurate measurements about the earth and it has
been used as data input for GIS; GIS obtain data about datum's from
geodesy
 Cartography is the science of map making and map use that concerned
with representation to facilitate easy communication process.
1.2. Integration of Cartography, Geodesy, GIS & RS
 GIS is a computer-based system for data input, management
(storage and retrieval), manipulation and analysis, and
displaying of spatial data from the real world.
RS is the main source of data for cartography, GIS and
Geodesy.
 Prior to the emergence of GIS, cartography occupied a
preeminent position in relation to the other mapping sciences,
namely RS, Photogrammetry, Geodesy and Surveying.
18
 Each of these fields, used to submit a file for information mapping
directly to cartography.
 When GIS come to being , that eminent position has been reduced
significantly and Cartography no longer communicates directly with the
other sciences.
 GIS has assumed the position of coordinator with RS, Photogrammetry,
Geodesy and Surveying each being regarded as a module for data input
into it, which in turn communicates with cartography.
 Cartography has therefore continued to display/present graphic
information but with an added role of data input into a GIS system as well
19
 The coordinating position of GIS among the mapping sciences with
cartography featuring as a data input and map output module of a GIS
system 20
⁎ Cartographers group and categorize maps in order to understand them
better.
⁎ Thus, maps also can be categorized for practical (e.g. for cataloguing in a
library or database) and scientific reasons (e.g. for understanding
division between base and thematic contents).
⁎ Maps are categorized on the basis of their intended use.
 Mostly maps can be classified from four points of view:
design purpose
subject matter
dimension
scale
21
A) Two main types based on their design purpose.
I. Reference (or general purpose) maps
II. Thematic (or special purpose)
I. Reference (or general purpose) maps
 Maps that depict selected details of the physical and human-made
environment as accurately as possible.
 use symbols to locate and identify important landmarks and geographic
features.
 Such maps customarily display objects (both natural and man-made)
from the geographical environment.
22
 The emphasis is on location, and the purpose is to show a variety of
features of the world or a portion of it.
 Examples of such maps are topographic maps, maps of countries and
states contained in online map collections and many atlas maps.
23
 Physical maps use shaded or painted relief to illustrate the major
landforms (natural features).
 Shows mountain ranges and rivers, deserts, glaciers, lakes, and valleys.
 Use colors of brown or green for land and blue for water.
 Political maps are reference maps that show names and boundaries of
political geographic units (states, countries, etc.) and only very
important physical or human features (e.g., rivers, highways, etc.)
 Topographic maps are general reference maps showing coastlines,
cities, and rivers
 use contour lines to show elevation differences.
24
25
General purpose or reference map.
II. Thematic (special purpose)
 The other major class of map is the thematic map, also called
a special-purpose, single-topic, or statistical map
 Thematic (or special purpose) are maps that depict the
general spatial pattern of selected features or data.
 The International Cartographic Association defines the
thematic map this way: “A map designed to demonstrate
particular features or concepts”. 26
 Emphasize some particular feature or set of data using color,
shading, or symbols to represent differences.
 For example, rainfall or locations of crops, census maps
focus on population distribution as well as data on such items
as age, ethnicity, and income;
 These maps help governments provide services to its citizens
and plan for the future.
27
 Maps of physical world
 The atmosphere
 The oceans
 Geomagnetism
 Geology
 The land surface temperature
 Vegetation
 Animal life
 Maps of peoples and their
activities
Population
 Characteristic of peoples
 Cadastral
 Economic activities
 Movements of goods
 Maps of social environment
 Crime statistics
 Medical maps
 Living condition
 Ecological maps
28
• Thematic maps can be classified on the basis of any number of themes, including
 Thematic map can portray data using
• shaded areas (choropleth),
• dots (dot-density),
• symbols of different sizes (graduated symbol),
• lines of equal measurement (isoline), or
• proportional size of area (cartogram).
29
 Thematic maps may be subdivided into two groups,
qualitative and quantitative.
 The principal purpose of a qualitative thematic map is to show
the spatial distribution or location of single theme of nominal
data.
 These types of thematic maps do not show any quantities at
all but rather purely qualitative information, and are usually
rather generalized in its record.
30
 Maps of Eco regions, geology, soil types, and land use/land
cover maps are all common types of qualitative maps.
 With qualitative maps, the reader cannot determine
quantity, except as shown by relative areal extent
31
 Quantitative thematic maps, on the other hand, display the
spatial aspects of numerical data.
 In most instances a single variable, such as corn, people, or
income, is chosen, and the map focuses on the variation of
the feature from place to place.
 These maps may illustrate numerical data on the ordinal (less
than/greater than) scale or the interval/ratio (how much
different) scale
32
B. There are 3 types of maps based on Subject matter.
a. Cadastral maps:
 Cadastral maps are maps on large scale and are sometimes
known as plans map.
 are useful for identification of boundaries of property in legal
documents and for detailed affairs of every kind such as
local administration, taxation and management estate.
33
b. Topographical maps
 The word topography is derived from the Greek word topos, which means
place.
 Topography is a term used to describe all physical features of a given area.
 Topographic maps are small-scale drawings of a part of the earth’s surface.
 These maps show:-
i) Location
ii) Landscape as mountains, hills, plateaus, plains, lakes, rivers, seas,
oceans and shape of coast lines.
iii) Cultural features or artificial features such as roads, railways, cities,
towns, dams and other structures built by man.
34
c. Atlas maps
 Atlas maps are small scale maps.
 Most of the atlas maps are to give general impression of any particular
area.
 Atlas maps can cover a wide range of subjects, including political
boundaries, physical geography (such as landforms and bodies of water),
transportation networks, population distribution, and more.
 They are often used for reference, education, navigation, and geographic
analysis.
 Atlas maps can be printed on paper or accessed digitally through various
platforms.
 Based on the contents and purpose different themes are created to
represent data in an Atlas maps. 35
C. Types of Maps based on Scale:
 Though no complete agreement, three types :
i) Small Scale Map - maps usually at scales of 1: 1000,000 and smaller
• are used for general planning and for strategic studies.
• covers a very large land area at the expense of detail.
ii) Medium Scale Map – are maps usually at scales that lie in between
1:1000, 000 to 1:50,000.
• They contain a moderate amount of detail.
iii) Large Scale Map - maps usually at scales of 1: 50,000 and larger and
• are used for detailed studies.
® Terrain analysis (characteristic features of a land surface: landforms,
elevation, rocks, soils, and vegetation and other) is best done with the
large-scale maps.
36
D. There are 5 types of maps based on their dimension.
 There are 5 types of maps based on their dimension.
i) Planmetric Map - a map showing only the horizontal (flat) position of features.
ii) Topographic Map - a two-dimensional map which presents the horizontal (flat) and
the vertical (relief) positions of the features represented.
iii) Plastic Relief Map - A topographic map printed on plastic and molded into a three-
dimensional form.
iv) Photo Map - A reproduction of a photograph or photomosaic upon which grid lines,
marginal data, place names and boundaries may be added.
V)Terrain Model - A three-dimensional representation of an area, modeled in plaster,
rubber, or other materials.
 It is distinguished from others maps showing some cultural and terrain
features realistically instead of symbolically.
37
Map use/Purpose
 A map provides information on the existence, the location of, and the distance
between ground features, such as populated places and routes of travel and
communication.
 It also indicates variations in terrain, heights of natural features, and the extent
of vegetation cover.
 Help to identify economic resource potential
 Important for engineering and surveying
 Maps usually are used as input to GIS.
 Maps can be used to communicate results of GIS operations.
 Maps are tools while working with GIS to execute and support spatial analysis
operations.
 Map is also used to reveal pattern. 38
1.5. Cartographic Principles and practices
 Because maps are made by humans they may as a consequence contain
purposeful errors (lies) or errors of oversight and poor judgment, or
both.
 The conclusion of many discussions have led to several “codes of
ethics” for the thematic cartographer, and includes these, in various
forms.
® Always have a straightforward agenda, and have a defining purpose
or goal for each map.
® Always strive to know your audience (the map reader).
® Do not intentionally lie with data.
® Always show all relevant data whenever possible.
39
® Data should not be discarded simply because they are contrary to the
position held by the cartographer.
® At a given scale, attempt for an accurate description of the data.
® The cartographer should avoid plagiarizing; report all data sources.
® Symbolization should not be selected to bias the interpretation of the
map.
® The mapped result should be able to be repeated by other cartographers.
® Attention should be given to differing cultural values and principles.
40
Cartography as language and communication
 As one of the content of map has been assembled, it is suggested that
this information is then converted into cartographic language than can
be expressed in the form of map; this is described as encoding
 In cartographic communication, cartographic symbols can be compared
with words in spoken and written language
41
 Words have a meaning in themselves and a collection of words,
written dawn according to certain grammar, together makes up a
certain information
 Similarly, a single symbol has a specific meaning, whereas the total
collection of symbols, used in a map according to some geographical
distribution form spatial information.
42
Communication (Knowledge Representation)
 One can assume that prehistory man used to utterances and sketches
(drawings) to create the mental images involved in understanding objects
and their relationships
 From this developed the written languages and mathematics.
 The sketches evolved into present day graphics.
 These have been vehicles of thought and communication – forms of
Knowledge Representation.
 Written and verbal languages allow us to develop ideas and express them
in a variety of ways
43
 The use of written language is called literacy while the use of spoken
language is called articulacy.
 Mathematics make use of numeracy: It is the way of symbolizing and
dealing with relationships among abstractions, sets of numbers and
magnitudes.
 Graphicacy is the fourth way of communication that extend from and
drawing and painting to the construction of plans and diagrams including
imageries.
 When we try to communicate with someone by describing spatial r/p, we
aspire to evoke and similar image in the person’s mind 44
1.5.1. Reading contours and relief
i. Contour Lines: Isoline.docx
 are the most common method of showing relief and elevation on a
standard topographic map.
 Represented by imaginary lines connecting areas of the same elevation
above sea level (asl).
 All points on a contour line are at the same elevation.
 The contours are always labeled with figures showing heights above the
mean sea level
 Contours are drown at certain interval called the Contour Interval (C I). 45
 Contour lines are lines on a map that connect points of equal elevation,
indicating the shape and steepness of the terrain.
 They're like a topographical blueprint of the land, showing valleys, hills,
and mountains.
 The spacing between contour lines represents the slope of the terrain:
closely spaced lines indicate steep terrain, while widely spaced lines
indicate gentle slopes.
 By interpreting contour lines, you can understand the landscape's
features, plan routes, and assess the difficulty of hiking, climbing, or
navigating through an area.
46
47
Contour lines
Guidelines for using contour lines:
A. Some Basic Contour Rules:
1. Contour Lines do not cross each other
2. Points on a contour line shows equal elevation
3. Contour lines cross different landforms as valleys or spur at 90 degree.
4. Contour lines do not form branches.
5. The closer Spaced the contour lines are to one another, the steeper the
slope is and Contour lines widely spaced show a gentle slope.
B. Intervisibility: Intervisibility, in geography and spatial analysis, refers to the visibility between two
points within a landscape or terrain. It's the ability to see one point from another without obstruction by natural
or man-made features. This concept is important in various fields, including urban planning, military strategy,
and environmental management.
If two points are mutually intervisible; depends on the following factors:
i. The type of slope b/n the two points
ii. The general relief b/n the two points
iii.The vegetation cover of the area
C. Dead Ground: a piece of land not visible from a point in the field 48
1. Uniform Slope:
 When the raise/fall of the ground per unit horizontal distance is the same
at every part of the slope.
 Contours are spaced at equal distances
2. Concave Slope: a slope w/c curves inwards; its lower part represented by
widely separated contours but its upper part drown by close contours
3. Convex Slope: Steep at the bottom and gentle at the top
49
Relief Features Represented by Contours
 There are various landforms that appear on contour maps:
1. Major Land Forms associated with a Single mountain
i. Mountain: is an isolated area of higher ground standing above the
surrounding.
 The min. height for a mountain is 600meters a s l. if <600m, it is called a hill.
ii. Hill:
 A hill is an area of high ground.
 From a hilltop, the ground slopes down in all directions.
 A hill is shown on a map by contour lines forming concentric circles.
 The inside of the smallest closed circle is the hilltop
50
51
iii. Spur.
 a narrow highland b/n valleys
 A spur is a short, continuous sloping line of higher ground, normally extending out
from the side of a ridge.
 A spur is often formed by two roughly parallel streams cutting draws down the side
of a ridge.
 The ground will slope down in three directions and up in one.
 Contour lines on a map depict a spur with the U or V pointing away from high
ground.
2. Major Landforms Associated With a Mountain Ridge
1. Ridge.
 A ridge is a sloping line of high ground.
 It is a long narrow, steep sided projection on a mountain side.
 Contour lines forming a ridge tend to be U-shaped or V-shaped.
 The closed end of the contour line points away from high ground
52
2. Saddle.
 A saddle is a dip or low point between two areas of higher ground.
 A saddle is not necessarily the lower ground between two hilltops; it
may be simply a dip or break along a level ridge crest.
 If you are in a saddle, there is high ground in two opposite directions
and lower ground in the other two directions.
53
3. Cliff.
 A cliff is a vertical or near vertical feature, it is an abrupt change of
the land.
 When a slope is so steep that the contour lines converge into one
"carrying" contour of contours, this last contour line has tick marks
pointing toward low ground.
 Cliffs are also shown by contour lines very close together and, in
some instances, touching each other.
54
3. Landforms Associated With Plateau
a. An Escarpment: A steep slope of a plateau
b. Canyon: a deep, steep sided (more steep than a gorge) valley
c. Gorge: a deep narrow v-shaped valley with steep sides
d. Amba/Butter/mesa: a flat topped mountain structure that looks like a
table
4. Glaciated Landforms:
a. Cirque or Corrie: A steep walled circular basin or valley usually
found near the top of mountain that was glaciated
b. Hanging valley: A tributary valley of the main glaciated valley, the
bottom of which is on a higher level than the top of the main valley
c. Nunatak: a peak, originally standing above the ice-sheet covering a
mountain top and usually triangular in
shape
d. Arete: a mountain ridge that originally separated two valley
glaciers 55
56
5. Other Land Forms:
1. Valley.
 A valley is a stretched-out groove in the land, usually formed by streams or
rivers.
 A valley begins with high ground on three sides, and usually has a course
of running water through it.
 Depending on its size and where a person is standing, it may not be
obvious that there is high ground in the third direction, but water flows
from higher to lower ground.
 Contour lines forming a valley are either U-shaped or V-shaped.
 To determine the direction water is flowing, look at the contour lines.
 The closed end of the contour line (U or V) always points upstream or
toward high ground.
57
58
2. Depression.
 A depression is a low point in the ground or a sinkhole.
 It could be described as an area of low ground surrounded by higher ground in all
directions, or simply a hole in the ground.
 Usually only depressions that are equal to or greater than the contour interval will be
shown.
 On maps, depressions are represented by closed contour lines that have tick marks
pointing toward low ground
59
 Relief or terrain (also topographical relief) involves the vertical and
horizontal dimensions of land surface.
 The term bathymetry is used to describe underwater relief,
while hypsometry studies terrain relative to sea level.
 Relief (or local relief) refers specifically to the quantitative measurement of
vertical elevation change in a landscape.
 It is the difference between maximum and minimum elevations within a
given area, usually of limited extent.
 A relief can be described qualitatively, such as a "low relief" or "high
relief" plain or upland.
60
 The relief of a landscape can change with the size of the area over which
it is measured, making the definition of the scale over which it is
measured very important.
 Because it is related to the slope of surfaces within the area of interest and
to the gradient of any streams present, the relief of a landscape is a useful
metric in the study of the Earth's surface.
 In physical geography, relief is the lay of the land.
 This is usually expressed in terms of the elevation, slope, and orientation
of terrain features.
 Terrain affects surface water flow and distribution.
 Over a large area, it can affect weather and climate patterns.
61
 Ways of Expressing Relief
The surface of the earth varies from place to place.
Land features like plains, hills, plateaus, valleys, ridges, w/c make
up the earth’s surface uneven are relief features.
Relief is the representation of the shapes of hills, valleys, streams,
or terrain features on the earth's surface
 The reference or start point for vertical measurement of elevation on a
standard map is the datum plane or mean sea level, the point halfway
between high tide and low tide.
 Elevation of a point on the earth's surface is the vertical distance
62
63
 There are several methods used by mapmakers to depict relief of a
terrain.
1. Layer Tinting:
 Layer tinting is a method of showing relief by color.
 A different color is used for each band of elevation.
Ex: Blue-represent the sea & other water bodies.
 A legend is printed on the map margin to indicate the elevation
range represented by each color.
 However, this method does not allow the map user to determine the
exact elevation of a specific point—only the range.
64
65
2. Shaded Relief
 Shaded relief, or hill-shading, used in Cartographic relief
depiction, shows the shape of the terrain in a realistic fashion
by showing how the three-dimensional surface would be
illuminated from a point light source.
 A raster image that shows changes in elevation using light and
shadows on terrain from a given angle and altitude of the sun.
 Shaded relief maps show features on the surface, areas that are
flat or have few features are smooth on the map, whereas areas
with steep slopes and mountains appear more rough.
66
 Relief shading indicates relief by a shadow effect achieved by tone
and color-that results in the darkening of one side of terrain features,
such as hills and ridges.
 The darker the shading, the steeper the slope.
 Shaded relief is sometimes used in conjunction with contour lines to
emphasize these features
67
3. Hachures
 Hachures are strokes (short line segments or curves) drawn in the
direction of the steepest slope (the aspect direction).
 Steeper slopes are represented by thicker, shorter strokes, while gentler
slopes are represented by thinner, longer and farther apart strokes.
68

Cartography & map interpretation chapter_1.pdf

  • 1.
  • 2.
  • 3.
    Cartography has beencalled the science of communicating information between individuals by the use of maps. This statement implies that both map authors and map users are part of the process; the cartographer must pay particular attention to the needs of the user in designing each map. Cartography is the method through which maps are studied, created and designed. A meeting between practice, science, and art, cartography guides the principles and practical standards behind maps and map making. 3
  • 4.
    As the disciplinehas matured and become broader in scope, many professional cartographers have come to make distinction between mapmaking and cartography. In general, cartography is viewed as broader than mapmaking, for it requires the study of the philosophical and theoretical bases of the rules for mapmaking.  It is often thought to be the study of the artistic and scientific foundations of mapmaking 4
  • 5.
    The International CartographicAssociation defines Cartography as “The Art, Science, and Technology of making maps, together with their study as scientific documents and works of art’’. In this context cartography can be regarded as including all types of maps, plans, charts, and sections, three dimensional models and globes representing the Earth or any celestial body at any scale. 5
  • 6.
    1. Map makingas a process of data collection, design, compilation, and production of maps and atlases/diagrams/charts/graphics. 2. Cartography as a science or the study of the artistic and scientific foundations of the rules for map making and use:  Cartography is an important branch of graphics (including machine-based graphic production).  Cartography is as an efficient way of manipulating, analyzing and displaying spatial objects, attributes, and relationships that occur in two and three-dimensional space. 6
  • 7.
    A map isany concrete or abstract image representation normalized to scale on a plane surface A map is a graphic representation of a portion of the earth's surface drawn to scale, as seen from above.  It uses colors, symbols, and labels to represent features found on the ground.  A map is a graphic representation of the milieu.  In this context, milieu is used broadly to include all aspects of the cultural and physical environment.  It is important to note that this definition includes mental abstractions that are not physically present on the geographical landscape. 7
  • 8.
     A mapis a portion or part of the features of the earth’s surface drawn to scale on a plane surface such a paper, card, plastic, cloth or some other material.  Or a map is a representation on any plane surface of the features of part or portion of the earth’s surface drawn to scale. Main properties of maps:  All maps are mathematical transformations of reality  All maps use symbolization to represent reality  All maps are abstractions of reality 8
  • 9.
     Map makinginvolves the production of tangible maps and is defined as the aggregate of those individual and largely technical process of data collection, symbolization, cartographic design construction and reproduction of maps.  Cartography is a branch of graphics and extremely efficient way of manipulating, analyzing, and expressing ideas, forms and relationships that occur in 2D and 3D space 9
  • 10.
    10  cartography ismore than mapping because it establishes the philosophical and theoretical basis of the rules of map making including the study of map communication.  Combining science & technique, cartography builds on the premise that reality can be modeled in ways that communicate special information effectively
  • 11.
     Map interpretationrefers to interpretation of the symbols and signs used on map into ordinary language by indicating the features they represent and draw logical conclusions from the information as represented by the symbols  Map interpretation is a high-level map use that may involve more than one map to determine the nature of an area or distribution.  It requires recognizing and describing spatial patterns, relating and correlating geographic patterns, and essentially bringing all of the available map information together to study a place or subject. 11
  • 12.
     GIS isan effective tool for visualizing spatial data, and when the cartographer is ready to make a map for public viewing.  In addition to visualization and map production, the real strength in GIS is the capabilities of managing spatial data and for spatial analysis.  So, the real strength GIS when combined with cartography is: Artistic Drawing Programs Cartographic abstraction Selection Classification Simplification Symbolization 12
  • 13.
    So far, GIS-servermapping seems to have been applied more to general purpose maps but there is great potential in these technologies for thematic maps. Artistic Drawing Programs: Created material, such as base maps, can be edited and projected in the source program (the GIS or computer mapping package), and transferred to the drawing program for graphics enhancement (also called a finishing program) Cartographic abstraction: is that part of the mapping activity wherein the map author or cartographer transforms unmapped data into map form and selects and organizes the information necessary to develop the user’s understanding of the concepts. 13
  • 14.
     Selection: Theselection process in the generalization operation of cartographic design begins the mapmaking activity.  Selection involves early decisions regarding the geographic space to be mapped, map scale, map projection and aspect, which data variables are appropriate for the map’s purpose, and any data gathering or sampling methods that must be employed.  Selection is critical and may involve working very closely with the map author or map client.  The selection activity requires the cartographer to be familiar with the map’s content, especially the nature of the data being used in the mapping process 14
  • 15.
    Classification: Classification isa process in which objects are placed in groups having identical or similar features. The individuality and detail of each element is lost unless Information is conveyed through identification of the boundaries of the group. Classification reduces the complexity of the map image, helps to organize the mapped information, and thus enhances communication. Simplification: Selection and classification are examples of simplification, but simplification may take other forms as well. An example might be the smoothing of natural or man-made lines on the map to eliminate unnecessary detail. 15
  • 16.
     Symbolization: Perhapsthe most complex of the mapping abstractions is symbolization.  Developing a map requires symbolization, because it is not possible to create a reduced image of the real world without devising a set of marks (symbols) that stand for real-world things.  In thematic mapping, if an element is mapped it is usually said to be symbolized. 16
  • 17.
    17  Cartography, Geodesy,GIS and Remote sensing are interacting mapping fields in the sense that they - at least partly - exhibit mutual dependencies as far as sound information extraction is concerned.  Geodesy provides accurate measurements about the earth and it has been used as data input for GIS; GIS obtain data about datum's from geodesy  Cartography is the science of map making and map use that concerned with representation to facilitate easy communication process. 1.2. Integration of Cartography, Geodesy, GIS & RS
  • 18.
     GIS isa computer-based system for data input, management (storage and retrieval), manipulation and analysis, and displaying of spatial data from the real world. RS is the main source of data for cartography, GIS and Geodesy.  Prior to the emergence of GIS, cartography occupied a preeminent position in relation to the other mapping sciences, namely RS, Photogrammetry, Geodesy and Surveying. 18
  • 19.
     Each ofthese fields, used to submit a file for information mapping directly to cartography.  When GIS come to being , that eminent position has been reduced significantly and Cartography no longer communicates directly with the other sciences.  GIS has assumed the position of coordinator with RS, Photogrammetry, Geodesy and Surveying each being regarded as a module for data input into it, which in turn communicates with cartography.  Cartography has therefore continued to display/present graphic information but with an added role of data input into a GIS system as well 19
  • 20.
     The coordinatingposition of GIS among the mapping sciences with cartography featuring as a data input and map output module of a GIS system 20
  • 21.
    ⁎ Cartographers groupand categorize maps in order to understand them better. ⁎ Thus, maps also can be categorized for practical (e.g. for cataloguing in a library or database) and scientific reasons (e.g. for understanding division between base and thematic contents). ⁎ Maps are categorized on the basis of their intended use.  Mostly maps can be classified from four points of view: design purpose subject matter dimension scale 21
  • 22.
    A) Two maintypes based on their design purpose. I. Reference (or general purpose) maps II. Thematic (or special purpose) I. Reference (or general purpose) maps  Maps that depict selected details of the physical and human-made environment as accurately as possible.  use symbols to locate and identify important landmarks and geographic features.  Such maps customarily display objects (both natural and man-made) from the geographical environment. 22
  • 23.
     The emphasisis on location, and the purpose is to show a variety of features of the world or a portion of it.  Examples of such maps are topographic maps, maps of countries and states contained in online map collections and many atlas maps. 23
  • 24.
     Physical mapsuse shaded or painted relief to illustrate the major landforms (natural features).  Shows mountain ranges and rivers, deserts, glaciers, lakes, and valleys.  Use colors of brown or green for land and blue for water.  Political maps are reference maps that show names and boundaries of political geographic units (states, countries, etc.) and only very important physical or human features (e.g., rivers, highways, etc.)  Topographic maps are general reference maps showing coastlines, cities, and rivers  use contour lines to show elevation differences. 24
  • 25.
    25 General purpose orreference map.
  • 26.
    II. Thematic (specialpurpose)  The other major class of map is the thematic map, also called a special-purpose, single-topic, or statistical map  Thematic (or special purpose) are maps that depict the general spatial pattern of selected features or data.  The International Cartographic Association defines the thematic map this way: “A map designed to demonstrate particular features or concepts”. 26
  • 27.
     Emphasize someparticular feature or set of data using color, shading, or symbols to represent differences.  For example, rainfall or locations of crops, census maps focus on population distribution as well as data on such items as age, ethnicity, and income;  These maps help governments provide services to its citizens and plan for the future. 27
  • 28.
     Maps ofphysical world  The atmosphere  The oceans  Geomagnetism  Geology  The land surface temperature  Vegetation  Animal life  Maps of peoples and their activities Population  Characteristic of peoples  Cadastral  Economic activities  Movements of goods  Maps of social environment  Crime statistics  Medical maps  Living condition  Ecological maps 28 • Thematic maps can be classified on the basis of any number of themes, including
  • 29.
     Thematic mapcan portray data using • shaded areas (choropleth), • dots (dot-density), • symbols of different sizes (graduated symbol), • lines of equal measurement (isoline), or • proportional size of area (cartogram). 29
  • 30.
     Thematic mapsmay be subdivided into two groups, qualitative and quantitative.  The principal purpose of a qualitative thematic map is to show the spatial distribution or location of single theme of nominal data.  These types of thematic maps do not show any quantities at all but rather purely qualitative information, and are usually rather generalized in its record. 30
  • 31.
     Maps ofEco regions, geology, soil types, and land use/land cover maps are all common types of qualitative maps.  With qualitative maps, the reader cannot determine quantity, except as shown by relative areal extent 31
  • 32.
     Quantitative thematicmaps, on the other hand, display the spatial aspects of numerical data.  In most instances a single variable, such as corn, people, or income, is chosen, and the map focuses on the variation of the feature from place to place.  These maps may illustrate numerical data on the ordinal (less than/greater than) scale or the interval/ratio (how much different) scale 32
  • 33.
    B. There are3 types of maps based on Subject matter. a. Cadastral maps:  Cadastral maps are maps on large scale and are sometimes known as plans map.  are useful for identification of boundaries of property in legal documents and for detailed affairs of every kind such as local administration, taxation and management estate. 33
  • 34.
    b. Topographical maps The word topography is derived from the Greek word topos, which means place.  Topography is a term used to describe all physical features of a given area.  Topographic maps are small-scale drawings of a part of the earth’s surface.  These maps show:- i) Location ii) Landscape as mountains, hills, plateaus, plains, lakes, rivers, seas, oceans and shape of coast lines. iii) Cultural features or artificial features such as roads, railways, cities, towns, dams and other structures built by man. 34
  • 35.
    c. Atlas maps Atlas maps are small scale maps.  Most of the atlas maps are to give general impression of any particular area.  Atlas maps can cover a wide range of subjects, including political boundaries, physical geography (such as landforms and bodies of water), transportation networks, population distribution, and more.  They are often used for reference, education, navigation, and geographic analysis.  Atlas maps can be printed on paper or accessed digitally through various platforms.  Based on the contents and purpose different themes are created to represent data in an Atlas maps. 35
  • 36.
    C. Types ofMaps based on Scale:  Though no complete agreement, three types : i) Small Scale Map - maps usually at scales of 1: 1000,000 and smaller • are used for general planning and for strategic studies. • covers a very large land area at the expense of detail. ii) Medium Scale Map – are maps usually at scales that lie in between 1:1000, 000 to 1:50,000. • They contain a moderate amount of detail. iii) Large Scale Map - maps usually at scales of 1: 50,000 and larger and • are used for detailed studies. ® Terrain analysis (characteristic features of a land surface: landforms, elevation, rocks, soils, and vegetation and other) is best done with the large-scale maps. 36
  • 37.
    D. There are5 types of maps based on their dimension.  There are 5 types of maps based on their dimension. i) Planmetric Map - a map showing only the horizontal (flat) position of features. ii) Topographic Map - a two-dimensional map which presents the horizontal (flat) and the vertical (relief) positions of the features represented. iii) Plastic Relief Map - A topographic map printed on plastic and molded into a three- dimensional form. iv) Photo Map - A reproduction of a photograph or photomosaic upon which grid lines, marginal data, place names and boundaries may be added. V)Terrain Model - A three-dimensional representation of an area, modeled in plaster, rubber, or other materials.  It is distinguished from others maps showing some cultural and terrain features realistically instead of symbolically. 37
  • 38.
    Map use/Purpose  Amap provides information on the existence, the location of, and the distance between ground features, such as populated places and routes of travel and communication.  It also indicates variations in terrain, heights of natural features, and the extent of vegetation cover.  Help to identify economic resource potential  Important for engineering and surveying  Maps usually are used as input to GIS.  Maps can be used to communicate results of GIS operations.  Maps are tools while working with GIS to execute and support spatial analysis operations.  Map is also used to reveal pattern. 38
  • 39.
    1.5. Cartographic Principlesand practices  Because maps are made by humans they may as a consequence contain purposeful errors (lies) or errors of oversight and poor judgment, or both.  The conclusion of many discussions have led to several “codes of ethics” for the thematic cartographer, and includes these, in various forms. ® Always have a straightforward agenda, and have a defining purpose or goal for each map. ® Always strive to know your audience (the map reader). ® Do not intentionally lie with data. ® Always show all relevant data whenever possible. 39
  • 40.
    ® Data shouldnot be discarded simply because they are contrary to the position held by the cartographer. ® At a given scale, attempt for an accurate description of the data. ® The cartographer should avoid plagiarizing; report all data sources. ® Symbolization should not be selected to bias the interpretation of the map. ® The mapped result should be able to be repeated by other cartographers. ® Attention should be given to differing cultural values and principles. 40
  • 41.
    Cartography as languageand communication  As one of the content of map has been assembled, it is suggested that this information is then converted into cartographic language than can be expressed in the form of map; this is described as encoding  In cartographic communication, cartographic symbols can be compared with words in spoken and written language 41
  • 42.
     Words havea meaning in themselves and a collection of words, written dawn according to certain grammar, together makes up a certain information  Similarly, a single symbol has a specific meaning, whereas the total collection of symbols, used in a map according to some geographical distribution form spatial information. 42
  • 43.
    Communication (Knowledge Representation) One can assume that prehistory man used to utterances and sketches (drawings) to create the mental images involved in understanding objects and their relationships  From this developed the written languages and mathematics.  The sketches evolved into present day graphics.  These have been vehicles of thought and communication – forms of Knowledge Representation.  Written and verbal languages allow us to develop ideas and express them in a variety of ways 43
  • 44.
     The useof written language is called literacy while the use of spoken language is called articulacy.  Mathematics make use of numeracy: It is the way of symbolizing and dealing with relationships among abstractions, sets of numbers and magnitudes.  Graphicacy is the fourth way of communication that extend from and drawing and painting to the construction of plans and diagrams including imageries.  When we try to communicate with someone by describing spatial r/p, we aspire to evoke and similar image in the person’s mind 44
  • 45.
    1.5.1. Reading contoursand relief i. Contour Lines: Isoline.docx  are the most common method of showing relief and elevation on a standard topographic map.  Represented by imaginary lines connecting areas of the same elevation above sea level (asl).  All points on a contour line are at the same elevation.  The contours are always labeled with figures showing heights above the mean sea level  Contours are drown at certain interval called the Contour Interval (C I). 45
  • 46.
     Contour linesare lines on a map that connect points of equal elevation, indicating the shape and steepness of the terrain.  They're like a topographical blueprint of the land, showing valleys, hills, and mountains.  The spacing between contour lines represents the slope of the terrain: closely spaced lines indicate steep terrain, while widely spaced lines indicate gentle slopes.  By interpreting contour lines, you can understand the landscape's features, plan routes, and assess the difficulty of hiking, climbing, or navigating through an area. 46
  • 47.
  • 48.
    Guidelines for usingcontour lines: A. Some Basic Contour Rules: 1. Contour Lines do not cross each other 2. Points on a contour line shows equal elevation 3. Contour lines cross different landforms as valleys or spur at 90 degree. 4. Contour lines do not form branches. 5. The closer Spaced the contour lines are to one another, the steeper the slope is and Contour lines widely spaced show a gentle slope. B. Intervisibility: Intervisibility, in geography and spatial analysis, refers to the visibility between two points within a landscape or terrain. It's the ability to see one point from another without obstruction by natural or man-made features. This concept is important in various fields, including urban planning, military strategy, and environmental management. If two points are mutually intervisible; depends on the following factors: i. The type of slope b/n the two points ii. The general relief b/n the two points iii.The vegetation cover of the area C. Dead Ground: a piece of land not visible from a point in the field 48
  • 49.
    1. Uniform Slope: When the raise/fall of the ground per unit horizontal distance is the same at every part of the slope.  Contours are spaced at equal distances 2. Concave Slope: a slope w/c curves inwards; its lower part represented by widely separated contours but its upper part drown by close contours 3. Convex Slope: Steep at the bottom and gentle at the top 49 Relief Features Represented by Contours
  • 50.
     There arevarious landforms that appear on contour maps: 1. Major Land Forms associated with a Single mountain i. Mountain: is an isolated area of higher ground standing above the surrounding.  The min. height for a mountain is 600meters a s l. if <600m, it is called a hill. ii. Hill:  A hill is an area of high ground.  From a hilltop, the ground slopes down in all directions.  A hill is shown on a map by contour lines forming concentric circles.  The inside of the smallest closed circle is the hilltop 50
  • 51.
    51 iii. Spur.  anarrow highland b/n valleys  A spur is a short, continuous sloping line of higher ground, normally extending out from the side of a ridge.  A spur is often formed by two roughly parallel streams cutting draws down the side of a ridge.  The ground will slope down in three directions and up in one.  Contour lines on a map depict a spur with the U or V pointing away from high ground.
  • 52.
    2. Major LandformsAssociated With a Mountain Ridge 1. Ridge.  A ridge is a sloping line of high ground.  It is a long narrow, steep sided projection on a mountain side.  Contour lines forming a ridge tend to be U-shaped or V-shaped.  The closed end of the contour line points away from high ground 52
  • 53.
    2. Saddle.  Asaddle is a dip or low point between two areas of higher ground.  A saddle is not necessarily the lower ground between two hilltops; it may be simply a dip or break along a level ridge crest.  If you are in a saddle, there is high ground in two opposite directions and lower ground in the other two directions. 53
  • 54.
    3. Cliff.  Acliff is a vertical or near vertical feature, it is an abrupt change of the land.  When a slope is so steep that the contour lines converge into one "carrying" contour of contours, this last contour line has tick marks pointing toward low ground.  Cliffs are also shown by contour lines very close together and, in some instances, touching each other. 54
  • 55.
    3. Landforms AssociatedWith Plateau a. An Escarpment: A steep slope of a plateau b. Canyon: a deep, steep sided (more steep than a gorge) valley c. Gorge: a deep narrow v-shaped valley with steep sides d. Amba/Butter/mesa: a flat topped mountain structure that looks like a table 4. Glaciated Landforms: a. Cirque or Corrie: A steep walled circular basin or valley usually found near the top of mountain that was glaciated b. Hanging valley: A tributary valley of the main glaciated valley, the bottom of which is on a higher level than the top of the main valley c. Nunatak: a peak, originally standing above the ice-sheet covering a mountain top and usually triangular in shape d. Arete: a mountain ridge that originally separated two valley glaciers 55
  • 56.
  • 57.
    5. Other LandForms: 1. Valley.  A valley is a stretched-out groove in the land, usually formed by streams or rivers.  A valley begins with high ground on three sides, and usually has a course of running water through it.  Depending on its size and where a person is standing, it may not be obvious that there is high ground in the third direction, but water flows from higher to lower ground.  Contour lines forming a valley are either U-shaped or V-shaped.  To determine the direction water is flowing, look at the contour lines.  The closed end of the contour line (U or V) always points upstream or toward high ground. 57
  • 58.
  • 59.
    2. Depression.  Adepression is a low point in the ground or a sinkhole.  It could be described as an area of low ground surrounded by higher ground in all directions, or simply a hole in the ground.  Usually only depressions that are equal to or greater than the contour interval will be shown.  On maps, depressions are represented by closed contour lines that have tick marks pointing toward low ground 59
  • 60.
     Relief orterrain (also topographical relief) involves the vertical and horizontal dimensions of land surface.  The term bathymetry is used to describe underwater relief, while hypsometry studies terrain relative to sea level.  Relief (or local relief) refers specifically to the quantitative measurement of vertical elevation change in a landscape.  It is the difference between maximum and minimum elevations within a given area, usually of limited extent.  A relief can be described qualitatively, such as a "low relief" or "high relief" plain or upland. 60
  • 61.
     The reliefof a landscape can change with the size of the area over which it is measured, making the definition of the scale over which it is measured very important.  Because it is related to the slope of surfaces within the area of interest and to the gradient of any streams present, the relief of a landscape is a useful metric in the study of the Earth's surface.  In physical geography, relief is the lay of the land.  This is usually expressed in terms of the elevation, slope, and orientation of terrain features.  Terrain affects surface water flow and distribution.  Over a large area, it can affect weather and climate patterns. 61
  • 62.
     Ways ofExpressing Relief The surface of the earth varies from place to place. Land features like plains, hills, plateaus, valleys, ridges, w/c make up the earth’s surface uneven are relief features. Relief is the representation of the shapes of hills, valleys, streams, or terrain features on the earth's surface  The reference or start point for vertical measurement of elevation on a standard map is the datum plane or mean sea level, the point halfway between high tide and low tide.  Elevation of a point on the earth's surface is the vertical distance 62
  • 63.
  • 64.
     There areseveral methods used by mapmakers to depict relief of a terrain. 1. Layer Tinting:  Layer tinting is a method of showing relief by color.  A different color is used for each band of elevation. Ex: Blue-represent the sea & other water bodies.  A legend is printed on the map margin to indicate the elevation range represented by each color.  However, this method does not allow the map user to determine the exact elevation of a specific point—only the range. 64
  • 65.
  • 66.
    2. Shaded Relief Shaded relief, or hill-shading, used in Cartographic relief depiction, shows the shape of the terrain in a realistic fashion by showing how the three-dimensional surface would be illuminated from a point light source.  A raster image that shows changes in elevation using light and shadows on terrain from a given angle and altitude of the sun.  Shaded relief maps show features on the surface, areas that are flat or have few features are smooth on the map, whereas areas with steep slopes and mountains appear more rough. 66
  • 67.
     Relief shadingindicates relief by a shadow effect achieved by tone and color-that results in the darkening of one side of terrain features, such as hills and ridges.  The darker the shading, the steeper the slope.  Shaded relief is sometimes used in conjunction with contour lines to emphasize these features 67
  • 68.
    3. Hachures  Hachuresare strokes (short line segments or curves) drawn in the direction of the steepest slope (the aspect direction).  Steeper slopes are represented by thicker, shorter strokes, while gentler slopes are represented by thinner, longer and farther apart strokes. 68