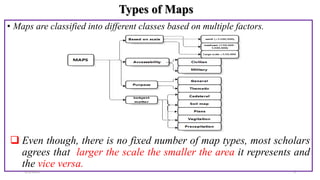
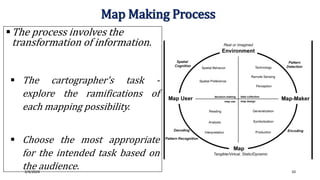
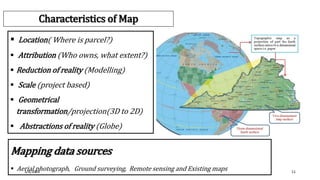
Basic Cartography and Image Interpretation
3/4/2024 1
Learning Objectives
• After completing this chapter, you will be able to:
 Read and interpret plans, maps, and drawings
 Explain the key features and functions of maps, plans and drawings
 Identify the marginal items used to convey information about the
features represented on maps
 Identify commonly used and conventional symbols and abbreviations
in maps
3/4/2024 2
READING AND INTERPRETING MAPS AND PLANS
• Cartography
• Basics of Map
• Why make Maps?
• Type of Map
• Map Making Process
• Characteristics of Map
• Data Source
• Map Scale and Computation
• Map Symbology
• Plan
• Coordinate System
3/4/2024 3
Cartography
• Originated from two Greek words “khartēs” means "map"; and graphein, "write").
• Thus, it is the science and art of making maps.
• The purpose of map making is to:
 Communicate geographic information in a graphic form as a digital image or a
paper map (analog).
 To position the surroundings, location and (eg. Where is something?) etc.
 Graphics better than description …….’A picture tells a thousand words’.
 Maps are an essential land information sources which exist in different;
oDocuments and
oWebsites in digital and analog form.
 A map is a graphical representation of real world (Earth, stars, solar system, a building,
etc…
Basics of Maps
3/4/2024 4
 Maps are a two-dimensional representation of the real world at a known scale of
selected phenomena.
 Features portrayed on a map exist in space in the actual world as a three dimensional.
Why Make Maps?
• To represent a larger area than we can see
• To show a phenomenon or process we can’t see with our eyes
• To present information concisely
• To show spatial relationships
Basics of Maps …Cont’d
3/4/2024 5
Types of Maps
• Maps are classified into different classes based on multiple factors.
 Even though, there is no fixed number of map types, most scholars
agrees that larger the scale the smaller the area it represents and
the vice versa.
3/4/2024 6
General Purpose Maps
• Political Maps: Maps showing the
political boundaries of states.
E.g.: World political map
• Physical Maps: Maps that demonstrate
physical landscape and associated features.
E.g.: World physical map
3/4/2024 7
Cont.…
• Topographic Maps: maps that shows the
topographic features on the earth.
e.g. Lake map
• Climate Maps: maps that demonstrate information
on climate condition, weather, and etc.
e.g.: world climate map
• LULC Maps: maps show how land is being used.
3/4/2024 8
Cadastral Map.
 A cadastral map shows the boundaries of every plot of
land (Parcel).
 It indicates the relationship of legal boundaries (the
spatial extents) of a given parcel and ownership right of
the property.
 It is the basis for legal aspects like ownership as well as
fiscal aspects like taxation of land.
 It also provides data for planning assignments (for
example, boundaries of constructions, land use, and
soil).
 Cadaster is all about the answers of where?‘ and how
3/4/2024 9
Map Making Process
The process involves the
transformation of information.
 The cartographer's task -
explore the ramifications of
each mapping possibility.
 Choose the most appropriate
for the intended task based on
the audience.
3/4/2024 10
Characteristics of Map
 Location( Where is parcel?)
 Attribution (Who owns, what extent?)
 Reduction of reality (Modelling)
 Scale (project based)
 Geometrical
transformation/projection(3D to 2D)
 Abstractions of reality (Globe)
Mapping data sources
 Aerial photograph, Ground surveying, Remote sensing and Existing maps
3/4/2024 11
Map Elements
• Maps are composed of a varying number of elements.
• There are potentially dozens of map elements but we focus here on a few key ones.
• Most maps contain the same common elements:
 Data Frame
 Map Legend
 Map Title
 North Arrow
 Map Scale
 Map Citation
Map Scale
• On the basis of their scale at which they are prepared maps can be categorized into:
• Large scale maps: that can be drawn at the scale 1:50,000
• Medium scale maps: which can be drawn at the scale between 1:50,000-1:500,000
• Small scale maps: those maps prepared at the scale  1:500,000
3/4/2024 12
𝑀𝑎𝑝 𝑆𝑐𝑎𝑙𝑒 =
𝑀𝑎𝑝 𝐷𝑖𝑠𝑡𝑎𝑛𝑐𝑒
𝐺𝑟𝑜𝑢𝑛𝑑 𝐷𝑖𝑠𝑡𝑎𝑛𝑐𝑒
=
𝐺𝑙𝑜𝑏𝑒 𝐷𝑖𝑠𝑡𝑎𝑛𝑐𝑒
𝐸𝑎𝑟𝑡ℎ𝐷𝑖𝑠𝑡𝑎𝑛𝑐𝑒
Mapprojection =
Map Distance
GlobeDistance
E.g.: a scale of 1:50,000 (1 unit on the map , 50,000 units on the ground)
Three ways of showing a scale on a map:
• Statement in words 1cm= 10km
• Representative fraction (R.F) e.g. 1:50000
• Linear Scale
Map
Scale…..Cont’d
3/4/2024 13
Example:
If the map distance obtained through measurement using a ruler on a given map
whose scale is 1: 25,000 is 8.5 cm so the ground distance will be calculated in the
following manner.
Multiply distance by scale: 8.5cm x 25,000 = 212,500
cm
Convert to meters: 212,500 / 100 =2,125 m
Convert to km: 2,125 / 1,000 =2.125 km
3/4/2024 14
Map Symbolization
• Symbolization is an important skill in cartography,
or map making.
• It is the process of choosing an appropriate
representation for specific features on a map.
• Symbols are a code instead of text.
• Basic building blocks of symbolization are
Geometry (points, lines, and areas) and
Visual variables (shape, size, hue/colour, and
value).
3/4/2024 15
3/4/2024 16
3/4/2024 17
3/4/2024 18
Plans
Plans are a set of drawings or two-dimensional
diagrams used to describe a place or object, or to
communicate design or construction instructions.
• It can be paper based or digital.
• Most planning applications require both a site
plan and location plan.
Site plan
Site plan is also known as a ‘block plan’ shows the
proposed development in relation to the property
boundary. It includes:
• The size and position of the existing building in
relation to the property boundary
• The position and use of any other buildings
within the property boundary
• The position and width of any adjacent streets.
3/4/2024 19
Plan…..Cont’d
Location Plan
• Location plan shows the proposed development
in relation to its surrounding properties.
Location plan is prepared based on an up-to-
date base map and produced at the scale of
either 1:1,250 for the urban areas and small
properties or 1:2,500 for rural areas and large
properties.
3/4/2024 20
Drawing is a form of visual art used to represent the visual world with no definite scale by
making of dots, lines and areas onto paper or other materials like walls. It is the oldest forms of
human expression within the visual art.
Drawing types can be categorized into various classes depending on the classification criteria,
such as:
and etc.
• Concept Drawing: Often freehand, that are used as a quick and simple way of
exploring initial ideas for designs.
• Working Drawing: Provide dimensioned, graphical information that can be
used; by a contractor to construct the works.
• Design Drawing: Used to develop and communicate ideas about a developing
design.
• Detail Drawing: provide a detailed description of the geometric form of a part of an
object such as a building, bridge, tunnel, machine, plant, and so on.
Types of Drawing and their Functions
3/4/2024 21
Coordinate System
• Coordinate system is a set of mathematical rules for specifying how coordinates are
to be assigned to points. Or, it is a system that uses numbers or coordinates to
determine the position of a point or geometric element within a geographic
framework.
• Coordinate systems enable geographic datasets to use common locations for
integration. It includes the definition of the coordinate axes, the units to be used and
the geometry of the axes.
• There are two types of coordinate systems:
• Geographic Coordinate Systems
• Projected Coordinate Systems
3/4/2024 22
Geographic Coordinate Systems (GCS): uses a three-
dimensional spherical surface to define locations on
the earth in the form of Latitude and Longitude (For
example: World Geodetic System 1984 (WGS 84))
Projected Coordinate Systems (PCS):
• is defined on a flat, two-dimensional surface.
• It is always based on a GCS that is based on a
sphere or spheroid and include a map projection.
projection.
• For example: Universal Transverse Mercator
projection (UTM).
Geographic Coordinate Systems
3/4/2024 23
Latitude is the Y axis, longitude is the X axis

carthography and map reading for all.pptx

  • 1.
    Basic Cartography andImage Interpretation 3/4/2024 1
  • 2.
    Learning Objectives • Aftercompleting this chapter, you will be able to:  Read and interpret plans, maps, and drawings  Explain the key features and functions of maps, plans and drawings  Identify the marginal items used to convey information about the features represented on maps  Identify commonly used and conventional symbols and abbreviations in maps 3/4/2024 2
  • 3.
    READING AND INTERPRETINGMAPS AND PLANS • Cartography • Basics of Map • Why make Maps? • Type of Map • Map Making Process • Characteristics of Map • Data Source • Map Scale and Computation • Map Symbology • Plan • Coordinate System 3/4/2024 3
  • 4.
    Cartography • Originated fromtwo Greek words “khartēs” means "map"; and graphein, "write"). • Thus, it is the science and art of making maps. • The purpose of map making is to:  Communicate geographic information in a graphic form as a digital image or a paper map (analog).  To position the surroundings, location and (eg. Where is something?) etc.  Graphics better than description …….’A picture tells a thousand words’.  Maps are an essential land information sources which exist in different; oDocuments and oWebsites in digital and analog form.  A map is a graphical representation of real world (Earth, stars, solar system, a building, etc… Basics of Maps 3/4/2024 4
  • 5.
     Maps area two-dimensional representation of the real world at a known scale of selected phenomena.  Features portrayed on a map exist in space in the actual world as a three dimensional. Why Make Maps? • To represent a larger area than we can see • To show a phenomenon or process we can’t see with our eyes • To present information concisely • To show spatial relationships Basics of Maps …Cont’d 3/4/2024 5
  • 6.
    Types of Maps •Maps are classified into different classes based on multiple factors.  Even though, there is no fixed number of map types, most scholars agrees that larger the scale the smaller the area it represents and the vice versa. 3/4/2024 6
  • 7.
    General Purpose Maps •Political Maps: Maps showing the political boundaries of states. E.g.: World political map • Physical Maps: Maps that demonstrate physical landscape and associated features. E.g.: World physical map 3/4/2024 7
  • 8.
    Cont.… • Topographic Maps:maps that shows the topographic features on the earth. e.g. Lake map • Climate Maps: maps that demonstrate information on climate condition, weather, and etc. e.g.: world climate map • LULC Maps: maps show how land is being used. 3/4/2024 8
  • 9.
    Cadastral Map.  Acadastral map shows the boundaries of every plot of land (Parcel).  It indicates the relationship of legal boundaries (the spatial extents) of a given parcel and ownership right of the property.  It is the basis for legal aspects like ownership as well as fiscal aspects like taxation of land.  It also provides data for planning assignments (for example, boundaries of constructions, land use, and soil).  Cadaster is all about the answers of where?‘ and how 3/4/2024 9
  • 10.
    Map Making Process Theprocess involves the transformation of information.  The cartographer's task - explore the ramifications of each mapping possibility.  Choose the most appropriate for the intended task based on the audience. 3/4/2024 10
  • 11.
    Characteristics of Map Location( Where is parcel?)  Attribution (Who owns, what extent?)  Reduction of reality (Modelling)  Scale (project based)  Geometrical transformation/projection(3D to 2D)  Abstractions of reality (Globe) Mapping data sources  Aerial photograph, Ground surveying, Remote sensing and Existing maps 3/4/2024 11
  • 12.
    Map Elements • Mapsare composed of a varying number of elements. • There are potentially dozens of map elements but we focus here on a few key ones. • Most maps contain the same common elements:  Data Frame  Map Legend  Map Title  North Arrow  Map Scale  Map Citation Map Scale • On the basis of their scale at which they are prepared maps can be categorized into: • Large scale maps: that can be drawn at the scale 1:50,000 • Medium scale maps: which can be drawn at the scale between 1:50,000-1:500,000 • Small scale maps: those maps prepared at the scale  1:500,000 3/4/2024 12
  • 13.
    𝑀𝑎𝑝 𝑆𝑐𝑎𝑙𝑒 = 𝑀𝑎𝑝𝐷𝑖𝑠𝑡𝑎𝑛𝑐𝑒 𝐺𝑟𝑜𝑢𝑛𝑑 𝐷𝑖𝑠𝑡𝑎𝑛𝑐𝑒 = 𝐺𝑙𝑜𝑏𝑒 𝐷𝑖𝑠𝑡𝑎𝑛𝑐𝑒 𝐸𝑎𝑟𝑡ℎ𝐷𝑖𝑠𝑡𝑎𝑛𝑐𝑒 Mapprojection = Map Distance GlobeDistance E.g.: a scale of 1:50,000 (1 unit on the map , 50,000 units on the ground) Three ways of showing a scale on a map: • Statement in words 1cm= 10km • Representative fraction (R.F) e.g. 1:50000 • Linear Scale Map Scale…..Cont’d 3/4/2024 13
  • 14.
    Example: If the mapdistance obtained through measurement using a ruler on a given map whose scale is 1: 25,000 is 8.5 cm so the ground distance will be calculated in the following manner. Multiply distance by scale: 8.5cm x 25,000 = 212,500 cm Convert to meters: 212,500 / 100 =2,125 m Convert to km: 2,125 / 1,000 =2.125 km 3/4/2024 14
  • 15.
    Map Symbolization • Symbolizationis an important skill in cartography, or map making. • It is the process of choosing an appropriate representation for specific features on a map. • Symbols are a code instead of text. • Basic building blocks of symbolization are Geometry (points, lines, and areas) and Visual variables (shape, size, hue/colour, and value). 3/4/2024 15
  • 16.
  • 17.
  • 18.
  • 19.
    Plans Plans are aset of drawings or two-dimensional diagrams used to describe a place or object, or to communicate design or construction instructions. • It can be paper based or digital. • Most planning applications require both a site plan and location plan. Site plan Site plan is also known as a ‘block plan’ shows the proposed development in relation to the property boundary. It includes: • The size and position of the existing building in relation to the property boundary • The position and use of any other buildings within the property boundary • The position and width of any adjacent streets. 3/4/2024 19
  • 20.
    Plan…..Cont’d Location Plan • Locationplan shows the proposed development in relation to its surrounding properties. Location plan is prepared based on an up-to- date base map and produced at the scale of either 1:1,250 for the urban areas and small properties or 1:2,500 for rural areas and large properties. 3/4/2024 20
  • 21.
    Drawing is aform of visual art used to represent the visual world with no definite scale by making of dots, lines and areas onto paper or other materials like walls. It is the oldest forms of human expression within the visual art. Drawing types can be categorized into various classes depending on the classification criteria, such as: and etc. • Concept Drawing: Often freehand, that are used as a quick and simple way of exploring initial ideas for designs. • Working Drawing: Provide dimensioned, graphical information that can be used; by a contractor to construct the works. • Design Drawing: Used to develop and communicate ideas about a developing design. • Detail Drawing: provide a detailed description of the geometric form of a part of an object such as a building, bridge, tunnel, machine, plant, and so on. Types of Drawing and their Functions 3/4/2024 21
  • 22.
    Coordinate System • Coordinatesystem is a set of mathematical rules for specifying how coordinates are to be assigned to points. Or, it is a system that uses numbers or coordinates to determine the position of a point or geometric element within a geographic framework. • Coordinate systems enable geographic datasets to use common locations for integration. It includes the definition of the coordinate axes, the units to be used and the geometry of the axes. • There are two types of coordinate systems: • Geographic Coordinate Systems • Projected Coordinate Systems 3/4/2024 22
  • 23.
    Geographic Coordinate Systems(GCS): uses a three- dimensional spherical surface to define locations on the earth in the form of Latitude and Longitude (For example: World Geodetic System 1984 (WGS 84)) Projected Coordinate Systems (PCS): • is defined on a flat, two-dimensional surface. • It is always based on a GCS that is based on a sphere or spheroid and include a map projection. projection. • For example: Universal Transverse Mercator projection (UTM). Geographic Coordinate Systems 3/4/2024 23 Latitude is the Y axis, longitude is the X axis