The document discusses cardiovascular physiology, including:
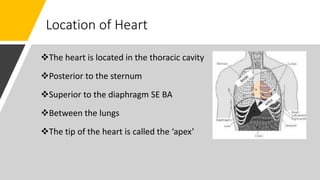
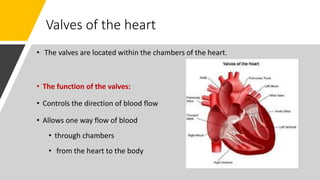
- The location of the heart in the thoracic cavity between the lungs.
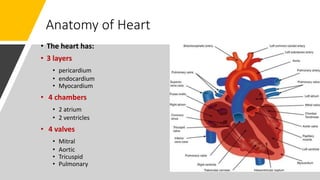
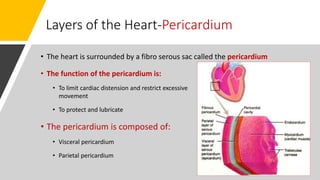
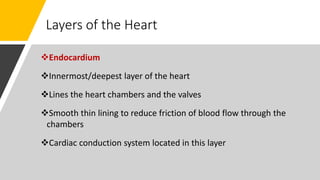
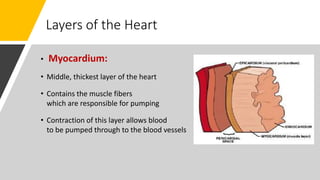
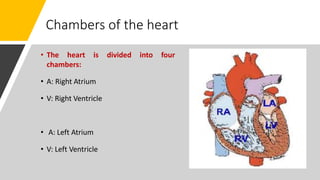
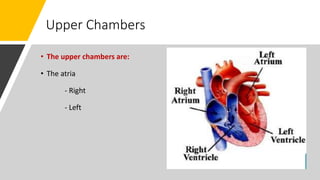
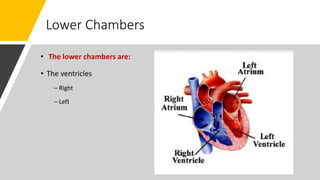
- The three layers of the heart - pericardium, endocardium, and myocardium - and its four chambers - two atria and two ventricles.
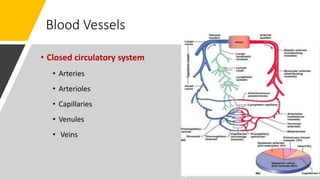
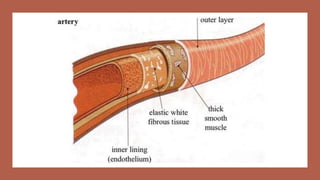
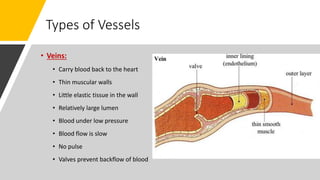
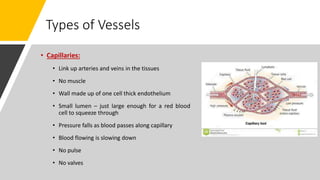
- The heart pumps oxygenated blood to the body and deoxygenated blood returns to the heart through arteries, veins and capillaries.
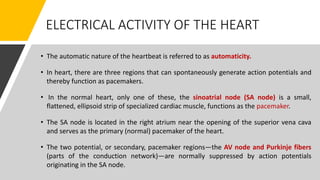
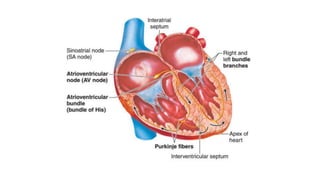
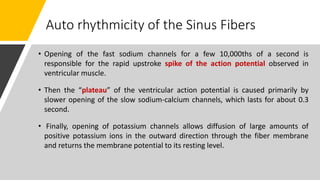
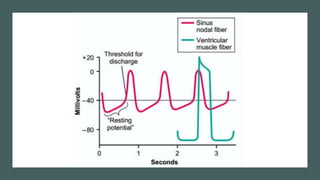
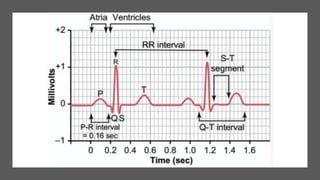
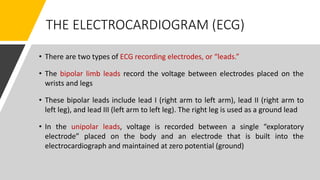
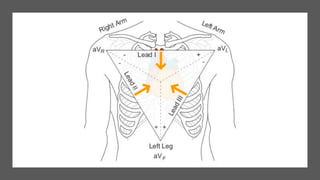
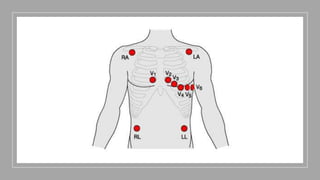
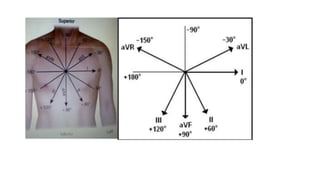
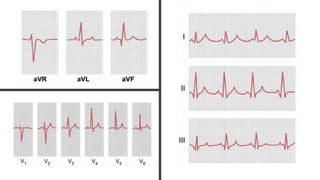
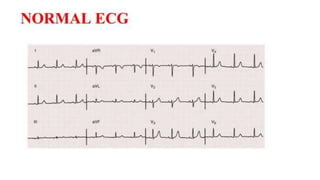
- The electrical conduction system generates heartbeats and the electrocardiogram can be used to measure heart rate and rhythm.