By Maximilian J. Pany, Michael E. Chernew, and Leemore S. Dafny
Regulating Hospital Prices Based
On Market Concentration Is Likely
To Leave High-Price Hospitals
Unaffected
ABSTRACT Concern about high hospital prices for commercially insured
patients has motivated several proposals to regulate these prices. Such
proposals often limit regulations to highly concentrated hospital
markets. Using a large sample of 2017 US commercial insurance claims,
we demonstrate that under the market definition commonly used in
these proposals, most high-price hospitals are in markets that would be
deemed competitive or “moderately concentrated,” using antitrust
guidelines. Limiting policy actions to concentrated hospital markets,
particularly when those markets are defined broadly, would likely result
in poor targeting of high-price hospitals. Policies that target the
undesired outcome of high price directly, whether as a trigger or as a
screen for action, are likely to be more effective than those that limit
action based on market concentration.
H
igh and rising hospital prices in
commercial insurance markets
pose a significant challenge for
containing health care spend-
ing.1 Given substantial evidence
that hospital consolidation causes price in-
creases,2,3 federal and state agencies in the US
have invested significant effort in investigating
mergers and (in some cases) monitoring post-
merger conduct.4 Authorities have also mounted
challenges to practices such as anti-tiering and
anti-steering provisions in contracts, which
heighten the bargaining leverage of dominant
health care systems.5 More recently, policy mak-
ers and think tanks have introduced proposals to
regulate prices directly in concentrated provider
markets.6–8
The motivation for linking price regulation
to market structure stems from the “structure-
conduct-performance” (SCP) paradigm in eco-
nomics,9 in which market structure, often mea-
sured by the degree of market concentration
among firms, directly affects the conduct of
firms in the market, which in turn affects the
performance of that market (for example, the
extent to which prices are “marked up” over
costs). Yet there are important conceptual and
measurement issues with this approach. Concep-
tually, the link between structure and conduct is
weak in many settings because of complex in-
centives and institutional details. Duopolists
may (implicitly or explicitly) collude or, alterna-
tively, compete vigorously on price, depending
on a range of factors outside of structure. In the
case of hospitals, markets in which many pa-
tients are enrolled in narrow-network insurance
plans are likely to be more competitive than
structurally identical markets with limited up-
take of such plans.
Difficulty in defining a “market” is a second
obstacle to applying the “structure-conduct-
performance” paradigm. Markets defined nar-
rowly (in terms of geography or provider type)
will generally appear less competitive than those
defined broadly. M ...
By Maximilian J. Pany, Michael E. Chernew, and Leemore S. Dafn
1. By Maximilian J. Pany, Michael E. Chernew, and Leemore S.
Dafny
Regulating Hospital Prices Based
On Market Concentration Is Likely
To Leave High-Price Hospitals
Unaffected
ABSTRACT Concern about high hospital prices for
commercially insured
patients has motivated several proposals to regulate these
prices. Such
proposals often limit regulations to highly concentrated hospital
markets. Using a large sample of 2017 US commercial insurance
claims,
we demonstrate that under the market definition commonly used
in
these proposals, most high-price hospitals are in markets that
would be
deemed competitive or “moderately concentrated,” using
antitrust
guidelines. Limiting policy actions to concentrated hospital
markets,
particularly when those markets are defined broadly, would
likely result
in poor targeting of high-price hospitals. Policies that target the
undesired outcome of high price directly, whether as a trigger or
as a
screen for action, are likely to be more effective than those that
limit
action based on market concentration.
2. H
igh and rising hospital prices in
commercial insurance markets
pose a significant challenge for
containing health care spend-
ing.1 Given substantial evidence
that hospital consolidation causes price in-
creases,2,3 federal and state agencies in the US
have invested significant effort in investigating
mergers and (in some cases) monitoring post-
merger conduct.4 Authorities have also mounted
challenges to practices such as anti-tiering and
anti-steering provisions in contracts, which
heighten the bargaining leverage of dominant
health care systems.5 More recently, policy mak-
ers and think tanks have introduced proposals to
regulate prices directly in concentrated provider
markets.6–8
The motivation for linking price regulation
to market structure stems from the “structure-
conduct-performance” (SCP) paradigm in eco-
nomics,9 in which market structure, often mea-
sured by the degree of market concentration
among firms, directly affects the conduct of
firms in the market, which in turn affects the
performance of that market (for example, the
extent to which prices are “marked up” over
costs). Yet there are important conceptual and
measurement issues with this approach. Concep-
tually, the link between structure and conduct is
weak in many settings because of complex in-
centives and institutional details. Duopolists
may (implicitly or explicitly) collude or, alterna-
4. Health Care Policy, Harvard
Medical School.
Leemore S. Dafny is the
Bruce V. Rauner Professor of
Business Administration at
Harvard Business School and
the Harvard Kennedy School,
Harvard University, in
Cambridge, Massachusetts.
1386 Health Affairs September 2021 40:9
Considering Health Spending
Downloaded from HealthAffairs.org on December 14, 2021.
Copyright Project HOPE—The People-to-People Health
Foundation, Inc.
For personal use only. All rights reserved. Reuse permissions at
HealthAffairs.org.
one community hospital) will be less competitive
than those with the same number of firms that
are more similar. These nuances limit the effec-
tiveness of tying regulation to crude measures of
concentration. Although market definitions can
be tailored, doing so on a national scale is diffi-
cult and requires more detailed data than are
readily available.
These challenges weaken the connection be-
tween market structure and profit margins or
prices, making it likely that some hospitals in
5. “unconcentrated” markets possess and exercise
some market power. Thus, relying on market
concentration–based triggers for regulation or
antitrust policy, particularly when markets are
defined broadly, is unlikely to effectively target
many hospitals whose prices are elevated as a
result of market power.
This concern is not merely theoretical. Think-
tank proposals as well as two pieces of legislation
recently introduced in Congress rely on mea-
sures of market structure, such as provider mar-
ket shares or the Herfindahl-Hirschman Index
(HHI), to trigger regulatory action to promote
competition in targeted markets. For instance,
the Bipartisan Policy Center’s “Bipartisan Rx for
America’s HealthCare” proposes that hospitals
in markets with HHIs exceeding 4,000 and lo-
cated in counties with populations at or above
the US median be required to enter into nego-
tiations with the Federal Trade Commission
(FTC) to bring their HHI below 4,000 or have
their prices capped at a percentage of Medicare
Advantage rates.6 The Hospital Competition Act
of 2019 (H.R. 506) would require hospitals with
market shares of 15 percent or more in markets
with HHIs exceeding 4,000 in urban areas and
5,000 in rural areas to accept Medicare rates
from commercial payers.7 The Fair Care Act of
2019 (H.R. 1332) includes the same provision.8
Price regulation efforts such as these intend to
prevent providers in uncompetitive markets
from exercising their pricing power. Market
structure–based triggers for price regulation
are insufficient, however, if providers in struc-
6. turally competitive markets nonetheless possess
market power that allows them to demand
higher prices without having to provide higher
quality warranting those prices.
Using a combination of more recent and more
comprehensive data than used in prior studies,
we analyze variation in hospital prices after ad-
justing for variation in area wages and relate the
adjusted price levels to market concentration.
We report two key findings. First, high-price hos-
pitals, defined as those in the top quartile of the
adjusted national price distribution, were preva-
lent across the concentration spectrum. Specifi-
cally, they were prevalent within all four concen-
tration categories we examined, which include
the three categories used by antitrust regulators
that are delineated by HHI thresholds of 1,500
and 2,500, and an additional policy-relevant cat-
egory, delineated by an HHI threshold of 4,000.
Second, the majority of these high-price hospi-
tals are located in the bottom two categories,
which are “unconcentrated” or “moderately con-
centrated” markets, per the Horizontal Merger
Guidelines of the FTC and Department of Jus-
tice (DOJ).10
Our findings are relevant to current proposals
to selectively regulate providers in highly con-
centrated markets. This approach will leave a
substantial number of high-price providers un-
affected. The findings also illustrate the short-
comings of relying too heavily on measures of
market structure when evaluating potential trig-
gers for regulatory or antitrust review in this
7. sector, specifically if authorities rely on untail-
ored, commonly used geographic market defi-
nitions.
Conceptual Framework
We divide providers into four categories, defined
by price (low or high) and market concentration
(low-to-moderate or high) (see exhibit A1 in the
online appendix).11 Low-price providers, wheth-
er in markets with low-to-moderate or high con-
centration, typically do not generate concern as
long as they are financially solvent. Existing pol-
icy proposals tend to target high-price hospitals
(or hospitals with high market shares) in con-
centrated markets. Yet because of a range of in-
stitutional features, including insurance, which
shields patients from the price of care, informa-
tion problems, and product differentiation
based on location or reputation, many hospitals
in low-concentration markets may have market
power and thus charge high prices. In this article
we document the prevalence of hospitals in the
category of high price/low-to-moderate market
concentration.We argue that policies to address
high prices should be crafted to address those
hospitals as well.
Study Data And Methods
Data To measure hospital prices, we used 2017
claims data from the Health Care Cost Institute
(HCCI)12 for all hospital inpatient and outpatient
facility services delivered to adults ages 18–64
with commercial employer-sponsored health in-
surance from one of three national insurers. This
sample includes more than forty million individ-
uals annually. To measure hospital market struc-
8. ture, we calculated market HHIs using the num-
ber of admissions reported by general acute care
September 2021 40:9 Health Affairs 1387
Downloaded from HealthAffairs.org on December 14, 2021.
Copyright Project HOPE—The People-to-People Health
Foundation, Inc.
For personal use only. All rights reserved. Reuse permissions at
HealthAffairs.org.
hospitals in the 2017 American Hospital Associ-
ation (AHA) Annual Survey,13 together with
Torch Insight data on system affiliation for each
hospital.14
Measuring Hospital Prices Using HCCI
data, we constructed separate inpatient facility
and outpatient facility samples, in each case re-
stricting the sample to facility claims of general
acute care hospitals with valid service codes, pos-
itive allowed amounts (the total paid for the ser-
vice by insurer and patient), and appropriate
place-of-service codes (see supplemental details
in appendix section 2.1).11 We excluded non-
group insurance claims, Medicare claims, and
claims indicating secondary coverage.We identi-
fied inpatient facility services by their diagnosis-
related group (DRG) and outpatient facility ser-
vices by their Current Procedural Terminology
(CPT) code. For the purpose of price measure-
ment, we treated distinct Centers for Medicare
and Medicaid Services (CMS) Certification
Numbers (CCNs) in distinct markets as unique
9. hospitals. We adjusted market concentration
measures for common hospital ownership, as
discussed below. We aggregated claim lines to
the patient-admission-hospital-DRG level in our
inpatient facility sample and to the patient-visit-
hospital-CPT-code level in our outpatient facility
sample; the sum of allowed amounts is our mea-
sure of price for each inpatient or outpatient
facility visit. To adjust for geographic variation
in area wages, a key input cost, we divided all
prices by the Medicare wage index for the rele-
vant market. Following the literature, we exclud-
ed hospitals with fewer than fifty cases annually
(at the hospital-market level) and excluded the
top and bottom 1 percent of most expensive cases
for each DRG or CPT code.15
To characterize price variation across hospi-
tals, we first calculated an implied price index for
each hospital in our inpatient facility and outpa-
tient facility samples by repricing claims to their
national service-specific means and dividing ob-
served hospital spending by repriced hospital
spending, using the services actually delivered
by each hospital.16 This approach, used by the
Institute of Medicine’s report on geographic var-
iation17 and by the HCCI,18 among others, mea-
sures how much prices at any given hospital de-
viate from national average prices for the
services delivered at that hospital. A value great-
er than 1 implies that a particular hospital has
relatively high prices, and a value less than 1
implies the opposite. Crucially, the implied price
index reflects differences in service mix across
hospitals. An advantage of this measure is that it
allowed us to include a large sample of hospitals.
10. The results were robust to other price indices
based on fixed market baskets of services (see
appendix section 4.2.2 for details),11 but those
approaches necessitated that we drop many hos-
pitals that did not provide enough volume for
some of the services in the market basket.
Identifying High-Price Hospitals And
Their Volume Weidentified high-price hospitals
irrespective of market by flagging hospitals in
the upper quartile of the national wage index–
adjusted price distribution in our HCCI samples.
We used the number of inpatient facility admis-
sions or outpatient facility visits, respectively,
when calculating the share of inpatient facility
or outpatient facility services delivered by high-
price hospitals. Additional details, as well as sen-
sitivity analyses that define “high-price” hospital
using different national percentiles, are in the
appendix.11
Measuring Hospital Market Structure To
align with existing policy proposals, our primary
market definition is the hospital referral region
(HRR).7,8 Because one approach to expanding
the reach of concentration-based policy pro-
posals would be to narrow the market definition,
we also report results using smaller market def-
initions, specifically Metropolitan Statistical
Areas (MSAs), commuting zones, and hospital
service areas (HSAs). We constructed system-
adjusted market-level HHIs by summing the
squared market share of total hospital admis-
sions attributable to each health care system in
each market. These HHIs reflect the concentra-
11. tion of market power that arises because hospi-
tals belonging to the same health system typical-
ly negotiate jointly with area insurers. In the
appendix (section 4.2.5)11 we present sensitivity
analyses that use the Agency for Healthcare Re-
search and Quality’s 2018 Compendium of US
Health Systems files, instead of Torch Insight
data, to link hospitals to health care systems.19
We grouped markets by their HHIs into four
policy-relevant categories of concentration. We
began with the three categories used in antitrust
analysis: markets classified by the FTC and DOJ
as “unconcentrated” (HHI below 1,500), “mod-
erately concentrated” (HHI between 1,500 and
2,500), and “concentrated” (HHI above
2,500).10 Based on language in recently pro-
posed price regulation proposals,6–8 we further
subdivided “concentrated” markets into those
with an HHI score between 2,500 and 4,000
and those with an HHI above 4,000, yielding
four categories.
Limitations Our analysis had several limita-
tions. First, the HCCI data are a convenience
sample of health care claims from three large
insurers (Humana, Aetna, and UnitedHealth-
care), not a random sample of all commercially
insured enrollees in the US. In particular, our
version of the data (HCCI 1.0) does not contain
Considering Health Spending
1388 Health Affairs September 2021 40:9
Downloaded from HealthAffairs.org on December 14, 2021.
12. Copyright Project HOPE—The People-to-People Health
Foundation, Inc.
For personal use only. All rights reserved. Reuse permissions at
HealthAffairs.org.
claims fromsmallerand regionalinsurers, which
may pay different prices than do the large nation-
al insurers, or from Blue Cross Blue Shield affili-
ates, which have significant market share in
most states.20 Although the HCCI data include
claims from almost all hospitals registered with
the AHA, they cover a smaller fraction of these
hospitals after we applied our hospital case
threshold (fifty claims). The prevalence of high-
price hospitals across the concentration spec-
trum may differ for hospitals excluded from
our price measurement sample, which may have
affected our prevalence estimates (see appendix
section 2.4 for more information on included
and excluded providers).11 The HCCI data do,
however, cover more than a fourth of the private-
ly insured US population across employers of all
sizes.15 Because of the large sample size and be-
cause they include provider identifiers (as op-
posed to only market and service identifiers),
the HCCI data are well suited for our study of
cross-market variation in hospital prices. For
these reasons, many related studies also use
HCCI data.15,21–23 Because we used AHA, and
not HCCI, data to measure market concentra-
tion, our market structure measures did not de-
pend on the number of hospitals captured in the
HCCI data.
Second, we defined hospitals within markets
13. at the CCN level for the purpose of price mea-
surement. The CCN is an imperfect measure.
Multiple hospitals can bill or report to Medicare
under a single CCN, even if they are in distinct
geographic markets. A single hospital may also
split service lines into separate National Provid-
er Identifiers for billing—and potentially price
negotiation—purposes. Despite these limita-
tions, we adopted this provider identifier be-
cause it is used for payment by CMS and is there-
fore regularly monitored and updated, and
because other provider definitions have similar
limitations. Our results were robust to measur-
ing prices and volume at the level of billing-entity
National Provider Identifiers instead of CCNs
(see appendix section 4.2.4).11 In addition, we
report results not only for the number of unique
hospitals in each market concentration category
but also for the number of admissions or visits in
each category. These “volume-based analyses”
are likely less sensitive to situations in which
an organization splits service lines into subunits
for billing purposes. However, the volume-based
measures have a different limitation, in that they
reflect only claims in our HCCI samples, which
do not capture the full scope of business for
any provider. Unfortunately, we did not observe
volumes at the CCN level, and our volume mea-
sures do not reflect case-mix (see appendix sec-
tion 2.3).11
Fourth, we used an implied price measure that
included all services actually delivered by each
hospital in our sample. A limitation of this ap-
proach is that hospital markups may vary by
14. service line, and our approach did not hold the
market basket of services constant across hospi-
tals that offer different service lines. However,
the main alternative, a price index measure that
compares prices of a fixed basket of services
across hospitals, has the drawbacks of capturing
a smaller share of spending and greatly restrict-
ing the sample of hospitals and markets that
canbe analyzed without imputation. Theimplied
approach and the market-basket approach are
highly correlated.16 Appendix section 4.2.2
shows that our findings were robust to using a
market basket approach.11
Fifth, following existing policy proposals and
per common practice, we measured market con-
centration using the HHI, which we constructed
using the number of hospital admissions in the
AHA data. (Note that these HHIs are highly cor-
related [r > 0:95] with versions constructed us-
ing total patient revenues or number of staffed
beds). As discussed above, the HHI is an imper-
fect measure of competition when providers of-
fer differentiated products or market definitions
are not tailored. In addition, we used the HHI
based on inpatient facility admissions for anal-
yses of both inpatient facility and outpatient
facility prices. Although competition for outpa-
tient facility services is different, these differenc-
es largely arise because there are nonhospital
providers offering outpatient facility services.
As our sample was limited to hospital providers,
HHIs constructed on the basis of inpatient facili-
ty admissions are highly correlated with those
constructed on the basis of outpatient facility
visits (r > 0:86), and results using the two mea-
15. sures were qualitatively similar (appendix sec-
tion 4.2.1).11 We thus relied on HHIs based on
inpatient facility admissions for simplicity. To
the extent that there is a substantial number of
other, nonhospital competitors for various out-
patient facility service lines, markets currently
classified as highly concentrated would be real-
located to lower concentration categories if data
on these additional competitors were included,
reducing the potential reach of current pro-
posals.
Sixth, it is likely that geographic markets for
many services are much smaller than the HRR
(for example, labor and delivery or acute cardiac
care services). Indeed, some prior studies of the
relationship between market structure and price
have used much narrower geographic market
definitions (for example, hospitals within a fif-
teen-mile radius).15 Conversely, for some very
specialized services (for example, transplants),
September 2021 40:9 Health Affairs 1389
Downloaded from HealthAffairs.org on December 14, 2021.
Copyright Project HOPE—The People-to-People Health
Foundation, Inc.
For personal use only. All rights reserved. Reuse permissions at
HealthAffairs.org.
HRRs may understate the breadth of the market.
Some studies have eliminated quasi-arbitrary
geographic boundaries by constructing hospi-
tal-specific measures of competition, derived us-
16. ing data on patients’ choices in all areas from
which the hospital draws patients.24–26 Although
these alternatives are likely preferable to a fixed
geographic market definition for causal studies
of the effect of competition on prices, policy
typically relies on commonly available measures
of market structure. Our primary analysis used
the HRR because it is a common market defini-
tion and is the definition used by existing pro-
posals that specify a market definition.7,8 We
show how our estimates are affected by defining
geographic markets in terms of MSAs, commut-
ing zones, and HSAs.11
Finally, many variables not included in our
analysis (such as insurer market concentration)
may affect the relationship between hospital
market structure and hospital price. This omis-
sion was deliberate—we did not estimate a causal
relationship. In fact, our analysis highlights the
flaws in relying on one predictor or correlate of
the true outcome of interest.
Study Results
Prevalence Of High-Price Hospitals We
sought to investigate the proportion of high-
price hospitals within each of four HHI concen-
trationcategories.Definedas hospitals in thetop
quartile of the national, area wage index–adjust-
ed price distribution, high-price hospitals were
prevalent within each HHI category. Exhibit 1
shows that for inpatient services, high-price hos-
pitals constituted 26.5 percent of hospitals in
unconcentrated markets (HHI below 1,500),
20.9 percent in moderately concentrated mar-
17. kets (HHI between 1,500 and 2,500), 24.3 per-
cent in concentrated markets with HHI between
2,500 and 4,000, and 34.1 percent in concentrat-
ed markets with HHIabove 4,000. Foroutpatient
services, the proportions of high-price hospitals
were 28.8, 22.8, 23.1, and 25.4 percent, respec-
tively. These findings remained qualitatively
similar for alternative definitions of “high-price”
hospitals, hospital providers, and HHI measures
(see sensitivity analyses in appendix section
4.2).11
Results weresimilar whenwe evaluatedservice
volume rather the number of service providers,
except for outpatient services, where high-price
hospitals in unconcentrated markets garnered a
lower share (see appendix section 3.1).11
Market Locations Of High-Price Hospitals
We also examined the proportion of high-price
hospitals across HHI categories (exhibit 2).
High-price hospitals were more prevalent in
markets with low-to-moderate concentration
(HHI up to 2,500) versus high concentration
(HHI above 2,500). Specifically, for inpatient
services, 30.0 percent of high-price hospitals
were located in unconcentrated markets,
28.4 percent in moderately concentrated mar-
kets, 24.2 percent in concentrated markets with
HHI between 2,500 and 4,000, and 17.4 percent
in concentrated markets with HHI above 4,000.
For outpatient services, 34.9 percent of high-
price hospitals were located in unconcentrated
markets, 27.5 percent in moderately concentrat-
ed markets, 24.9 percent in concentrated mar-
kets with HHI between 2,500 and 4,000, and
18. 12.7 percent in concentrated markets with HHI
exceeding 4,000.
Likewise, most of the volume of high-price
hospitals was delivered in unconcentrated or
moderately concentrated markets (see appendix
section 3.1).11 For inpatient services, the share of
volume delivered by high-price hospitals in mar-
kets with HHI up to 2,500 was higher than the
share of hospitals in those markets (69.0 percent
of volume versus 58.4 percent of hospitals;
exhibit 2 and appendix exhibit AR2). For out-
patient services, the share of volume delivered
by high-price hospitals in markets with HHI
up to 2,500 was somewhat lower than the share
of hospitals in those markets (59.1 percent ver-
sus 62.4 percent; exhibit 2 and appendix ex-
hibit AR2).
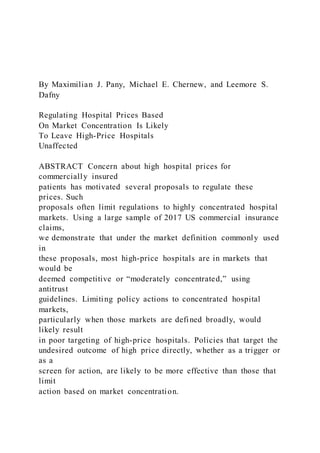
Exhibits 3 and 4 show the cumulative distribu-
tion of high-price hospitals across HHI values for
Exhibit 1
Prevalence of high-price hospitals in the US within market
concentration categories, 2017
Hospital market Herfindahl-Hirschman Index
<1,500
≥1,500 to
≤2,500
>2,500 to
≤4,000 >4,000
19. No. of
hospitals
Inpatient
High price 26.5% 20.9% 24.3% 34.1% 447
Not high price 73.5% 79.1% 75.7% 65.9% 1,340
No. of hospitals 505 608 445 229 1,787
Outpatient
High price 28.8% 22.8% 23.1% 25.4% 1,273
Not high price 71.2% 77.2% 76.9% 74.6% 3,816
No. of hospitals 1,541 1,535 1,374 639 5,089
SOURCE Authors’ analysis of Health Care Cost Institute data,
2017. NOTES Because this exhibit
shows within-market concentration category proportions,
column percentages sum to 100%, but row
percentages do not. The number of markets (hospital referral
regions) in each category is as follows.
Inpatient: <1,500, n = 25; ≥1,500 to ≤2,500, n = 68; >2,500 to
≤4,000, n = 103; >4,000,
n = 91. Outpatient: <1,500, n = 25; ≥1,500 to ≤2,500, n = 69;
>2,500 to ≤4,000, n = 110;
>4,000, n = 102. Number of hospitals and hospital prices are
measured at the Centers for
Medicare and Medicaid Services (CMS) Certification Number
(CCN)–market level in the 2017
Health Care Cost Institute data. High-price hospitals were
defined as those in the upper quartile of
the national wage index–adjusted price distribution in our
inpatient or outpatient sample. Hospital
market structure is measured at the system-adjusted CCN level
in terms of total admissions
recorded in the 2017 American Hospital Association Annual
20. Survey. Hospitals are general acute
care hospitals. See the text for additional details on sample
construction.
Considering Health Spending
1390 Health Affairs September 2021 40:9
Downloaded from HealthAffairs.org on December 14, 2021.
Copyright Project HOPE—The People-to-People Health
Foundation, Inc.
For personal use only. All rights reserved. Reuse permissions at
HealthAffairs.org.
four geographic market definitions. These defi-
nitions are, from the largest to the smallest
individual markets, HRRs, MSAs, commuting
zones, and HSAs. For both inpatient (exhibit 3)
and outpatient (exhibit 4) services, the number
of highly concentrated markets, and thus the
prevalence of high-price hospitals within those
markets, increased with each successively
smaller market definition. For the narrowest
market definition (the HSA, which is unconcen-
trated only in very urban areas), the estimated
prevalence of high-price hospitals in markets
that were not highly concentrated shrank to
14.3 percent for inpatient services (exhibit 3)
and to 23.1 percent for outpatient services
(exhibit 4). For all other market definitions stud-
ied, between a little more than a third and more
than half of high-price hospitals were located in
unconcentrated and moderately concentrated
markets.
21. These findings were qualitatively similar for
alternative definitions of “high-price” hospitals,
hospital providers, and HHI measures (see ap-
pendix section 4.2).11
Discussion
Our analysis complements and extends the ex-
isting literature on hospital price variation,
which highlights variation within and across ge-
ographies and, more recently, within hospitals
across insurers. Using claims data for approxi-
mately one-fourth of the US commercially in-
sured population in 2017, we constructed an in-
patient and outpatient price index for each US
Exhibit 2
Prevalence of high-price hospitals in the US across market
concentration categories, 2017
Hospital market Herfindahl-Hirschman Index
<1,500
≥1,500 to
≤2,500
>2,500 to
≤4,000 >4,000
No. of
hospitals
Inpatient
22. High price 30.0% 28.4% 24.2% 17.4% 447
Not high price 27.7% 35.9% 25.1% 11.3% 1,340
No. of hospitals 505 608 445 229 1,787
Outpatient
High price 34.9% 27.5% 24.9% 12.7% 1,273
Not high price 28.7% 31.1% 27.7% 12.5% 3,816
No. of hospitals 1,541 1,535 1,374 639 5,089
SOURCE Authors’ analysis of Health Care Cost Institute data,
2017. NOTES Because this exhibit
shows across-market concentration category proportions, row
percentages sum to 100% but column
percentages do not. The number of markets (hospital referral
regions) in each category is in the
exhibit 1 notes. Number of hospitals and hospital prices are
measured at the Centers for Medicare
and Medicaid Services (CMS) Certification Number (CCN)–
market level in the 2017 Health Care
Cost Institute data. High-price hospitals were defined as those
in the upper quartile of the national
wage index–adjusted price distribution in our inpatient or
outpatient sample. Hospital market
structure is measured at the system-adjusted CCN level in terms
of total admissions recorded in
the 2017 American Hospital Association Annual Survey.
Hospitals are general acute care hospitals.
See the text for additional details on sample construction.
Exhibit 3
Cumulative distribution of US hospitals with high inpatient
prices across concentration thresholds for four common
geographic market definitions, 2017
23. SOURCE Authors’ analysis of Health Care Cost Institute data,
2017. NOTES Vertical lines represent the market concentration
thresholds
used in the analysis: Herfindahl-Hirschman Indexes of 1,500,
2,500, and 4,000. Details on sample construction are in the
exhibit 2 notes
and the text.
September 2021 40:9 Health Affairs 1391
Downloaded from HealthAffairs.org on December 14, 2021.
Copyright Project HOPE—The People-to-People Health
Foundation, Inc.
For personal use only. All rights reserved. Reuse permissions at
HealthAffairs.org.
general acute care hospital with sufficient vol-
ume in our sample and examined the relation-
ship between the indices and the degree of hos-
pital market concentration.We found that when
we used the market definition common in policy
proposals, most high-price inpatient and out-
patient hospitals were not located in concentrat-
ed markets; in fact, more than a quarter of all
high-price hospitals were located in unconcen-
trated markets, or those with HHIs below 1,500.
Only 17.4 percent of all high-price hospitals
providing inpatient services and only 12.7 per-
cent of all high-price hospitals providing out-
patient services were located in the most concen-
trated HRR markets (those with HHI exceeding
4,000), even though about a third of the roughly
300 HRRs in our sample were that concentrated.
To some degree, this result reflects the fact
24. that more concentrated markets have fewer
providers—just under 13 percent of hospitals in
our sample were located in markets with HHI
greater than 4,000—but it also reflects the reality
that high-price providers were prevalent across
the spectrum of market concentration.
The prevalence of high-price hospitals across
the concentration spectrum did vary with the
geographic market definition (see exhibits 3
and 4). We focused on HRRs because they are
used in existing policy proposals. However,
the smaller the geographic boundaries of mar-
kets, the more concentrated the markets will
appear.Although therewerestillnontrivialnum-
bers of high-price hospitals in unconcentrated
and moderately concentrated markets using the
HSA, a very narrow market definition, these dif-
ferences underscore the sensitivity of proposed
policies to the choice of market definitions.
Policy Implications
The policy action needed to address high-price
providers in concentrated markets will likely en-
tail some form of regulation because unraveling
past mergers is very difficult, and some markets
might not be large enough to support multiple
providers. Crafting policy to address high-price
providers in less concentrated markets is more
controversial. Indeed, one rationale for regulat-
ing high-price providers in concentrated mar-
kets only is that consumers in those markets
have fewer alternatives and therefore cannot eas-
ily avoidhigh prices.Inunconcentrated markets,
consumers can, in theory, substitute away from
25. high-price providers, and pro-competitive strat-
egies are certainly worthwhile to pursue in those
markets. Some examples include limiting “all or
nothing” contracting by hospital systems or
encouraging benefit designs that have been
shown to put downward pressure on prices (such
as tiered networks or reference pricing), which
so far have been slow to diffuse in the US.27 Reg-
ulation restricting anticompetitive behaviors
Exhibit 4
Cumulative distribution of US hospitals with high outpatient
prices across concentration thresholds for four common
geographic market definitions, 2017
SOURCE Authors’ analysis of Health Care Cost Institute data,
2017. NOTES Vertical lines represent the market concentration
thresholds
used in the analysis: Herfindahl-Hirschman Indexes of 1,500,
2,500, and 4,000. Details on sample construction are in the
exhibit 2 notes
and the text.
Considering Health Spending
1392 Health Affairs September 2021 40:9
Downloaded from HealthAffairs.org on December 14, 2021.
Copyright Project HOPE—The People-to-People Health
Foundation, Inc.
For personal use only. All rights reserved. Reuse permissions at
HealthAffairs.org.
26. such as anti-tiering and most-favored-nation
clauses4,28 may also help reduce provider prices
or price growth in unconcentrated markets. But
myriad institutional factors such as insurance
coverage that insulates patients from the full
price of their care, barriers to price shopping,
differences in product mix, provider quality that
is difficult to discern, and regulatory capture by
providers make the path to success long and
uncertain.
One concern with policies that target high-
price hospitals, even when they are located in
unconcentrated markets, is that high-price hos-
pitals may provide higher-quality care that jus-
tifies their prices. However, the bulk of the liter-
atureto date finds price to be a very poor signal of
quality, and there is limited evidence to suggest
that price increases yield quality improve-
ments.29,30 For example, several studies docu-
ment enormous price variation even for stan-
dardized services for which objective quality
differences are minimal.15,31 Although a full dis-
cussion of the risks of price regulation was be-
yond the scope of this study, we note here that in
principle, reducing prices may adversely affect
quality, and it is unclear whether doing so would
decrease or improve the value of care. There cur-
rently is no consensus on the magnitude of any
effect of price reductions on provider quality.
Although pro-competitive reforms are taking
shape and will hopefully improve market perfor-
mance in many cases, many markets are likely to
be left behind, either because consolidation has
already occurred or because they are not able to
27. support many competing providers. Recent bi-
partisan proposals to regulate hospitals in highly
concentrated markets demonstrate an appetite
to curb the exercise of hospital market power.6–8
Our results suggest that if the goal is to cap the
highest excesses of pricing, policy makers can
narrow the market definition so that most mar-
kets are classified as noncompetitive, effectively
extending regulation to most high-price hospi-
tals. Yet many high-price hospitals would be
missed with even very narrow market definitions
such as the HSA. Alternatively, hospital price
regulation efforts may be more effective if they
are focused on the outcome of interest directly
(that is, provider prices) instead of market struc-
ture. In either case, policy makers could start
with modest approaches, such as capping the
highest prices, tracking outcomes and gradually
pushing the caps downward, and monitoring
trade-offs between savings and any unintended
consequences for access or quality.32
Conclusion
If commercial health care prices continue to in-
crease at their current pace, calls for price regu-
lation will grow louder. Clearly, the specifics of
regulation matter greatly.We show that hospital
market structure is a poor proxy for hospital
prices.Forthe marketdefinitions most common-
ly used in existing policy proposals, we found
that most high-pricehospitals arelocatedin mar-
kets with low or moderate concentration and
would therefore be exempt from regulation. Pol-
icies that address high prices regardless of the
28. underlying market structure would be more con-
sistent with a policy goal of constraining high
prices. In some cases, these policies may entail
promoting competition between hospitals in the
same market, but if there are not enough hospi-
tals in a market or if procompetitive policies are
not successful at lowering the upper tail of the
price distribution, regulation focusing on the
most expensive providers may be needed. ▪
The authors are grateful for support
from the Peterson Center on Healthcare
and Arnold Ventures. Maximilian Pany
received a training grant from the
National Institute on Aging (Grant No.
T32AG51108) and has received
compensation from the Brookings
Institution. He serves on the board of
trustees of the Massachusetts Medical
Society (unpaid). Michael Chernew has
research grants from Arnold Ventures,
Blue Cross Blue Shield Association,
Health Care Service Corporation,
National Institute on Aging, Ballad
Health, Commonwealth Fund, Signify
Health LLC, Agency for Healthcare
Research and Quality, and National
Institutes of Health; received personal
fees from MJH Life Sciences (American
Journal of Public Health), Elsevier,
MITRE, American Economic Review,
Commonwealth Fund, IDC Herzliya,
Madalena Consulting, Chilmark Research,
American College of Cardiology, Health
(at)Scale, Blue Cross Blue Shield of
29. Florida, Medaxiom, Humana, American
Medical Association, America’s Health
Insurance Plans, HealthEdge, RTI Health
Solution
s, Emory University, Washington
University, and University of
Pennsylvania; has equity in V-BID Health
(partner), Virta Health, Archway Health,
Curio Wellness (board of directors), and
Health(at)Scale; serves (or has served)
on advisory boards for the
Congressional Budget Office (panel of
health advisors), National Institute for
Health Care Management, National
Academies, AcademyHealth, National
Quality Forum, Blue Cross Blue Shield
Association, and Blue Health
Intelligence; is a board member for the
Health Care Cost Institute and the
Massachusetts Health Connector (vice
chair); and serves as the current chair of
the Medicare Payment Advisory
30. Commission. Leemore Dafny has served
as a consultant and litigation expert on
matters in the hospital and health
insurance sectors and has received
compensation from the Center for
Equitable Growth, Brookings Institution,
Cornerstone Research, Analysis Group,
Bates White Economic Consulting, and
Intermountain Healthcare. She serves on
paid boards for the Congressional
Budget Office (panel of health advisors)
and in unpaid advisory and editorial
roles for the Commonwealth Fund,
Management Science, and American
Economic Journal: Economic Policy. The
listed outside activities are unrelated to
the substance of this article unless
otherwise acknowledged. All opinions
expressed are those of the authors and
not any organization with which they are
affiliated.
September 2021 40:9 Health Affairs 1393
Downloaded from HealthAffairs.org on December 14, 2021.
31. Copyright Project HOPE—The People-to-People Health
Foundation, Inc.
For personal use only. All rights reserved. Reuse permissions at
HealthAffairs.org.
NOTES
1 Anderson GF, Hussey P, Petrosyan
V. It’s still the prices, stupid: why the
US spends so much on health care,
and a tribute to Uwe Reinhardt.
Health Aff (Millwood). 2019;38(1):
87–95.
2 Gaynor M, Ho K, Town RJ. The in-
dustrial organization of health-care
markets. J Econ Lit. 2015;53(2):
235–84.
3 Dafny L. Estimation and identifica-
tion of merger effects: an application
to hospital mergers. J Law Econ.
2009;52(3):523–50.
32. 4 Dafny LS. Health care industry con-
solidation: what is happening, why it
matters, and what public agencies
might want to do about it (testimony
of Leemore S. Dafny, Harvard Uni-
versity, Boston, MA) [Internet].
Washington (DC): House Committee
on Energy and Commerce, Subcom-
mittee on Oversight and Investiga-
tions; 2018 Feb 14 [cited 2021 Jul
13]. Available from: https://docs
.house.gov/meetings/IF/IF02/
20180214/106855/HHRG-115-IF02-
Wstate-DafnyL-20180214.pdf
5 United States of America and the State
of North Carolina v. The Charlotte-
Mecklenburg Hospital Authority, d/b/a
Carolinas Healthcare System [Inter-
net]. Charlotte (NC): United States
District Court for the Western Dis-
trict of North Carolina Charlotte
Division; 2016 Jun 9 [cited 2021 Jul
13]. (Case 3:16-cv-00311). Available
33. from: https://www.justice.gov/atr/
file/867111/download
6 Hayes K, Hoagland GW,
Harootunian L, McDonough D,
Salyers E, Serafini MW, et al.
Bipartisan Rx for America’s health
care [Internet]. Washington (DC):
Bipartisan Policy Center; 2020 Feb 5
[cited 2021 Jul 13]. Available from:
https://bipartisanpolicy.org/report/
bipartisan-rx/
7 H.R. 506—Hospital Competition Act
of 2019 [Internet]. Washington
(DC): 116th Congress; 2019 [cited
2021 Jul 13]. Available from: https://
www.congress.gov/bill/116th-
congress/house-bill/506/text
8 H.R. 1332—Fair Care Act of 2019
[Internet]. Washington (DC): 116th
Congress; 2019 [cited 2021 Jul 13].
Available from: https://www
.congress.gov/bill/116th-congress/
34. house-bill/1332/text
9 Bain JS. Industrial organization.
New York (NY): Wiley; 1959.
10 Department of Justice, Federal Trade
Commission. Horizontal merger
guidelines [Internet]. Washington
(DC): DOJ; 2010 Aug 19 [cited 2021
Jul 13]. Available from: https://
www.justice.gov/atr/horizontal-
merger-guidelines-08192010
11 To access the appendix, click on the
Details tab of the article online.
12 Health Care Cost Institute. Data
[home page on the Internet].
Washington (DC): HCCI; [cited 2021
Jul 13]. Available from: https://
healthcostinstitute.org/data
13 American Hospital Association. AHA
Annual Survey DatabaseTM [Inter-
35. net]. Chicago (IL): AHA; [cited 2021
Jul 13]. Available from: https://
www.ahadata.com/aha-annual-
survey-database
14 Torch Insight. Healthcare analytics
[home page on the Internet]. Seattle
(WA): Torch Insight; [cited 2021 Jul
13]. Available from: https://torch
insight.com/
15 Cooper Z, Craig SV, Gaynor M, Van
Reenen J. The price ain’t right?
Hospital prices and health spending
on the privately insured. Q J Econ.
2019;134(1):51–107.
16 Neprash HT, Wallace J, Chernew
ME, McWilliams JM. Measuring
prices in health care markets using
commercial claims data. Health Serv
Res. 2015;50(6):2037–47.
17 Institute of Medicine. Variation in
health care spending: target decision
36. making not geography. Washington
(DC): National Academies Press;
2013 Oct.
18 Health Care Cost Institute. 2017
health care cost and utilization re-
port: analytic methodology [Inter-
net]. Washington (DC): HCCI; 2019
Feb 25 [cited 2021 Jul 13]. Available
from: https://healthcostinstitute
.org/images/pdfs/HCCI_2017_
Methodology_public_v20.pdf
19 Agency for Healthcare Research and
Quality. Compendium of U.S. health
systems, 2018 [Internet]. Rockville
(MD): AHRQ; 2019 Nov [cited 2021
Aug 9]. Available from: https://www
.ahrq.gov/chsp/data-resources/
compendium-2018.html
20 Henry J. Kaiser Family Foundation.
Market share and enrollment of
largest three insurers—large group
market [Internet]. San Francisco
37. (CA): KFF; 2019 [cited 2021 Jul 13].
Available from: https://www.kff
.org/other/state-indicator/market-
share-and-enrollment-of-largest-
three-insurers-large-group-market/
21 Cooper Z, Craig S, Gray C, Gaynor M,
Van Reenen J. Variation in health
spending growth for the privately
insured from 2007 to 2014. Health
Aff (Millwood). 2019;38(2):230–6.
22 Cooper Z, Craig S, Gaynor M, Harish
NJ, Krumholz HM, Van Reenen J.
Hospital prices grew substantially
faster than physician prices for
hospital-based care in 2007–14.
Health Aff (Millwood). 2019;38(2):
184–9.
23 Pelech D. An analysis of private-
sector prices for physician services
[Internet]. Paper presented at: Aca-
demyHealth Annual Research Meet-
38. ing; 2017 Jun 26; New Orleans, LA
[cited 2021 Jul 29]. Available from:
https://www.cbo.gov/system/files/
115th-congress-2017-2018/
presentation/52818-dp-presentation
.pdf
24 Kessler DP, McClellan MB. Is hos-
pital competition socially wasteful?
Q J Econ. 2000;115(2):577–615.
25 Town R, Vistnes G. Hospital com-
petition in HMO networks. J Health
Econ. 2001;20(5):733–53.
26 Gozvrisankaran G, Town RJ. Com-
petition, payers, and hospital quali-
ty. Health Serv Res. 2003;
38(6 Pt 1):1403–21.
27 Mehrotra A, Chernew ME, Sinaiko
AD. Promise and reality of price
transparency. N Engl J Med.
2018;378(14):1348–54.
39. 28 Gaynor M. What to do about health-
care markets? Policies to make
health-care markets work [Internet].
Washington (DC): Hamilton Project;
2020 Mar [cited 2021 Jul 28].
Available from: https://www
.hamiltonproject.org/papers/what_
to_do_about_health_care_
markets_policies_to_make_
health_care_markets_work
29 Hussey PS, Wertheimer S, Mehrotra
A. The association between health
care quality and cost: a systematic
review. Ann Intern Med. 2013;
158(1):27–34.
30 Roberts ET, Mehrotra A, McWilliams
JM. High-price and low-price physi-
cian practices do not differ signifi-
cantly on care quality or efficiency.
Health Aff (Millwood). 2017;36(5):
855–64.
31 White C, Whaley CM. Prices paid to
40. hospitals by private health plans are
high relative to Medicare and vary
widely: findings from an employer-
led transparency initiative [Inter-
net]. Santa Monica (CA): RAND
Corporation; 2019 [cited 2021 Jul
13]. Available from: https://www
.rand.org/pubs/research_reports/
RR3033.html
32 Chernew ME, Dafny LS, Pany MJ. A
proposal to cap provider prices and
price growth in the commercial
health-care market [Internet].
Washington (DC): Hamilton Project;
2020 Mar [cited 2021 Jul 13].
Available from: https://www
.hamiltonproject.org/papers/a_
proposal_to_cap_provider_
prices_and_price_growth_in_the_
commercial_health_care_market
Considering Health Spending
1394 Health Affairs September 2021 40:9
41. Downloaded from HealthAffairs.org on December 14, 2021.
Copyright Project HOPE—The People-to-People Health
Foundation, Inc.
For personal use only. All rights reserved. Reuse permissions at
HealthAffairs.org.
<<
/ASCII85EncodePages false
/AllowTransparency false
/AutoPositionEPSFiles true
/AutoRotatePages /None
/Binding /Left
/CalGrayProfile (Dot Gain 20%)
/CalRGBProfile (Adobe RGB 0501998051)
/CalCMYKProfile (U.S. Web Coated 050SWOP051 v2)
/sRGBProfile (sRGB IEC61966-2.1)
/CannotEmbedFontPolicy /Error
/CompatibilityLevel 1.3
/CompressObjects /Off
/CompressPages true
/ConvertImagesToIndexed true
/PassThroughJPEGImages true
/CreateJobTicket false
/DefaultRenderingIntent /Default