
Recommended
Recommended
More Related Content
Similar to ORIGINAL RESEARCHDemographic Factors and Hospital Size Pre.docx
Similar to ORIGINAL RESEARCHDemographic Factors and Hospital Size Pre.docx (20)
More from gerardkortney
More from gerardkortney (20)
Recently uploaded
Recently uploaded (20)
ORIGINAL RESEARCHDemographic Factors and Hospital Size Pre.docx
- 1. ORIGINAL RESEARCH Demographic Factors and Hospital Size Predict Patient Satisfaction Variance—Implications for Hospital Value-Based Purchasing Daniel C. McFarland, DO1*, Katherine A. Ornstein, PhD2, Randall F. Holcombe, MD1 1Division of Hematology/Oncology, Tisch Cancer Institute, Icahn School of Medicine at Mount Sinai, Mount Sinai Medical Center, New York, New York; 2Department of Geriatrics and Palliative Medicine, Icahn School of Medicine at Mount Sinai, Mount Sinai Medical Center, New York, New York. BACKGROUND: Hospital Value-Based Purchasing (HVBP) incentivizes quality performance-based healthcare by link- ing payments directly to patient satisfaction scores obtained from Hospital Consumer Assessment of Health- care Providers and Systems (HCAHPS) surveys. Lower HCAHPS scores appear to cluster in heterogeneous population-dense areas and could bias Centers for Medi- care & Medicaid Services (CMS) reimbursement. OBJECTIVE: Assess nonrandom variation in patient satis- faction as determined by HCAHPS. DESIGN: Multivariate regression modeling was performed for individual dimensions of HCAHPS and aggregate scores. Standardized partial regression coefficients assessed strengths of predictors. Weighted Individual (hos-
- 2. pital) Patient Satisfaction Adjusted Score (WIPSAS) utilized 4 highly predictive variables, and hospitals were reranked accordingly. SETTING: A total of 3907 HVBP-participating hospitals. PATIENTS: There were 934,800 patient surveys by the most conservative estimate. MEASUREMENTS: A total of 3144 county demographics (US Census) and HCAHPS surveys. RESULTS: Hospital size and primary language (non–English speaking) most strongly predicted unfavorable HCAHPS scores, whereas education and white ethnicity most strongly predicted favorable HCAHPS scores. The average adjusted patient satisfaction scores calculated by WIPSAS approxi- mated the national average of HCAHPS scores. However, WIPSAS changed hospital rankings by variable amounts depending on the strength of the predictive variables in the hospitals’ locations. Structural and demographic characteris- tics that predict lower scores were accounted for by WIPSAS that also improved rankings of many safety-net hospitals and academic medical centers in diverse areas. CONCLUSIONS: Demographic and structural factors (eg, hospital beds) predict patient satisfaction scores even after CMS adjustments. CMS should consider WIPSAS or a simi- lar adjustment to account for the severity of patient satisfac- tion inequities that hospitals could strive to correct. Journal of Hospital Medicine 2015;10:503–509. VC 2015 Society of Hospital Medicine The Affordable Care Act of 2010 mandates that gov- ernment payments to hospitals and physicians must depend, in part, on metrics that assess the quality and
- 3. efficiency of healthcare being provided to encourage value-based healthcare.1 Value in healthcare is defined by the delivery of high-quality care at low cost.2,3 To this end, Hospital Value-Based Purchasing (HVBP) and Physician Value-Based Payment Modifier pro- grams have been developed by the Centers for Medi- care & Medicaid Services (CMS). HVBP is currently being phased in and affects CMS payments for fiscal year (FY) 2013 for over 3000 hospitals across the United States to incentivize healthcare delivery value. The final phase of implementation will be in FY 2017 and will then affect 2% of all CMS hospital reim- bursement. HVBP is based on objective measures of hospital performance as well as a subjective measure of performance captured under the Patient Experience of Care domain. This subjective measure will remain at 30% of the aggregate score until FY 2016, when it will then be 25% the aggregate score moving for- ward.4 The program rewards hospitals for both over- all achievement and improvement in any domain, so that hospitals have multiple ways to receive financial incentives for providing quality care.5 Even still, there appears to be a nonrandom pattern of patient satisfac- tion scores across the country with less favorable scores clustering in densely populated areas.6 Value-Based Purchasing and other incentive-based programs have been criticized for increasing dispar- ities in healthcare by penalizing larger hospitals (including academic medical centers, safety-net hospi- tals, and others that disproportionately serve lower socioeconomic communities) and favoring physician- based specialty hospitals.7–9 Therefore, hospitals that serve indigent and elderly populations may be at a dis- advantage.9,10 HVBP portends significant economic
- 4. consequences for the majority of hospitals that rely heavily on Medicare and Medicaid reimbursement, as most hospitals have large revenues but low profit mar- gins.11 Higher HVBP scores are associated with for profit status, smaller size, and location in certain areas *Address for correspondence and reprint requests: Daniel McFarland, DO, Hematology/Oncology, Mount Sinai Medical Center, One Gustave L. Levy Place, Box 1079, New York, NY 10029; Telephone: 212– 659-5420; Fax: 212–241-2684; E-mail: [email protected] Additional Supporting Information may be found in the online version of this article. Received: November 13, 2014; Revised: March 17, 2015; Accepted: April 3, 2015 2015 Society of Hospital Medicine DOI 10.1002/jhm.2371 Published online in Wiley Online Library (Wileyonlinelibrary.com). An Official Publication of the Society of Hospital Medicine Journal of Hospital Medicine Vol 10 | No 8 | August 2015 503 of the United States.12 Jha et al.6 described Hospital Consumer Assessment of Healthcare Providers and Systems (HCAHPS) scores’ regional geographic vari- ability, but concluded that poor satisfaction was due to poor quality. The Patient Experience of Care domain quantifies
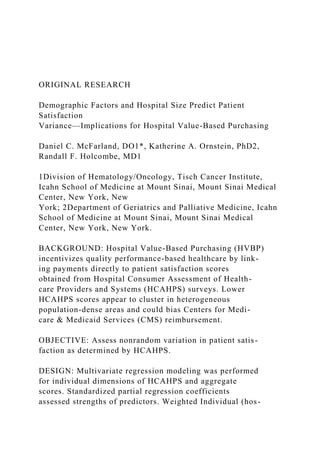
- 5. patient satisfaction using the validated HCAHPS sur- vey, which is provided to a random sample of patients continuously throughout the year at 48 hours to 6 weeks after discharge. It is a publically available standardized survey instrument used to measure patients’ perspectives on hospital care. It assesses the following 8 dimensions: nurse communication, doctor communication, hospital staff responsiveness, pain management, medicine communication, discharge information, hospital cleanliness and quietness, and overall hospital rating, of which the last 2 dimensions each have 2 measures (cleanliness and quietness) and (rating 9 or 10 and definitely recommend) to give a total of 10 distinct measures. The United States is a complex network of urban, suburban, and rural demographic areas. Hospitals exist within a unique contextual and compositional meshwork that determines its caseload. The top popu- lation density decile of the United States lives within 37 counties, whereas half of the most populous parts of the United States occupy a total of 250 counties out of a total of 3143 counties in the United States. If the 10 measures of patient satisfaction (HCAHPS) scores were abstracted from hospitals and viewed according to county-level population density (sepa- rated into deciles across the United States), a trend would be apparent (Figure 1). Greater population den- sity is associated with lower patient satisfaction in 9 of 10 categories. On the state level, composite scores of overall patient satisfaction (amount of positive scores) of hospitals show a 12% variability and a sig- nificant correlation with population density (r 5 20.479; Figure 2). The lowest overall satisfaction scores are obtained from hospitals located in the
- 6. population-dense regions of Washington, DC, New York State, California, Maryland, and New Jersey (ie, 63%–65%), and the best scores are from Louisiana, South Dakota, Iowa, Maine, and Vermont (ie, 74%– 75%). The average patient satisfaction score is 71% 6 2.9%. Lower patient satisfaction scores appear to cluster in population-dense areas and may be asso- ciated with greater heterogeneous patient demo- graphics and economic variability in addition to population density. These observations are surprising considering that CMS already adjusts HCAHPS scores based on patient-mix coefficients and mode of collection.13–18 Adjustments are updated multiple times per year and account for survey collection either by telephone, email, or paper survey, because the populations that select survey forms will differ. Previous studies have shown that demographic features influence the patient evaluation process. For example, younger and more educated patients were found to provide less positive evaluations of healthcare.19 This study examined whether patients’ perceptions of healthcare (pattern of patient satisfaction) as quan- tified under the patient experience domain of HVBP were affected and predicted by population density and other demographic factors that are outside the control of individual hospitals. In addition, hospital-level data (eg, number of hospital beds) and county-level data FIG. 1. Overall patient satisfaction by population density decile. Hospital Consumer Assessment of Healthcare Providers and Systems (HCAHPS)
- 7. scores are segregated by population density deciles (representing 33 million people each). Population density increases along the grey scale. The com- posite score and 9 out of 10 HCAHPS dimensions demonstrate lower patient satisfaction as population density increases (darker shade). Abbreviations: Doc, doctor; Def Rec, definitely recommend. FIG. 2. Averaged Hospital Consumer Assessment of Healthcare Providers and Systems (HCAHPS) scores by state correlated with state population (Pop) density. Bivariate correlation of composite HCAHPS scores predicted by state population density without District of Columbia, r 5 20.479, P < 0.001 (2-tailed). This observed correlation informed the hypothesis that population density could predict for lower patient satisfaction via HCAHPS scores. McFarland et al | Patient Satisfaction Variance Prediction
- 8. 504 An Official Publication of the Society of Hospital Medicine Journal of Hospital Medicine Vol 10 | No 8 | August 2015 such as race, age, gender, overall population, income, time spent commuting to work, primary language, and place of birth were analyzed for correlation with patient satisfaction scores. Our study demonstrates that demographic and hospital-level data can predict patient satisfaction scores and suggests that CMS may need to modify its adjustment formulas to eliminate bias in HVBP-based reimbursement. METHODS Data Collection Publically available data were obtained from Hospital Compare,20 American Hospital Directory,21 and the US Census Bureau22 websites. Twenty relevant US Census data categories were selected by their rele- vance for this study out of the 50 publically reported US Census categories, and included the following: county population, county population density, percent of population change over 1 year, poverty level (per- cent), income level per capita, median household income, average household size, travel time to work, percentage of high school or college graduates, non- English primary language spoken at home, percentage of residents born outside of the United States, popula- tion percent in same residence for over 1 year, gender, race (white alone, white alone (not Hispanic or Lat- ino), black or African American alone), population over 65 years old, and population under 18 years old. HCAHPS Development
- 9. The HCAHPS survey is 32 questions in length, com- prised of 10 evaluative dimensions. All short-term, acute care, nonspecialty hospitals are invited to partic- ipate in the HCAHPS survey. Data Analysis Statistical analyses used the Statistical Package for Social Sciences version 16.0 for Windows (SPSS Inc., Chicago, IL). Data were checked for statistical assumptions, including normality, linearity of relation- ships, and full range of scores. Categories in both the Hospital Compare (HCAHPS) and US Census datasets were analyzed to assess their distribution curves. The category of population densities (per county) was con- verted to a logarithmic scale to account for a skewed distribution and long tail in the area of low popula- tion density. Data were subsequently merged into an Excel (Microsoft, Redmond, WA) spreadsheet using the VLookup function such that relevant 2010 census county data were added to each hospital’s Hospital Compare data. Linear regression modeling was per- formed. Bivariate analysis was conducted (ENTER method) to determine the significant US Census data predictors for each of the 10 Hospital Compare dimensions including the composite overall satisfac- tion score. Significant predictors were then analyzed in a multivariate model (BACKWORDS method) for each Hospital Compare dimension and the composite average positive score. Models were assessed by deter- minates of correlation (adjusted R2) to assess for goodness of fit. Statistically significant predictor varia- bles for overall patient satisfaction scores were then ranked according to their partial regression coeffi-
- 10. cients (standardized b). A patient satisfaction predictive model was sought based upon significant predictors of aggregate percent positive HCAHPS scores. Various predictor combina- tions were formed based on their partial coefficients (ie, standardized b coefficients); combinations were assessed based on their R2 values and assessed for col- inearity. Combinations of partial coefficients included the 2, 4, and 8 most predictive variables as well the 2 most positive and negative predictors. They were then incorporated into a multivariate analysis model (FOR- WARD method) and assessed based on their adjusted R2 values. A 4-variable combination (the 2 most pre- dictive positive partial coefficients plus the 2 most pre- dictive negative partial coefficients) was selected as a predictive model, and a formula predictive of the composite overall satisfaction score was generated. This formula (predicted patient satisfaction formula [PPSF]) predicts hospital patient satisfaction HCAHPS scores based on the 4 predictive variables for particu- lar county and hospital characteristics. PPSF 5 KMV 1 BHB HBð Þ 1 BNE NEð Þ 1 BE Eð Þ 1 BW Wð Þ where KMV 5 coefficient constant (70.9), B 5 un- standardized b coefficient (see Table 1 for values), HB 5 number of hospital beds, NE 5 proportion of non-English speakers, E 5 education (proportion with bachelor’s degree), and W 5 proportion identified as white race only. The PPSF was then modified by weighting with the partial coefficient (b) to remove the bias in patient sat- isfaction generated by demographic and structural fac-
- 11. tors over which individual hospitals have limited or no control. This formula generated a Weighted Indi- vidual (hospital) Predicted Patient Satisfaction Score (WIPPSS). Application of this formula narrowed the predicted distribution of patient satisfaction for all hospitals across the country. WIPPSS 5 KMV 1 BHB HBð Þ 12bHBð Þ 1 BNE NEð Þ 12bNEð Þ 1 BE Eð Þ 12bEð Þ 1 BW Wð Þ 12bWð Þ where b 5 standardized b coefficient (see Table 1 for values). To create an adjusted score with direct relevance to the reported patient satisfaction scores, the reported scores were multiplied by an adjustment factor that defines the difference between individual hospital- weighted scores and the national mean HCAHPS score across the United States. This formula, the Weighted Individual (hospital) Patient Satisfaction Adjustment Score (WIPSAS), represents a patient Patient Satisfaction Variance Prediction | McFarland et al An Official Publication of the Society of Hospital Medicine Journal of Hospital Medicine Vol 10 | No 8 | August 2015 505 satisfaction score adjusted for demographic and struc- tural factors that can be utilized for interhospital com- parisons across all areas of the country. WIPSAS 5 PSrep 1 1 PSUSA2WIPPSSXð Þ=100½ �
- 12. where PSrep 5 patient satisfaction reported score, PSUSA 5 mean reported score for United States (71.84), and WIPPSSX 5 WIPPSS for individual hospital. Application of Data Analysis PPSF, WIPPSS, and WIPSAS were calculated for all HCAHPS-participating hospitals and compared with averaged raw HCAHPS scores across the United States. WIPSAS and raw scores were specifically analyzed for New York State to demonstrate exactly how adjustments would change state-level rankings. RESULTS Complete HCAHPS scores were obtained from 3907 hospitals out of a total 4621 hospitals listed by the Hospital Compare website (85%). The majority of hospitals (2884) collected over 300 surveys, fewer hospitals (696) collected 100 to 299 surveys, and fewer still (333) collected <100 surveys. In total, results were available from at least 934,800 individual surveys, by the most conservative estimate. Missing HCAHPS hospital data averaged 13.4 (standard devia- tion [SD] 12.2) hospitals per state. County-level data were obtained from all 3144 county or county equiva- lents across the United States (100%). Multivariate regression modeling across all HCAHPS dimensions found that between 10 and 16 of the 20 predictors (US Census categories) were statistically significant and predictive of individual HCAHPS dimension scores and the aggregate percent positive score as demonstrated in Table 2. For example, county per- centage of bachelors’ degrees positively predicts for
- 13. positive doctor communication scores, and hospital beds negatively predicts for quiet dimension. The strongest positive and negative predictive variables by model regression coefficients for each HCAHPS dimension are also listed in Table 2. Table 1 highlights multivariate regression modeling of the composite average positive score, which pro- duced an adjusted R2 of 0.222 (P < 0.001). All varia- bles were significant and predicted change of the composite HCAHPS except for place of birth–foreign born (not listed in the table). Table 1 ranks variables from most positive to most negative predictors. Other HCAHPS domains demonstrated statistically significant models (P < 0.001) and are listed by their coefficients of determination (ie, adjusted R2) (Table 2). The best-fit dimensions were help (adjusted R2 5 0.304), quiet (adjusted R2 5 0.299), doctor com- munication (adjusted R2 5 0.298), nurse communica- tion (adjusted R2 5 0.245), and clean (adjusted R2 5 0.232). Models that were not as strongly predic- tive as the composite score included pain (adjusted R2 5 0.124), overall 9/10 (adjusted R2 5 0.136), defi- nitely recommend (adjusted R2 5 0.150), and explained meds (adjusted R2 5 0.169). A predictive formula for average positive scores was
- 14. created by determination of the most predictive partial coefficients and the best-fit model. Bachelor’s degree and white only were the 2 greatest positive predictors, and number of hospital beds and non–English speak- ing were the 2 greatest negative predictors. The PPSF (predictive formula) was chosen out of various combi- nations of predictors (Table 1), because its coefficient of determination (adjusted R2 5 0.155) was closest to TABLE 1. Multivariate Regression of Hospital Consumer Assessment of Healthcare Providers and Systems (HCAHPS) Average Positive Score by County and Hospital Demographics B SE b t P Educational attainment–bachelor’s degree 0.157 0.018 0.27 8.612 <0.001 White alone percent 2012 0.09 0.012 0.235 7.587 <0.001 Resident population percent under 18 years 0.404 0.0444 0.209 9.085 <0.001 Black or African American alone percent 2012 0.083 0.014 0.191 5.936 <0.001 Median household income 2007–2011 20.00003 0.00 20.062 22.027 0.043 Population density (log) 2010 20.277 0.083 20.087 23.3333 0.001 Average travel time to work 20.107 0.024 20.088 24.366 <0.001 Educational attainment–high school 20.082 0.026 20.088 23.147 0.002 Average household size 22.58 0.727 20.107 23.55 <0.001 Total females percent 2012 20.423 0.067 20.107 26.296 <0.001 Percent non–English speaking at home 2007–2011 20.052 0.018 20.14 22.929 0.003 No. of hospital beds 20.006 0.00 20.213 212.901 <0.001 Adjusted R2 0.222
- 15. NOTE: A multivariate linear regression model of statistically significant dimensions of patient satisfaction as determined by Hospital Consumer Assessment of Healthcare Providers and Systems scores is provided. The dependent variable is the composite of average patient satisfaction scores by hospital (3192 hospitals). Predictors (independent variables) were collected from US Census data for counties or county equivalents. All of the listed predictors (first column) are statistically significant. They are placed in order of partial regression coefficient contribution to the model from most positive to most negative contribution. Adjusted R2 (last row) is used to signify the goodness of fit. Abbreviations: b, standardized b (partial coefficient); B, unstandardized b coefficient; P, statistical significance; SE, standard error; t, t statistic. McFarland et al | Patient Satisfaction Variance Prediction 506 An Official Publication of the Society of Hospital Medicine Journal of Hospital Medicine Vol 10 | No 8 | August 2015 the overall model’s coefficient of determination (adjusted R2 5 0.222) without demonstrating colinear- ity. Possible predictive formulas were based on the predictors’ standardized b and included the following combinations: the 2 greatest overall predictors (adjusted R2 5 0.051), the 2 greatest negative and pos- itive predictors (adjusted R2 5 0.098), the 4 greatest overall predictors (adjusted R2 5 0.117), and the 8 greatest overall predictors (adjusted R2 5 0.201), which suffered from colinearity (household size plus non–English speaking [Pearson 5 0.624] and under 18 years old [Pearson 5 0.708]). None of the correlated
- 16. independent variables (eg, poverty and median income) were placed in the final model. The mean WIPSAS scores closely corresponded with the national average of HCAHPS scores (71.6 vs 71.84) but compressed scores into a narrower distri- bution (SD 5.52 vs 5.92). The greatest positive and negative changes were by 8.51% and 2.25%, respec- tively. Essentially, a smaller number of hospitals in demographically challenged areas were more signifi- cantly impacted by the WIPSAS adjustment than the larger number of hospitals in demographically favor- able areas. Large hospitals in demographically diverse counties saw the greatest positive change (e.g., Texas, California, and New York), whereas smaller hospitals in demographically nondiverse areas saw compara- tively smaller decrements in the overall WIPSAS scores. The WIPSAS had the most beneficial effect on urban and rural safety-net hospitals that serve diverse populations including many academic medical centers. This is illustrated by the reranking of the top 10 and bottom 10 hospitals in New York State by the WIP- SAS (Table 3). For example, 3 academic medical TABLE 3. Top Ten Highest-Ranked Hospitals in New York State by HCAHPS Scores Compared to WIPSAS Ten Highest Ranked New York State Hospitals by HCAHPS Ten Highest Ranked New York State Hospitals After WIPSAS
- 17. 1. River Hospital, Inc. 1. River Hospital, Inc. 2. Westfield Memorial Hospital, Inc. 2. Westfield Memorial Hospital, Inc. 3. Clifton Fine Hospital 3. Clifton Fine Hospital 4. Hospital For Special Surgery 4. Hospital For Special Surgery 5. Delaware Valley Hospital, Inc. 5. New York–Presbyterian Hospital 6. Putnam Hospital Center 6. Delaware Valley Hospital, Inc. 7. Margaretville Memorial Hospital 7. Montefiore Medical Center 8. Community Memorial Hospital, Inc. 8. St. Francis Hospital, Roslyn 9. Lewis County General Hospital 9. Putnam Hospital Center 10. St. Francis Hospital, Roslyn 10. Mount Sinai Hospital NOTE: Top 10 highest-ranked hospitals in New York State by overall patient satisfaction out of 167 evalu- able hospitals are shown. The left column represents the current top 10 hospitals in 2013 by HCAHPS over- all patient satisfaction scores, and the right column represents the top 10 hospitals after the WIPSAS adjustment. The 4 factors used to create the WIPSAS adjustment were the 2 most positive partial regression coefficients (education–bachelor’s degree, white alone percent 2012) and the 2 most negative partial regres- sion coefficients (number of hospital beds, non–English speaking at home). Three urban academic medical centers, Montefiore Medical Center, New York Presbyterian Hospital, and Mount Sinai Hospital, were reranked from the 46th, 43rd, and 42nd respectively into the top 10. Abbreviations: HCAHPS, Hospital Con- sumer Assessment of Healthcare Providers and Systems; WIPSAS, Weighted Individual (hospital) Patient Satisfaction Adjustment Score.
- 18. TABLE 2. Multivariate Regression of Hospital Consumer Assessment of Healthcare Providers and Systems by County and Hospital Demographics Average Positive Scores Nurse Communication Doctor Communication Help Pain Explain Meds Clean Quiet Discharge Explain Recommend 9/10 Definitely Recommend Educational–bachelor’s 0.27 0.19 0.45 0.10 0.10 0.05 0.08 0.33 0.15 0.27 0.416
- 19. Hospital beds 2 0.21 20.16 20.19 20.26 20.16 20.17 2 0.27 20.26 20.06 20.11 — Population density 2010 20.09 20.07 20.28 20.20 20.08 20.23 2 0.14 2 0.19 0.22 0.07 * White alone percent 0.24 0.25 0.09 0.16 0.23 0.07 0.16 — 0.17 0.31 0.317 Total females percent 20.11 20.05 20.06 20.07 20.06 20.03 2 0.05 2 0.09 20.12 20.09 — African American alone 0.19 0.19 — 0.09 0.23 0.09 0.07 0.34 * 0.09 0.084 Average travel time to work 20.09 20.10 * 20.09 20.06 20.04 2 0.08 * 20.12 20.17 20.16 Foreign-born percent * 20.16 0.14 20.06 20.12 20.08 0.06 2 0.13 20.18 * * Average household size 20.11 20.05 20.15 20.07 * 20.07 * 2 0.01 * 20.07 0.076 Non–English speaking 20.14 20.12 20.50 20.07 * * * * * 20.34 20.28 Education–high school 20.09 20.09 20.40 * — — — 2 0.27 0.06 20.08 * Household income 20.06 * 20.35 20.08 * * 2 0.16 2 0.41 — — 20.265 Population 65 years and over * 20.14 20.14 20.12 * 20.11 2 0.15 — — * 20.10 White, not Hispanic/Latino * * 20.20 * * * 0.09 0.13 0.09 20.22 20.25 Population under 18 0.21 — 0.15 — 0.08 — — — 0.11 0.20 — Population (county) * 20.06 20.08 * 20.03 20.05 * * 20.06 * * All ages in poverty — — 20.24 — — — 2 0.10 2 0.22 20.08 * 20.281 1 year at same residence * 0.13 0.12 0.11 — — 0.10 * 20.04 * * Per capita income * 20.07 * * * * * 0.09 — — * Population percent change * * * * * * 2 0.05 — — * * Adjusted R2 0.22 0.25 0.30 0.30 0.12 0.17 0.23 0.30 0.19 0.14 0.15
- 20. NOTE: Linear regression modeling results of 10 dimensions of patient satisfaction (ie, Hospital Consumer Assessment of Healthcare Providers and Systems [HCAHPS]) and Average Positive Scores (top row) by county demo- graphics and hospital size (left column) are shown. Adjusted R2 (last row) is used to signify the goodness of fit. All models are statistically significant with P 5 <0.001. Partial regression coefficients (b) are used to positively or neg- atively assess contribution to the individual models (ie, each column). The dash (—) indicates nonsignificance and the asterisk (*) indicates a value that was statistically significant in univariate analysis but not in multivariate analysis. Independent variables (first column) are ordered from top to bottom by the number of HCAHPS dimensions that each contributes to HCAHPS predictive scoring. Patient Satisfaction Variance Prediction | McFarland et al An Official Publication of the Society of Hospital Medicine Journal of Hospital Medicine Vol 10 | No 8 | August 2015 507 centers in New York State, Montefiore Medical Cen- ter, New York Presbyterian Hospital, and Mount Sinai Hospital, were moved from the 46th, 43rd, and 42nd (out of 167 hospitals) respectively into the top 10 in patient satisfaction utilizing the WIPSAS meth- odology. Reported patient satisfaction scores, PPSF, WIPPSS, and WIPSAS scores for each hospital in the United States are available online (see Supporting Table S1 in the online version of this article). DISCUSSION The HVBP program is an incentive program that is meant to enhance the quality of care. This study illus-
- 21. trates healthcare inequalities in patient satisfaction that are not accounted for by the current CMS adjust- ments, and shows that education, ethnicity, primary language, and number of hospital beds are predictive of how patients evaluate their care via patient satisfac- tion scores. Hospitals that treat a disproportionate percentage of non–English speaking, nonwhite, none- ducated patients in large facilities are not meeting patient satisfaction standards. This inequity is not ameliorated by the adjustments currently performed by CMS, and has financial consequences for those hospitals that are not meeting national standards in patient satisfaction. These hospitals, which often include academic medical centers in urban areas, may therefore be penalized under the existing HVBP reim- bursement models. Using only 4 demographic and hospital-specific pre- dictors (ie, hospital beds, percent non–English speaking, percent bachelors’ degrees, percent white), it is possible to utilize a simple formula to predict patient satisfaction with a significant degree of correlation to the reported scores available through Hospital Compare. Our initial hypothesis that population density pre- dicted lower patient satisfaction scores was confirmed, but these aforementioned demographic and hospital- based factors were stronger independent predictors of HCAHPS scores. The WIPSAS is a representation of patient satisfaction and quality-of-care delivery across the country that accounts for nonrandom variation in patient satisfaction scores. For hospitals in New York State, WIPSAS resulted in the placement of 3 urban-based academic medical centers in the top 10 in patient satisfaction, when pre-
- 22. viously, based on the raw scores, their rankings were between 42nd and 46th statewide. Prior studies have suggested that large, urban, teaching, and not-for- profit hospitals were disadvantaged based on their hospital characteristics and patient features.10–12 Under the current CMS reimbursement methodolo- gies, these institutions are more likely to receive finan- cial penalties.8 The WIPSAS is a simple method to assess hospitals’ performance in the area of patient satisfaction that accounts for the demographic and hospital-based factors (eg, number of beds) of the hos- pital. Its incorporation into CMS reimbursement cal- culations, or incorporation of a similar adjustment formula, should be strongly considered to account for predictive factors in patient satisfaction that could be addressed to enhance their scores. Limitations for this study are the approximation of county-level data for actual individual hospital demo- graphic information and the exclusion of specialty hos- pitals, such as cancer centers and children’s hospitals, in HCAHPS surveys. Repeated multivariate analyses at dif- ferent time points would also serve to identify how CMS-specific adjustments are recalibrated over time. Although we have primarily reported on the composite percent positive score as a surrogate for all HCAHPS dimensions, an individual adjustment formula could be generated for each dimension of the patient experience of care domain. Although patient satisfaction is a component of how quality should be measured, further emphasis needs to be placed on nonrandom patient satisfaction variance so that HVBP can serve as an incentivizing program for at-risk
- 23. hospitals. Regional variation in scoring is not altogether accounted for by the current CMS adjustment system. Because patient satisfaction scores are now directly linked to reimbursement, further evaluation is needed to enhance patient satisfaction scoring paradigms to account for demographic and hospital-specific factors. Disclosure Nothing to report. References 1. Florence CS, Atherly A, Thorpe KE. Will choice-based reform work for Medicare? Evidence from the Federal Employees Health Benefits Program. Health Serv Res. 2006;41:1741–1761. 2. H.R. 3590. Patient Protection and Affordable Care Act 2010 (2010). 3. Donabedian A. The quality of care. How can it be assessed? JAMA. 1988;260(12):1743–1748. 4. Lake Superior Quality Innovation Network. FY 2017 Value- Based Purchasing domain weighting. Available at: http://www.stratishealth. org/documents/VBP-FY2017.pdf. Accessed March 13, 2015. 5. Hospital Value-Based Purchasing Program. Available at: http://www. cms.gov/Medicare/Quality-Initiatives-Patient-Assessment- Instruments/ Hospital-Value-Based-Purchasing. Accessed December 1st,
- 24. 2013. 6. Jha AK, Orav EJ, Zheng J, Epstein AM. Patients’ perception of hospital care in the United States. N Engl J Med. 2008;359(18):1921– 1931. 7. Porter ME, Lee TH. Providers must lead the way in making value the overarching goal Harvard Bus Rev. October 2013:3–19. 8. Jha AK, Orav EJ, Epstein AM. The effect of financial incentives on hospitals that serve poor patients. Ann Intern Med. 2010;153(5):299– 306. 9. Joynt KE, Jha AK. Characteristics of hospitals receiving penalties under the Hospital Readmissions Reduction Program. JAMA. 2013; 309(4):342–343. 10. Ryan AM. Will value-based purchasing increase disparities in care? N Engl J Med. 2013;369(26):2472–2474. 11. Thorpe KE, Florence CS, Seiber EE. Hospital conversions, margins, and the provision of uncompensated care. Health Aff (Millwood). 2000;19(6):187–194. 12. Borah BJ, Rock MG, Wood DL, Roellinger DL, Johnson MG,
- 25. Naessens JM. Association between value-based purchasing score and hospital characteristics. BMC Health Serv Res. 2012;12:464. 13. Elliott MN, Zaslavsky AM, Goldstein E, et al. Effects of survey mode, patient mix, and nonresponse on CAHPS hospital survey scores. Health Serv Res. 2009;44(2 pt 1):501–518. 14. Burroughs TE, Waterman BM, Cira JC, Desikan R, Claiborne Dunagan W. Patient satisfaction measurement strategies: a comparison of phone and mail methods. Jt Comm J Qual Improv. 2001;27(7):349– 361. 15. Fowler FJ Jr, Gallagher PM, Nederend S. Comparing telephone and mail responses to the CAHPS survey instrument. Consumer Assessment of Health Plans Study. Med Care. 1999;37(3 suppl):MS41– MS49. McFarland et al | Patient Satisfaction Variance Prediction 508 An Official Publication of the Society of Hospital Medicine Journal of Hospital Medicine Vol 10 | No 8 | August 2015 http://www.stratishealth.org/documents/VBP-FY2017.pdf http://www.stratishealth.org/documents/VBP-FY2017.pdf http://www.cms.gov/Medicare/Quality-Initiatives-Patient- Assessment-Instruments/Hospital-Value-Based-Purchasing http://www.cms.gov/Medicare/Quality-Initiatives-Patient- Assessment-Instruments/Hospital-Value-Based-Purchasing http://www.cms.gov/Medicare/Quality-Initiatives-Patient-
- 26. Assessment-Instruments/Hospital-Value-Based-Purchasing 16. Rodriguez HP, von Glahn T, Rogers WH, Chang H, Fanjiang G, Safran DG. Evaluating patients’ experiences with individual physi- cians: a randomized trial of mail, internet, and interactive voice response telephone administration of surveys. Med Care. 2006;44(2): 167–174. 17. O’Malley AJ, Zaslavsky AM, Elliott MN, Zaborski L, Cleary PD. Case-mix adjustment of the CAHPS Hospital Survey. Health Serv Res. 2005;40(6 pt 2):2162–2181. 18. Mode and patient-mix adjustments of CAHPS hospital survey (HCAHPS). Available at: http://www.hcahpsonline.org/modeadjust- ment.aspx. Accessed December 1, 2013. 19. Zaslavsky AM, Zaborski LB, Ding L, Shaul JA, Cioffi MJ, Clear PD. Adjusting performance measures to ensure equitable plan compari- sons. Health Care Financ Rev. 2001;22(3):109–126. 20. Official Hospital Compare Data. Displaying datasets in Patient Survey Results category. Available at: https://data.medicare.gov/data/hospital- compare/Patient%20Survey%20Results. Accessed December 1, 2013.
- 27. 21. Hospital statistics by state. American Hospital Directory, Inc. website. Available at: http://www.ahd.com/state_statistics.html. Accessed December 1, 2013. 22. U.S. Census Download Center. Available at: http://factfinder.census. gov/faces/nav/jsf/pages/download_center.xhtml. Accessed December 1, 2013. Patient Satisfaction Variance Prediction | McFarland et al An Official Publication of the Society of Hospital Medicine Journal of Hospital Medicine Vol 10 | No 8 | August 2015 509 http://www.hcahpsonline.org/modeadjustment.aspx http://www.hcahpsonline.org/modeadjustment.aspx https://data.medicare.gov/data/hospital- compare/Patient%20Survey%20Results https://data.medicare.gov/data/hospital- compare/Patient%20Survey%20Results https://data.medicare.gov/data/hospital- compare/Patient%20Survey%20Results https://data.medicare.gov/data/hospital- compare/Patient%20Survey%20Results http://www.ahd.com/state_statistics.html http://factfinder.census.gov/faces/nav/jsf/pages/download_cente r.xhtml http://factfinder.census.gov/faces/nav/jsf/pages/download_cente r.xhtmlll
- 28. • Low-Low confidence that the evidence reflects the true effect. Further evidence is likely to change our confidence in the estimate of effect and is likely to change the estimate. A low rating indicates that there is a high risk of bias and residual confounding. • Insufficient-A lack of evidence to estimate the effect(s). Figure 3.1. Process Used to Identify Articles for Review, Pay- for-Performance Library Search (n= l,891) PubMed P4P Search (n=l,707) PubMed "Author Name" Search (n=S3) Other (i.e., reference mining, articles research team had in Endnote libraries from previous reviews {n=l3) Articles ncluded after ti tle ... and abstract screening (n= l,314) Articles screened and categorized by research assistant and senior researcher (n=S77) Articles retamed after full screen
- 29. (n=104) Articles added based on TEP Articles ncluded recommendations{n=7) _.. ... (simulations and articles that did � ,- not assess P4P effects) (n=8) Final Count of Studies Reviewed (n=l03) Ambulatory (n=48) Hospital {n=38) Other (e.g. Nursing Home) (n=4) Multiple Settings (n=3) Liter ature Reviews (n= lO) Research Questions Measuring Performance in Value-Based Purchasing Programs 1. What goals should be set and how should success be defined for VBP programs? As discussed in Chapter Two (environmental scan ofVBP programs), P4P sponsors generally established goals that were high-level (e.g., "improved health," ''bend the cost curve") and heavily emphasized clinical quality (27 out of 35 programs). Goals related to cost/affordability 24
- 30. Table 3.2. Summary of Studies Examining the Association Between Process and Outcome Measures Risk-Adjusted or Standardized Outcomes 30-Day Mortality In-Hospital Mortality Complications 30-Day Readmissions 1-Year Survival # Studies # Studies # Studies # Studies # Studies # Studies # Studies # Studies Non- # Studies Non- Fewer Non- Fewer Non- # Studies Non- Lower significan Lower significant Complica- significan Read miss significant Better significant Condition-Related Process Measures Mortality t Effect Mortality Effect tions t Effect ions Effect Mortality Effect AMI I Beta-blocker use at admission 1 1 1 4 1 Beta-blocker use at discharge 2 1 2 1 Aspirin use at admission 1 1 3 1 Aspirin use at discharge 2 2 1 1
- 31. ACE inhibitor use at discharge 2 2 1 1 Smoking cessation counseling for smokers during 1 1 admission Timely reperfusion therapy 1 1 Heparin at admission 1 Intravenous glycoprotein llb/llla inhibitors at 1 admission Lipid lowering medication at discharge 1 AMI composite measures� 5 1 4:.! 1 1 1 1 CHF I CHF composite measures4 2 1 1 2 1 1 1 Pneumonia I Antibiotics timing 1 1 1 1 Pneumonia composite measures5 2 1 1 2 1 1 Orthopedic Surgery Composites of SCIP and other process measures0 1 1 1 High Risk Surgical Procedures I Composites of SCIP measures' 18 1 28 1 In one study, significant results were no longer observed when
- 32. hospital fixed effects were included in the model. 2 In one study, two composites with different weighting of the measures were included in the model. One composite was associated with lower inpatient mortality and one was associated with higher inpatient mortality. 3 Two different AMI process measure composite measures were used. One included five measures: beta-blocker use at admission, beta-blocker use at discharge, aspirin use at admission, aspirin use at discharge, ACE inhibitor use at discharge. The other composite included these measures plus smoking cessation counseling and timely reperfusion therapy. 4 Two different CHF process measure composites were used. One included two measures: ACE inhibitor or angiotensin receptor blocker for left ventricular systolic and dysfunction and assessment of left ventricular function. The other composite included these measures plus smoking cessation counseling and discharge instructions. 5 Two different pneumonia process measure composite were used. One included 3 measures: antibiotics provided within 4 hours or less, pneumococcal vaccination, and oxygenation assessment. The other included these measures plus blood culture prior to antibiotics, appropriate antibiotic, pneumococcal vaccination status, influenza vaccination status, and smoking cessation counseling. 6 Two different process-of-care composite measures were used for orthopedic surgery. One included 6 measures: metabolic complication avoidance index, hematoma avoidance index, readmission avoidance index, antibiotics administered within 1 hour before incision, antibiotics discontinued within 24 hours of surgery, appropriate antibiotic selection. The other included 9 SCIP measures: prophylactic antibiotic received within 1 hour prior to surgery, prophylactic antibiotic
- 33. selection, prophylactic antibiotic discontinuation within 24 hours after surgery, cardiac surgery patients with controlled 6 AM postoperative glucose, patients with appropriate hair removal, colorectal surgery patients with immediate postoperative normothermia, recommended venous thromboembolism prophylaxis ordered, recommended venous thromboembolism prophylaxis ordered and received, surgery patients on beta-blocker therapy prior to admission who received a beta- blocker during perioperative period. 7Two different SCIP measure composites were used. One included 5 SCIP measures: receipt of prophylactic antibiotics within 2 hours of surgery, discontinuation of prophylactic antibiotics within 24 hours of surgery, selection of correct prophylactic antibiotic, ordering of venous thrombosis prophylaxis, ordering of venous thrombosis prophylaxis within 24 hours of surgery. The other included these measures plus cardiac surgery patients with controlled 6 AM postoperative glucose, patients with appropriate hair removal, colorectal surgery patients with immediate postoperative normothermia, recommended venous thromboembolism rrophylaxis ordered and received, surgery patients on beta- blocker therapy prior to admission who received a beta-blocker during perioperative period. Non-significant effects except abdominal aortic aneurysm, where highest SCIP compliance had lower mortality rates. 29
- 34. Table 3.3. Articles Examining Relationship Between Performance on Pay-for-Performance Measures and Patient Outcomes Reference Bhattacharyra et al., 20091 1 Setting Hospital Study Design Cross-sectional analysis of correlation between composite quality score for hip and knee surgery and patient outcomes among the subset of the 260 HQID hospitals that participated in the hip and knee portion of the program in 2004/2005 (actual number of hospitals not reported). Hospitals were placed into 1 of 4 tiers based on composite performance score: top 10% (tier 1 ); second decile (tier 2); top 50% but not in top 2 deciles (tier 3); bottom 50% (tier 4 ). Program Measure(s) Patient Outcome(s) • Composite measure capturing
- 35. 3 process measures and 3 intermediate outcome measures • Data for 4 of the 6 individual measures were only available for those hospitals with performance in top 50% of HQID hospitals 32 • Inpatient mortality after hip and knee arthroplasty • Iatrogenic complications • Urinary tract infections Findings • Higher-tier hospitals did not have lower complications or urinary tract infections. • No significant difference in hip and
- 36. knee arthroplasty associated mortality across the hospital tiers, but was a trend toward a higher rate of mortality in tier 4 hospitals (r = 0.116; p = 0.088). • All hospitals with mortality > 2.0% were in tiers 3 and 4. Assessment of Methodological Quality Poor: Data on 4 of 6 measures used in composite only available for top 50% of performers. Mortality and complications not available for all hospitals. Limited variability in quality composite led to arbitrary placement into tiers. Lack of control for confounders.
- 37. Reference BradleJ et al., 2006 1 Setting Hospital Study Design Cross-sectional analysis of correlation between CMS/Joint Commission AM I core process measures and hospital-level, risk- standardized measures of patient outcomes using January 2002- March 2003 Medicare claims data from 962 hospitals participating in the National Registry of Myocardial Infarction. Hospital- level performance was estimated using hierarchical generalized linear models as well as crude process rates. Main analysis included patients transferred out; these were excluded in secondary analyses Program Measure(s) Patient Outcome(s) • 7 AMI process measures and a composite quality score
- 38. 33 • Risk standardized 30- day all-cause mortality • Risk standardized in- hospital mortality Findings Assessment of Methodological Quality • Risk-standardized 30- Fair day all-cause mortality significantly, but weakly, correlated with beta-blocker at discharge (r=-.16, p<.001 ), aspirin at discharge (r=-.18, p<.001 ), timely reperfusion therapy (r=-.18, p<.001), and the quality composite (r=-.25, p<.001 ), but not with other process measures (beta- blocker at admission, aspirin at admission, ACE inhibitor at
- 39. discharge, smoking cessation counseling). • Amount of variation in 30-day mortality explained by process measures ranged from 0.1 % to 3.3%; the measures jointly explained 6% of variation. • Aspirin at admission was weakly associated with risk-standardized in-hospital, all-cause mortality (r=-.12, p<.05); other measures, including the composite, were not. Reference Setting Glickman et al., Hospital 2009 139 Study Design Assessed association between AMI and CHF process measures and inpatient mortality measures
- 40. after AMI among 1,351 hospitals participating in Hospital Compare that had at least one patient eligible for AMI measures and one eligible for CHF measures, at least 25 treatment opportunities across all measures, and could be merged with American Hospital Association data on hospital characteristics and Joint Commission data on risk- adjusted inpatient mortality after AMI. Hospital-level multivariable logistic regression assessed association for each scoring �yste_ m with inpatient survival (1- mpatient mortality) in subsequent year, controlling for hospital-level academic affiliation, geographic l�cation, population density, bed size, presence of percutaneous coronary intervention and cardiac surgery. Program Measure(s) Patient Outcome(s) • 8 AMI process measures • 4 CHF process measures • Two sets of
- 41. composite adherence scores assigned different weights to individual measures. • Opportunity model • Principal components analysis used to place measures into one of two groups (clinical cardiac activities and administrative cardiac activities). Adherence was calculated with more weight given to measures with greater opportunity for improvement 34 • Risk-adjusted inpatient mortality after AMI Findings • In a model with both clinical and
- 42. administrative cardiac activities composite, higher clinical cardiac activities were associated with higher inpatient survival (OR=1.13, p<.001 ), while higher scores for administrative cardiac activities were associated with worse inpatient survival (OR=0.96, p<.001 ). • When separate composite measures were included for AM I and CHF, AMI performance was associated with improved survival (OR 1.09, p<.001) while the CHF composite was associated with lower inpatient survival (OR 0.98, p<.05). Assessment of Methodological Quality Poor: Outcome measures was risk- adjusted inpatient mortality after AMI,
- 43. but analyses included quality measures for heart failure patients. In addition, analyses included quality measures for care delivered at discharge, which would not affect inpatient mortality rates Reference Jha et al., 200? 140 Setting Hospital Study Design Cross-sectional analyses assessed association between condition-specific composite and morality using Hospital Quality Alliance data from April 1, 2004- March 31, 2005, linked with American Hospital Association data on hospital characteristics and 2003 Medicare Provider and
- 44. Analysis Review (MEDPAR) discharge data for calculating outcomes. Patients received in transfer or transferred to another hospital were excluded. Patient- level multivariable logistic regressions accounting for clustering of patients within hospitals controlling for patient demographics, comorbidities using Elixhauser method, and hospital characteristics were used to estimate the probability of death stratified by hospital's performance on Hospital Quality Alliance measures (by quartiles). The number of hospitals included in analyses ranged from 1,965 for AMI to 3,270 for pneumonia. Program Measure(s) Patient Outcome(s) • 10 Hospital Quality Alliance process measures were used to create summary performance scores for three clinical conditions: • 5 AM I process measures • 2 CHF process measures
- 45. • 3 pneumonia process measures 35 • Risk-adjusted inpatient mortality for patients with primary diagnosis of AMI, CHF or pneumonia Findings • Significant trend for lower performance being associated with higher mortality for each condition (AMI p<.001; CHF p=.005; pneumonia p<.001 ). • Compared with hospitals in the bottom quartile of performance, hospitals in the top quartile had -1 % lower mortality for AMI, 0.4% for CHF, and 0.8% for pneumonia. • In multivariable
- 46. analyses, patients discharged from a hospital in top quartile of Hospital Quality Alliance performance for each condition had a lower odds of dying than patients discharged from hospitals in the bottom quartile performance (AMI: OR=0.91, 95% Cl=0.86, 0.96; CHF: OR=0.92, 95% Cl=0.88, 0.98; pneumonia: OR=0.90, 95% Cl=0.86, 0.95 ). Assessment of Methodological Quality Poor: The data used to generate mortality rates predates the data on quality measures, which may not reflect the quality of care delivered at the time of the inpatient mortality data. Quality composites used in analyses included measures of
- 47. care delivered at discharge, would not affect inpatient mortality rates. Reference Jha et al., 2011 111 Setting Hospital Study Design Cross-sectional analysis of relationship between hospital quality of process-of-care measures, costs and mortality using the 2007 Hospital Compare data, 2005 MEDPAR data linked with the 2005 Medicare Beneficiary file, 2007 American Hospital Association data, 2007 information on hospital-specific cost-to-charge ratios, disproportionate share hospital (DSH) index a
- 48. and ratio of interns and residents to beds, 2007 Area Resource File with county-level socioeconomic information, and the 2008 Hospital Consumer Assessment of Healthcare Providers and Systems (HCAHPS) survey. Hospital-level risk-adjusted cost ratios (actual to expected costs), quality composite scores, mortality rates, and HCAHPS scores were estimated. Four groups of hospitals were identified: those in the highest quartile of performance and lowest quartile of cost (best), those in the lowest quartile of performance and highest quartile of costs (worst), those in the highest quartile of performance and highest quartile of costs, those in the lowest quartile of performance and lowest quartile of costs. Program Measure(s) Patient Outcome(s) • Process-of-care measures for AMI, CHF, pneumonia and prevention of surgical complications. • Summary scores
- 49. were created for each condition using the Joint Commission's methodology for those hospitals. 36 • 30-day risk adjusted mortality rate for patients hospitalized with AMI, CHF, and pneumonia. Findings Assessment of Methodological Quality • AMI patients admitted Fair to low-quality hospitals had a higher probability of death than those admitted to the "best" hospitals (low cost, low quality OR=1.12; high cost, low quality OR=1.1 O; analysis of variance p- value= .005).
- 50. • Pneumonia patients also had a higher probability of death when admitted to low- quality hospitals (low cost, low quality OR=1.19; high cost, low quality OR=1.07; analysis of variance p- value<.001 ). • No significant difference observed for CHF. Reference Setting Krumholz et al., Hospital 2013 141 Study Design Program Measure(s) Patient Outcome(s) 30-day readmissions and 30-day Not applicable mortality were identified for a cohort of aged Medicare beneficiaries with an index hospitalization with a primary diagnosis of AMI, CHF, or pneumonia between July 1, 2005, and June 30, 2008. 30-day all-
- 51. cause risk-standardized readmission rate (RSRR) and risk-standardized mortality rate (RSMR) were estimated for each hospital using hierarchical logistic regression models that adjusted for patients demographic and clinical characteristics and accounted for patient clustering within hospitals, and had hospital- specific random effects. For each condition, hospitals were considered high performers if they were in the lowest quartile for RSMR and RSRR and lower performers if they were in the highest quartile for both. Analysis included 4506 hospitals for AMI, 4767 hospitals for CHF, and 4811 hospitals for pneumonia. 37 For AMI, CHF, and pneumonia • 30-day all-cause risk-standardized mortality rates (RSM Rs) • 30-day, all- cause, risk- standardized readmission rates (RSRRs)
- 52. Findings Assessment of Methodological Quality • Overall, there was no Good association between RSMR and RSRRs for AMI or pneumonia. • There was a negative association between RSMRs and RSRRs for CHF (r=-.17, 95% Cl -.20 to -.14). Reference Setting Nicholas et al., Hospital 2010 133 Study Design Cross-sectional analysis of SCIP measures reported on Hospital Compare data Jan 1, 2005-Dec 31, 2006, and patient outcomes derived from MEDPAR data for
- 53. patients with 1 of 6 high-risk surgical procedures (abdominal aortic aneurysm repair, aortic valve repair, coronary artery bypass graft, esophageal resection, mitral valve repair and pancreatic resection) using hierarchical linear models to assess associations. Models controlled for hospital-level procedure volume and patient characteristics and comorbidity using the Charlson comorbidity index, whether the admission was scheduled, emergent or urgent, zip code-level median income, year of admission and hospital random effects. Hospitals were placed in low (bottom quintile of performance), medium (middle three quintiles of performance) and high (top quintile of performance) compliance groups based on opportunity composite score. Analyses included 2,189 hospitals. Program Measure(s) Patient Outcome(s) • 2 SCIP measures in 2005: • An additional 3
- 54. measures were included in 2006 • An opportunity composite score was created 38 • 30-day risk- adjusted postoperative mortality rate, venous thrombo- embolism, and surgical site infection. Findings Assessment of Methodological Quality • In univariate analyses, Good there were no significant associations between process measures and mortality except for aortic valve replacement where hospitals with highest
- 55. SCIP compliance had lower mortality rates. • In multivariate analyses, neither high nor low compliance hospitals were significantly different from hospitals with middle compliance; nor did high and lower compliance hospitals have different mortality rates from one another. • Unadjusted complication rates were lower among hospitals in the lowest compliance quintile than those in the highest compliance quintiles. Results were not significant in multivariate analyses. Reference Setting Peterson et al., Hospital 2006
- 56. 125 Study Design The association between process-of-care measures for patients presenting with symptoms consistent with acute coronary syndrome to 350 hospitals participating in the "Can Rapid Risk Stratification of Unstable Angina Patients Suppress Adverse Outcomes with Early Implementation of the American College of Cardiology/American Hospital Association Guideline" (CRUSADE) National Quality Improvement Initiative between January 1, 2001, and September 30, 2003, and in-hospital mortality was examined using Pearson correlation coefficients and Cochran-Armitage test for trend. Adjusted mortality rates were estimated using hierarchical generalized linear mixed models adjusting for patient characteristics, comorbid conditions, and a patient's propensity to be treated at a top quartile center. Program Measure(s) Patient Outcome(s) • 9 cardiac process
- 57. of-care measures • Opportunity model composite was created 39 • In-hospital mortality Findings Assessment of Methodological Quality • Improved performance Fair on process measures was significantly, though modestly, associated with lower in-hospital mortality (ranging from -.12 to - .36) (p<.05) except for beta blocker within 24 hours and beta-blocker at discharge, which were not significant. • Composite measure of quality was negatively associated with in- hospital mortality (r=-
- 58. .30, p<.001 ). • The adjusted in hospital mortality rate for hospitals in the top quartile was 6.31 % versus 4.15% for hospitals in the 4th quartile (OR=0.81, p<.001). Reference Setting Popescu et al., Hospital 2009 142 Study Design The association between AMI process measures 2004-2006 and risk-adjusted 30-day mortality for 2005 was assessed for 2761 hospitals reporting AMI measures to the Hospital Compare database. Hospitals were categorized as high adherence (top decile of performance on AMI measures for 3 consecutive years), low adherence (lowest decile of performance for 3 consecutive years), or
- 59. intermediate performance (all other hospitals in sample). 30-day mortality rates for AMI patients were estimated using multivariable mixed models controlling for patient sociodemographic characteristics and comorbidity as well as hospital random effects. Program Measure(s) Patient Outcome(s) • 5 AMI process measures • Opportunity model composite was created 40 • 30-day mortality Findings Assessment of Methodological Quality • Mean AMI Fair performance varied significantly across the three groups p<.001 ).
- 60. • Low-performing hospitals had higher unadjusted 30-day mortality rates (23.6% vs. 17.8% vs. 14.9%, p< 0.001). • Differences persisted after adjusting for patient characteristics (16.3% vs. 16.0% vs. 15.7%; P 0.02). Reference Setting Quattromani et Hospital al., 2011 143 Study Design Cross-sectional analysis of 95,704 adult emergency department admissions with a principal diagnosis of pneumonia from 530 hospitals in the 2007 Hospital Healthcare Cost and Utilization's National Inpatient Sample linked with hospital-level data on the timely receipt of
- 61. antibiotics and American Hospital Association data. Hospitals were placed in quartiles based on their timely receipt of antibiotics performance. A population- averaged logistic regression model controlled for patient demographics and comorbid conditions, weekend admission, and accounting for correlation of patients within hospitals. Program Measure(s) Patient Outcome(s) • Receipt of first dose of antibiotics within 4 hours of arrival at hospital 41 • All-cause inpatient mortality Findings Assessment of Methodological Quality • No significant Fair associations found; compared with the
- 62. lowest-performing hospitals, the risk- adjusted OR of mortality was 0.89 (95% Cl= 0.77 to 1.02) in the highest- performing time-to- first-antibiotic-dose quartile, 0.94 (95% Cl = 0.82 to 1.08) in the second quartile, 0.91 (95% Cl= 0.79 to 1.05) in the third quartile. Reference Ryan et al., 2009 78 Setting Hospital Study Design Medicare inpatient claims and Hospital Compare process-of- care measures for 2004-2006 were used to assess relationship between the process measures
- 63. and risk-adjusted patient outcomes. One model estimated the relationship between performance and the log of risk- adjusted mortality, controlling for hospital characteristics, year and hospital characteristics - year interactions. The second model included hospital fixed effects to capture unobserved characteristics as well as year and hospital characteristics interacted with year. Excluded from analysis were transfer patients and hospitals with less than 10 patients for each measure. Program Measure(s) Patient Outcome(s) • 5 AM I process measures • 2 CHF process measures • 3 pneumonia process measures • Two methods for creating composites were used: • The weighted sum
- 64. of z-scores for process measures for each diagnosis • The z-score of the unweighted sum of each process measure for each diagnosis 42 • Risk-adjusted 30-day mortality for AMI, CHF, and pneumonia Findings Assessment of Methodological Quality • Based on the models Good with hospital characteristics, a one standard-deviation increase in process measure composite was associated with a 9% reduction in mortality for AMI (p<.01 ), 1.5% reduction for CHF
- 65. (p<.05) and 1.9% reduction for pneumonia (p<.01 ). • Associations no longer significant when hospital fixed effects included in the models. • These results are supported by finding that while small process performance improvements from 2004 to 2006, there were not similar changes in mortality. Reference Stefan et al., 2013 132 Setting Hospital Study Design The association between Hospital Compare process quality measures and 30-day
- 66. readmission for patient with AMI, CHF, or pneumonia and those undergoing major surgery in 2007 was examined using Spearman rank correlations. Data were obtained from the Quality Improvement Organization Clinical Data Warehouse. 30-day readmission rates were estimated using the same technique as CMS for the Hospital Compare website, with hierarchical generalized linear models accounting for patient clustering within hospitals, adjusted for patient characteristics, zip-code level median income, comorbidities, discharge disposition, number of admissions in previous year, and length of stay relative to median length of stay for that condition. A ratio of predicted to expected readmission rate was calculated for each hospital for each condition. Hospitals were placed into quartiles based on performance score for each condition and the absolute difference in mean risk- standardized readmission rates of hospitals in the highest and lowest quartiles of performance calculated.
- 67. Program Measure(s) Patient Outcome(s) • 8 AMI process measures • 7 pneumonia process measures • 4 CHF process measures • 9 SCIP measures • Two sets of composite adherence scores used. (1) an opportunities composite and (2) an appropriate care composite (i.e., did patients receive all care processes for which they were eligible?) 43 • Condition specific 30-day risk standardized readmission rate
- 68. (only for those also included in process-of-care measures) Findings Assessment of Methodological Quality • Higher performance Good scores were significantly, but weakly correlated with lower readmission rates for pneumonia (r=-.07, p<.0001 ), AMI (-.10, p<.0001) and orthopedic surgery (r=- .06, p<.003), but not heart failure, abdominal surgery or cardiac and vascular surgery. • Results very similar whether opportunity model or appropriate care composite used. • Multivariable models with process measures and hospital characteristics
- 69. explained a very small amount of total variation in hospital- level readmission rates. • The difference in mean risk-standardized readmission rates between hospitals in the 1st and 4th quartiles of process performance significant for AMI, but difference in readmission rates only 0.3 percentage points. Reference Werner and Brad low, 2006 135 Setting Hospital Study Design
- 70. Examined correlation between Hospital Quality Alliance 10 measure starter set from Hospital Compare for 2004 and hospital- level patient outcomes calculated using 2004 MEDPAR data and risk adjusted using the Elixhauser method, patient characteristics, and whether the admission was emergent or elective in 3657 hospitals using. Hospitals were grouped into thirds based on average 1-year risk-adjusted mortality rate for each condition. A Bayesian approached was used to assess relationship between composite measures, individual performance measures and condition-specific outcomes. The relationship between hospital performance and outcomes were estimated controlling for hospital characteristics. Program Measure(s) • 5 AMI process measures • 2 CHF process measures • 3 pneumonia process measures
- 71. • Two composite measures created • Opportunity model composite • An "all or none" measure that identified hospitals that performed above the 75th percentile on every measure they reported and hospitals that performed below the 75th percentile on every measure reported 44 Patient Outcome(s) • Condition- specific inpatient mortality • Condition specific 30-day mortality • 1-year risk adjusted mortality rates
- 72. Assessment of Methodological Findings Quality • Adjusting for hospital Good characteristics, hospitals in the 75th percentile had significantly lower inpatient mortality than those performing in the 25th percentile for each condition's composite measure and most of the individual measures. • The absolute risk reduction (ARR) was small, ranging from .001 for CHF to .005 for both AMI and pneumonia. • Results were similar for 30-day mortality. • Results for 1-year mortality were significant for AMI and pneumonia, but not for CHF. • Comparing hospitals performing above the 75th percentile on all measures to those performing below the
- 73. 25th percentile on all measures, the ARR for AMI ranged from 0.008 (p=.06) for inpatient mortality to 0.18 (p=.008) for 1-year mortality. • The ARR for pneumonia was .014 (p<.001) in inpatient mortality, .003 (p=.00) for 30 day mortality and 0.13 (p<.001) for 1 year mortality. Reference Setting Kralewski et al., Ambulatory 201i 38 care Study Design Cross-sectional study of 133,703 Medicare patients with diabetes treated by 234 group practices in 2009. Patients were attributed to the practice where they received the plurality of their care. Claims data were used to assess lab testing, emergency department use, hospitalizations and total costs. Practice structural characteristics were obtained from the 2009 practice survey of
- 74. the Medical Group Management Association. Regression analysis was used to assess association between measures and risk- adjusted outcomes. Program Measure(s) Patient Outcome(s) • LDL lab test during the past year 45 • Inappropriate emergency department use • Avoidable hospitalizations • Costs per patient with diabetes Findings • LDL testing for an additional one percentage point of diabetics in the practice was associated with reduced per capita costs of $51 (p<.001 ), fewer primary care treatable emergency visits (p<.001) and few
- 75. avoidable hospitalizations (p<.001). Assessment of Methodological Quality Fair Reference Setting Ryan and Ambulatory Doran, 201i 37 care Study Design Retrospective analysis of the amount of improvement in incentivized intermediate outcomes was a result of improvements in incentivized process measures for diabetes, coronary heart disease, stroke, epilepsy, and hypertension using 2004-2008 data from a panel of family practices participation in the UK's Quality Outcomes Framework. Data on practice performance was linked to patient and practice characteristics and community-level Index of Deprivation. The number of
- 76. included practices ranged from 3864 (epilepsy) to 6822 (diabetes). "Opportunities model" composite measures were created for each year separately for process and outcomes measures for each condition for each practice. Longitudinal fixed effects models controlling for composite process components performance for all other conditions and year fixed effects were used to estimate the extent to which improvements in incentivized outcomes were due to improvements in incentivized process measures. Separate models were run for each diagnosis. Standard errors accounted for clustering at the practice level. Program Measure(s) Patient Outcome(s) • 10 diabetes process measures • 5 coronary heart disease process measures • 3 stroke process measures • 2 epilepsy process measures
- 77. • 1 hypertension process measure 46 • Intermediate outcomes • 4 for diabetes • 2 for coronary heart disease • 2 for stroke • 1 for epilepsy • 1 for hypertension Findings • A 10 percentage point increase in process composite was associate with an increase in the outcome performance of 3.16 percentage points for diabetes, 4.32 percentage points for coronary heart disease, 7.60 percentage points for stroke, 7 .24 percentage points for epilepsy and 7 .16
- 78. percentage points for hypertension. • The amount of increase in the outcome composite due to the change in the process composite was 29.6% for diabetes, 25.6% for coronary heart disease, 34.7% for stroke, 29.1 % for epilepsy, and 17.7% for hypertension. Assessment of Methodological Quality Good Reference Sidorenkov et al., 2011 136 Setting Multiple settings
- 79. Study Design Systematic review of literature indexed on MEDLINE and Embase up through May 1, 2010, that focused on relationship between quality indicators and outcomes for diabetes care. Studies were classified as high, medium, or low quality. 24 studies were identified, 17 of which evaluated intermediate outcomes. Of the studies assessing "hard" outcomes, 3 were cohort and 4 were case- control studies Program Measure(s) • Adequate drug treatment • visits and exams • HbA 1 c tests • other or composite tests/exams 47 Patient Outcome(s)
- 80. • Hospitalizations • Treatment related complications, • Disease-related complications, hospital • Readmissions, • Microvascular complications or lower extremity amputations • Macrovascular complications • Death • Composite physical and/or mental health score Assessment of Methodological Findings Quality • Few associations Good
- 81. between process measures and outcome measures were identified. One study showed adequate drug treatment of patients hospitalized for diabetes was associated with fewer treatment-related complications, but another study 144 found no association with readmission rates. • A medium-quality cohort study found HbA1c testing was associated with decreased macrovascular complications and kidney disease, but not microvascular complications or death. 145 • Lipid testing was
- 82. associated with fewer lower extremity complications, while eye exams were not. • A high-quality study showed a composite measure that captured HbA 1 c testing, eye exams, LDL screening and nephropathy monitoring was associated with better mental health status but not physical health status as measured by the SF36. 146 Reference Werner et al., 2013 74 Setting Nursing home
- 83. Study Design Assessed the extent to which changes in nursing home process measures account for changes in outcome measures among 16,623 nursing homes reporting data from 2000 to 2009 for the Online Survey, Certification, and Reporting and nursing home Minimum Data Set. Analyses included facility fixed effects, time-varying facility characteristics, indicator for quarter of the year to capture seasonal effects, and quarter interacted with process measures. Program Measure(s) Patient Outcome(s) • 6 process measures focused on pain management, written bladder training program, preventive skin care, receiving tube feeds, mechanically altered diets, assist devices while eating • 4 outcome
- 84. measures focused on long- stay residents with moderate or severe pain, catheter inserted and left in their bladder, pressure sores, or significant weight loss Findings Assessment of Methodological Quality • Approximately one- Good third of the improvements in the percentage of nursing home patients in moderate or severe change were due to changes in process measures. • None of the improvements in other outcome measures appeared to be related to improvement in process measures.
- 85. NOTE: Not all of the studies listed in the table were conducted in the context of a P4P experiment; rather, the measures that were the focus of the study are typically found within P4P programs. a DSH hospitals are those that receive compensation through Medicare for treating a disproportionate number of indigent patients. 48
- 86. Reference Amundson et al., 2003 30 An et al., 2008 49 Armour et al., 2004 32 Table 3.4. Evidence on Effectiveness of Physician and Physician Group Pay-for-Performance Programs Program Description Health Partners P4P focused on tobacco Ask and Advice rates from 1996 to 1999 Collaborative project between Fairview Physician Associates and multiple Minnesota health plans to encourage referrals to health plan
- 87. sponsored quit line from 2005 to 2006 Large managed care health plan operating in the southeastern United States implemented a year- end bonus program that was designed, in part, to improve colorectal cancer screening use among an individual practice association's PCPs from a 1 0-month period across 2001- 2002 Study Design Longitudinal study of participants RCT of usual care vs. P4P for quit line referrals Pre-post study of P4P cohort Incentive Structure
- 88. Bonus pool Clinic receives $5,000 for 50 quit line referrals Bonus payment Measures Examined Process: Documentation and discussion of tobacco use Process: Rates of referral; contact and enrollment after referral; and project costs Process: Colorectal cancer screening 62 Findings Process: Mean ask rate increased from 49% to 73% Advise rate increased from 32% to 53% Process:
- 89. 11.4% of smokers were referred in P4P group compared with 4.2% in the control group (p=0.001) Process: From 2000 to 2001, colorectal cancer screening use increased from 23.4% to 26.4% (p< 0.01). Assessment of Methodological Quality Poor: Regional population, no modeling to control for confounders Fair Poor: Short study period, cross- sectional with limited controls Reference Bardach et al., 2013 147
- 90. Program Description Study Design P4P experiment Cluster-RCT, between April 2009 84 small and March 2010 primary care among small primary practices. care practices (<10 Intervention physicians) in New received York City. incentives and In addition to financial quarterly incentives, clinics performance were provided with reports, while EHR software with control received decision-support and only patient registry performance functions and QI reports. specialists that offered One-year technical assistance. evaluation. Incentive Structure Incentive paid to the clinic/practice. Incentive paid for every instance of patient meeting the quality criteria. Higher incentive payments given for patients who were sicker, had Medicaid insurance or were uninsured.
- 91. Bonuses were a maximum of $200/patient and $100,000/clinic Range of payments was to clinics was $600-$100, 000 (median $9,900). Measures Examined Process: Aspirin or anthrombotic prescription Smoking cessation Outcomes: Blood pressure control Cholesterol control 63 Findings Process: Adjusted change in performance significantly higher in the intervention group than controls for aspirin or antithrombotic prescription by 6.0% (p=0.001 )for patients with ischemic vascular disease or diabetes
- 92. Outcomes: Adjusted change in blood pressure control significantly higher in the intervention group than control by • 5.5% (p=0.01) among patients with only hypertension • 7 .8% among patients with hypertension and diabetes • 7 .8% (p=0.01) for patients with hypertension, diabetes and ischemic vascular disease No difference in cholesterol control (p=0.22) Changes were higher for uninsured or Medicaid patients in intervention clinics compared with controls, except for cholesterol control. Assessment of Methodological Quality Good: Randomized study design, although short study duration. Findings may not
- 93. generalizable to larger practices or those without EHRs or QI assistance. Reference Beaulieu and Horri�an 2005 Chen et al., 2010a50 Program Description In 2001, a managed care organization in upstate New York designed and implemented a pilot program to financially reward doctors for the quality of care delivered to diabetic patients across an 8- month period. P4P program initiated by preferred provider organization (PPO) in Hawaii from 1998 to 2007
- 94. Study Design Pre-post with comparison group Compared pre- post changes of intervention group to comparison group in a different state Incentive Structure Incentive payment equivalent to a 12% increase in PMPM reimbursement if performance goals are met Additional 1.5- 7 .5% of base salary to perform processes of care Measures Examined Process: 6 measures of diabetes care quality Outcome:
- 95. 3 diabetes outcome measure Process: ACE inhibitor use among CHF patients, mammography, cervical cancer screening, colorectal cancer screening, HbA 1 c testing for diabetes, the varicella vaccine, and the measles, mumps, rubella (MMR) vaccine 64 Findings Process: Physicians and patients achieved significant improvement on five out of six process measures. Outcome: Physicians and patients achieved significant improvement on two out of three outcome measures (HbA1c control and LDL control). Process: P4P group had significantly greater increases in quality scores than the comparison group for cervical cancer screening and HbA 1 c testing.
- 96. P4P group had significantly greater increases than the non- P4P group in quality scores for mammography and varicella for the 2nd to 3rd year. P4P group improved less than the non-P4P group for colorectal cancer screening every year, except from the 3rd to the 4th year Assessment of Methodological Quality Poor: Small number of study participants (n= 17 physicians). Physicians self- selected; one small region, short duration, physicians not matched at baseline. Comparison patients had higher baseline performance on all measures Fair Assessment of Incentive Methodological
- 97. Reference Program Description Study Design Structure Measures Examined Findings Quality Chen et al., PPO in Hawaii Longitudinal 1.5-7.5% of base Process: Process: Fair 2010b 48 provided incentives to study salary to perform Diabetes processes of care Improved diabetes quality care physician to improve comparing processes of care Outcome: compared with non-P4P quality and reduce participating Hospitalizations participating physicians among hospitalizations from practices with patients who saw p4P providers 1999 to 2006 nonparticipating throughout entire study period practices (OR=1.20; 95% Cl, 1.05-1.37, p<0.01). Reduction in hospitalization for patients who saw p4P providers throughout entire study period Chen et al., Health plan in Hawaii Longitudinal Bonus of 3.5% of Process: Process: Fair 2011 149 incentivizes multivariate professional fees LDL testing, statin P4P group improved (32%-70%) participating regression prescribing compared with non-P4P group physicians additional models (40%-61 %) on quality composite
- 98. payments to improve comparing 2 cardiovascular participants to disease quality nonparticipants measures from 2000 to 2006 Chien et al., New York Medicaid Difference-in- $200 bonus Process: Process: Good: Regional but 2010 22 nonprofit plan differences payment for each 2-year old immunizations Immunization rates within multiple years of implemented a P4P comparing fully immunized 2- Hudson Health Plan rose at a observation and program that participants and year-old significantly, albeit modestly, strong difference and incentivized nonparticipants higher rate than the robust difference design immunization delivery pre-post secular trend noted among to 2-year-olds from comparison health plans. 2003 to 2007 65 Reference Chien et al., 2012b69 Chunj et al., 2003 Chung et al.,
- 99. 2010a 103 Program Description New York Medicaid nonprofit plan implemented a P4P program that incentivized improvements in diabetes care and outcomes in 2003- 2007 Voluntary P4P program implemented by a health plan in Hawaii from 1997 to 2000. RCT of the effects of the frequency of a P4P bonus on performance in Palo Alto Medical Foundation over the course of a 1-year study period. Study Design Difference-in- differences comparing participants and nonparticipants
- 100. pre-post Time trend of participants RCT Incentive Structure $100-$300 bonus payments for each patient completing all the missing care processes 3.5% above base fees Bonus payment of up to 2% of base salary Measures Examined Process: Diabetes quality measures (HbA1c testing, lipid testing, dilated eye exams, lipid control) Outcome: Diabetes outcome measures (e.g., BP and HbA1c and LDL levels)
- 101. Process: Use of ACE inhibitors or angiotensin receptor blockers in CHF, measurement of HbA1c in diabetes, and rates of childhood immunizations Process: Six process measures (prescription of asthma controller, cervical cancer screening, chlamydia screening, colon cancer screening, whether the height and weight were measured and recorded, and documentation of tobacco use history) Outcome: 3 outcome measures for diabetes control (BP 130/BOmmHg, HbA1co7%, and LDLo100 mg/dl) 66 Findings Process: Between pre- and post- intervention periods, changes on available diabetes measures were not statistically significant
- 102. Outcome: Changes in diabetes outcome measures were not statistically significant when compared with non-Hudson plans Process: ACE inhibitor rate increased from 40.8 to 64.2% for CHF patients (p<0.001) HbA 1 c testing increased from 51.5 to 79.6% (P<0.0001) MMR immunization rates varied and no consistent tend could be identified Process: Frequency of bonus payment did not affect process or outcome measures. Assessment of Methodological Quality Good: Regional but multiple years of observation and strong difference and difference design Poor: No contemporaneous
- 103. control group, case study only Fair Assessment of Incentive Methodological Reference Program Description Study Design Structure Measures Examined Findings Quality Chung et al., P4P program within Pre-post Bonus payment of Process: Process: Poor: Single practice 2010b 33 single clinic in comparison of up to 2% of base 5 measures related to From 2006 to 2007, 8 of 9 no comparison group California from 2005 participants salary screening, asthma incentivized and previously to 2007 medication prescribing, and reported measures showed prevention significant improvement (mix of process and outcome measures) Coleman et A large federally Pre-post Reduction in base Process: Process: Poor: Single al., 2007 27 qualified health center comparison of salary couple with Avg. annual # of encounters From 2003 (pre-P4P) to 2004 organization, no implemented single practice bonus payments for per diabetic
- 104. patient, % (1st year P4P), significant comparison group, incentives for absolute meeting diabetic patients with any increase (16.2%) in biannual and relatively short performance and productivity goals HbA1c test, HbA 1 c testing for diabetic time frame improvement on Outcome: patients (p<0.001) process and outcome % diabetic patients with Outcome: measures in 2004. recommended number of No significant improvement in HbA 1 c tests, % diabetic blood sugar control (HbA 1 c< 7 or patients with controlled HbA 1 c <9) in ACCESS patients blood sugar (HbA1c <7, or Medicaid patients from NCQA HbA1c<9). dataset (OLS p=.1639) Collier, 2007�� A community health Pre-post Bonus Structure: Structure: Poor: Only a single care system comparing 24/7 access to care, Almost all of the measures were organization, and implemented a P4P participants to maintaining at most an 18:1 accomplished analytic methods program for 12 nonparticipants physician to patient ratio, Process: poorly explained hospitalists on a range dictating medical records Although the contracted group of structural, process, within 12 hours and did not consistently meet all Joint and utilization providing discharge Commission/CMS targets, measures from 2003 summaries within 24 hours, compliance with most quality to 2006 attending monthly hospital indicators improved to a greater meetings, and having extent than a concurrent non- membership in the Society contracted group. of Hospitalists
- 105. Process: CMS/Joint Commission process measures 67 Assessment of Incentive Methodological Reference Program Description Study Design Structure Measures Examined Findings Quality Curtin et al., P4P program that was Pre-post cost 10% salary Costs: Costs: Poor: Single entity 2006 3 a 5-year partnership analysis withhold returned Costs PMPM Positive return on investment of and "benefit" (2000-2004) between focused on when goals are met Return on investment 1.6:1.0 in 2003 and 2.5:1.0 in measured simply as Excellus health plan return on 2004 pre-post comparison. and a Rochester, New investment Little analytic work to York, independent deal with confounding practice association factors. Cutler et al., IHA program is a Cross sectional Bonus above base Process: Process: Poor: Short study 2007 28 state-wide P4P (2004) PMPM capitation LDL testing and control for Higher proportion of patients in period, cross-
- 106. program providing comparison of payment patients with diabetes P4P group who attained LDL-C sectional, no controls physician groups with participants and goal (<130 mg per dl) those in for confounding bonuses for meeting nonparticipants the routine care (78.2% vs. factors. patient experience, 55.7%, p<.001). process, and outcome Higher rate of achieving a LDL-C measure. This study <100 mg per dl than those in the focuses on Mercy routine care group ( 46.7% vs. Medical Group. 35.2%, p =.004) Fagan et al., Intervention by Longitudinal Bonus payment up Process: Process: Good: Relatively 2010 40 national managed (2004-2006) to 20% of the 5 incentivized quality Quality of care generally large region, care organization to study in which capitation fee for measures (influenza improved for both groups during difference- difference provide P4P bonus pre- and post- Medicare managed vaccine, HbA1c testing, eye the study period. Only slight design to control for payments to 9 PCP data from care organization exam, LDL screening, and differences were seen between time invariant practices for meeting intervention patients nephropathy screening), 2 the intervention and comparison confounders. quality of care compared with non-incentivized measures group trends and changes in measures comparison (avoiding short-acting trends over time. practices antihypertensive and Costs: prescribing an ACE/
- 107. No significant differences were angiotensin receptor blocker medication for diabetics with observed in the average total renal insufficiency) medical cost trends per member per month (p=.42) between P4P Costs: and non-P4P members with Emergency department diabetes from baseline to follow- utilization, and total paid up costs 68 Assessment of Incentive Methodological Reference Program Description Study Design Structure Measures Examined Findings Quality Fairbrother et RCT of 57 inner-city RCT $1,000-$7,500 Process: Process: Fair al., 2001 23 physicians bonus depending Up-to-date immunization Both the bonus and the randomized to a P4P on improvement coverage enhanced FFS groups improved bonus.enhanced- level significantly in documented up-to- FFS, or control group date immunization status (Bonus:
- 108. in 1997-1998 49.7 to 55,6%, p<0.05; Enhanced FFS: 50.8 to 58.2%, p<0.01) compared with the control group. Steady increases, but no significant difference in number of well child visits. Improvement was due primarily to improved documentation rather than actual vaccines given. Missed opportunities (when vaccines were due but not given) did not change. Felt-Lisk et al., 5 Medicaid health Pre-post Bonus payments Process: Process: Fair 2007 44 plans that changes in based on the % of plan members with 6 or From pre-implementation (2002 implemented P4P participants with number of patients more well-baby visits by age to 2003) to post implementation programs from 2002 a limited receiving well-baby 15 months (2004 to 2005), 2-year average to 2005 comparison to visits HEDIS scores improved 7.5-27 national trends percentage points. Large effects not seen in 4 of 5 plans. Gavagan 51 et Rewarding Results Longitudinal $4,000-$12,000 Process:
- 109. Process: Fair al., 2010 Collaborative analysis with bonus payment Preventive care (cervical Found no evidence for a clinically Demonstration: comparison depending on cancer screening, significant effect of financial Physicians at 6 of 11 group performance mammography, pediatric incentives on performance of clinics were given immunization) preventive care incentives for achieving group targets in preventive care. 69 Assessment of Incentive Methodological Reference Program Description Study Design Structure Measures Examined Findings Quality Gilmore et al., P4P program Compared Bonus of 1 %-5% of Process: Process: Fair 2007 25 providing bonuses to changes over base professional 11 process measures Positive association between individual physicians time between fees related to screening, care for having seen only program- for absolute participating diabetes, hypertension, participating providers and performance on physicians and asthma, CHF, and high receiving
- 110. recommended care for patient experience, nonparticipating cholesterol, prevention all 6 years recommended care for structural, quality and physicians all 6 years (OR: 1.09, 95%: practice pattern 1.072-1.10). measure from 1998 to 2003 Greene et al., Large, multifaceted QI Pre-post no 15% payment Process: Process: Poor: No comparison 2004 35 intervention consisting comparison withhold returned Overall exceptions per 1,000 A statistical process control chart group and no of physician group based on episodes, acute sinusitis showed a shift toward apparent controls for education, profiling, performance care pathway exceptions per recommended treatment patterns confounding factors. and a financial 1,000 episodes, services per after our intervention. incentive, to improve 1,000 episodes of acute treatment quality for sinusitis acute sinusitis in Rochester from 1999 to 2001 Hung and AHRQ health Cross-sectional Unclear Process: Process: Poor: Single year, Green 2012 31 promotion initiative comparison of Smoking cessation Practices that were involved with small sample size,
- 111. offering incentives to participants and counseling, linking patients P4P had greater odds of offering and limited controls PCPs to improve on nonparticipants to smoking cessation recommended cessation for confounding smoking cessation services in community counseling (OR= 27.6, p <0.01) factors. measures 70 Assessment of Incentive Methodological Reference Program Description Study Design Structure Measures Examined Findings Quality Larsen et al., Health care system Longitudinal Bonus of 0.5% to Process: Process: Poor: Single system, 2003 29 implemented a multi- analysis no 1% of total Rates of testing of HbA1c HbA 1 c test increased from 78.5% no comparison group, faceted diabetes care comparison physician and LDL, rate of annual eye in 1998 to 90.5% in 2002. no controls for program, which group compensation exams, LDL cholesterol screening test confounders. included financial Outcome: within the prior 2 years increased incentives for LDL and HbA 1 c values from 65.9% in 1998 to 91. 7% in individual physicians 2002. for diabetes QI from
- 112. Annual eye exam increased from 1998 to 2002 52% in 1998 to 62% in 2002. Outcome: % with HbA1c less than 7.0 increased from 33.5% in 1998 to 52.8% in 2002. Average HbA 1 c decreased from 8.1 in 1998 to 7.3 in 2002. % with HbA 1 c greater than 9.5 decreased from 34.6% in 1998 to 21.4% in 2002. % with LDL cholesterol was less than 130 mg/dL increased from 39.9% in 1998 to 69.8% in 2002. Leitman et al., Beth Israel Medical Pre-post Gainshare Cost: Cost: Poor: Single system, 2010 39 Center implemented a analysis Cost-savings, average LOS, $7 million savings compared P4P and shared comparing Process: Process: participating savings program for participating Quality measures for AMI, Change in quality measures not physicians with individual physicians and CHF, pneumonia statistically significant nonparticipating using patient nonparticipating Outcome: Outcomes:
- 113. physicians, with experience, patient physicians unclear controls for safety, process, 30-day mortality or No measurable change in 30-day confounding factors. outcome, and readmission mortality or readmission efficiency measures between 2006 and 2009. 71 Reference Lester et al., 2010 46 Program Description 35 medical facilities participating in a P4P program through Kaiser Permanente Northern California from 1997 to 2007. Study Design
- 114. Longitudinal analysis of participants including removal of incentives Incentive Structure Bonus Measures Examined Process: Screening for diabetic retinopathy, cervical cancer Outcome: Control of hypertension (systolic blood pressure <140 mm Hg), Glycemic control (HbA1c <8%) 72 Findings Process: Removing incentives for diabetic retinopathy screening declined on average by approx. 3% per year (mean change 3.1 %, 95% Cl, 2.4% to 3.8%) and cervical cancer screening by an average
- 115. of approx. 2% per year (mean 1.6%, 95% Cl, 1.1% to 2.1%) Outcome: Hypertensive adults whose systolic BP was less than 140 mm Hg increased (58.3%to 78.2%). Glycemic control was incentivize and performance improved from 47% to 69.8% Assessment of Methodological Quality Poor: Pre-post only within a single system. Reference Levin-Scherz et al., 2006 45 Program Description Large, heterogeneous integrated delivery
- 116. network that incorporated physician quality, efficiency, and structural metrics into P4P contract Study Design Longitudinal analysis (2001-2003) comparing to state and national trends Incentive Structure Contracts included some element of withhold, often approximately 10% of hospital and/or physician fees. Some included an opportunity for bonus payments beyond the agreed-upon fee schedule. Withholds were
- 117. returned or bonuses earned depending on regional service organization and Partners Community HealthCare, lnc.(PCHI) network performance compared with previously agreed targets Measures Examined Process: Performance on adult diabetes and pediatric asthma HEDIS measures 73 Findings Process: HbA 1 c : Participants improved significantly greater than the statewide improvement rate on (7.0 vs. 4.9 percentage points, p < .05). Diabetic eye exams: participants performance improved, while statewide performance declined
- 118. slightly (18. 7 vs. -0.8 percentage points, p <O .05). Diabetic LDL screening: Participants' performance improved by almost twice as much as the state average (13.2 vs. 7.4, p < .05). Nephropathy screening: Participant rates improved over twice as much as statewide improvement (15.2 vs. 12.9 percentage points, p<0.05). All four diabetes measures: PCHl's 1st P4P plan achieved significant improvements on all 4 diabetes measures compared with national trends (p<0.05). Pediatric asthma controller: Performance improved more than the state average on every measure except pediatric asthma controller use (1.7 vs. 3.9 percentage points, p >0.05). Assessment of Methodological Quality Fair
- 119. Assessment of Incentive Methodological Reference Program Description Study Design Structure Measures Examined Findings Quality Mandel and 54 pediatric practices Longitudinal % of base pay Process: Process: Poor: Analytic Kotagal 2007 36 in the greater analysis based on reporting, Medication control, flu shots, % of the network asthma methods insufficiently Cincinnati area were (interrupted network and written self- population receiving "perfect explained to make involved in a P4P time series) performance, and management plans care" increased from 4% to 88%. strong determination. program that with no practice %of the network asthma rewarded practices for comparison performance population receiving the influenza participating in the group vaccine increased from 22% to collaborative, achieving network- 41%, and practice-level performance thresholds, and building improvement capability related to asthma from 2003 to 2006.
- 120. Mullen et al., PacifiCare Difference-in- Bonus payment of Process: Process: Good: Regional 2010 42 implemented a QI differences $500-$5,000 based Measures related to Fail to find evidence that initiative intervention but strong program in California on performance screening, diabetes, and either resulted in major design with in conjunction with the prevention improvement in quality or notable difference-in- IHA P4P program. disruption in care differences approach Study analyzed effects and multiple years of of implementing both data. programs on incentivized and non- incentivized measures from 2001 to 2005. Pearson et al., P4P programs Pre-post Combination of Process: Process: Fair 2008 5 introduced into analysis with bonuses and Measures related to process Not associated with greater physician group comparison withholds ranging measures related to improvement in quality compared contracts from 2001- group from $200 to a high screening, diabetes, and with a rising secular trend 2003 by 5 major of approximately prevention commercial health $2,500 per PCP plans in Massachusetts