Term Paper reporting the overall financial position of Bangladesh Lamps Philips as a part of our coursework for Corporate Finance I.
Disclaimer: All data shown were collected from the DSE.
Term Paper reporting the overall financial position of Bangladesh Lamps Philips as a part of our coursework for Corporate Finance I.
Disclaimer: All data shown were collected from the DSE.
Current Years Estimation PowerPoint Presentation SlidesSlideTeam
This complete deck is oriented to make sure you do not lag in your presentations. Our creatively crafted slides come with apt research and planning. This exclusive deck with thirtynine slides is here to help you to strategize, plan, analyse, or segment the topic with clear understanding and apprehension. Utilize ready to use presentation slides on Current Years Estimation Power Point Presentation Slides with all sorts of editable templates, charts and graphs, overviews, analysis templates. It is usable for marking important decisions and covering critical issues. Display and present all possible kinds of underlying nuances, progress factors for an all inclusive presentation for the teams. This presentation deck can be used by all professionals, managers, individuals, internal external teams involved in any company organization.
Special report by epic research of 12 september 2017Epic Research
Epic Research provides a special report in different segments which is specially prepared by our highly qualified research team. Our daily reports help investors to stay updated with the market news.
TIL Limited. Financial Analysis Crane Manufacturing Company in IndiaZeeshan Mir
Analysis of all the important financial statements from FY2012-13 to FY2016-17. This is my analysis of the financial statements released by the company.
Equity Financing Capacity and Stock Returns: Evidence from ChinaLalith Samarakoon
We examine the relation between the capacity for financing through rights and seasoned public offers of equity and subsequent stock returns in China. The results show that the capacity for rights and public offers is reliably negatively related with future returns for firms that met regulatory criteria. Further, the capacity for rights offers is strongly negatively related with returns for firms that met the criteria and applied for approval, and for firms that issued equity after meeting the criteria and obtaining approval. Thus, there is clear evidence of a negative relation between equity financing capacity and stock returns in China.
Ashok Leyland Q1FY15: Losses narrowed down to Rs48 mn, holdIndiaNotes.com
Ashok Leyland's Q1FY15 results were inline with estimates on the top-line front at INR 25 bn. Losses narrowed down to INR 48 mn (more than we expected) led by lower raw material costs & higher other income. Rating changed from sell to hold.
How much traffic does an Android generate, if it sends its location to a serv...Dmitri Pisarenko
Purpose of the experiment
To get a first estimate of how much traffic is generated on a mobile phone, if location data are sent
to a server (without encryption) every minute.
Tata Sponge: Q1 Net grows a whopping 145.45%, buyIndiaNotes.com
During Q1FY15, the company's net profit jumps to Rs. 442.80 million against Rs. 180.40 million in the corresponding quarter ending of previous year, an increase of 145.45%. Revenue for the quarter rose by 23.52% to Rs. 2031.20 million. Maintain buy
Gallantt Ispat: Net profit grows a robust 85.54% in Q1FY15, buyIndiaNotes.com
During the quarter, the company's net profit stood at a record Rs. 103.29 million as against Rs. 55.67 million over the corresponding quarter of last year, registered a growth of 85.54%. Maintain buy.
how to sell pi coins in South Korea profitably.DOT TECH
Yes. You can sell your pi network coins in South Korea or any other country, by finding a verified pi merchant
What is a verified pi merchant?
Since pi network is not launched yet on any exchange, the only way you can sell pi coins is by selling to a verified pi merchant, and this is because pi network is not launched yet on any exchange and no pre-sale or ico offerings Is done on pi.
Since there is no pre-sale, the only way exchanges can get pi is by buying from miners. So a pi merchant facilitates these transactions by acting as a bridge for both transactions.
How can i find a pi vendor/merchant?
Well for those who haven't traded with a pi merchant or who don't already have one. I will leave the telegram id of my personal pi merchant who i trade pi with.
Tele gram: @Pi_vendor_247
#pi #sell #nigeria #pinetwork #picoins #sellpi #Nigerian #tradepi #pinetworkcoins #sellmypi
Poonawalla Fincorp and IndusInd Bank Introduce New Co-Branded Credit Cardnickysharmasucks
The unveiling of the IndusInd Bank Poonawalla Fincorp eLITE RuPay Platinum Credit Card marks a notable milestone in the Indian financial landscape, showcasing a successful partnership between two leading institutions, Poonawalla Fincorp and IndusInd Bank. This co-branded credit card not only offers users a plethora of benefits but also reflects a commitment to innovation and adaptation. With a focus on providing value-driven and customer-centric solutions, this launch represents more than just a new product—it signifies a step towards redefining the banking experience for millions. Promising convenience, rewards, and a touch of luxury in everyday financial transactions, this collaboration aims to cater to the evolving needs of customers and set new standards in the industry.
The European Unemployment Puzzle: implications from population agingGRAPE
We study the link between the evolving age structure of the working population and unemployment. We build a large new Keynesian OLG model with a realistic age structure, labor market frictions, sticky prices, and aggregate shocks. Once calibrated to the European economy, we quantify the extent to which demographic changes over the last three decades have contributed to the decline of the unemployment rate. Our findings yield important implications for the future evolution of unemployment given the anticipated further aging of the working population in Europe. We also quantify the implications for optimal monetary policy: lowering inflation volatility becomes less costly in terms of GDP and unemployment volatility, which hints that optimal monetary policy may be more hawkish in an aging society. Finally, our results also propose a partial reversal of the European-US unemployment puzzle due to the fact that the share of young workers is expected to remain robust in the US.
Turin Startup Ecosystem 2024 - Ricerca sulle Startup e il Sistema dell'Innov...Quotidiano Piemontese
Turin Startup Ecosystem 2024
Una ricerca de il Club degli Investitori, in collaborazione con ToTeM Torino Tech Map e con il supporto della ESCP Business School e di Growth Capital
where can I find a legit pi merchant onlineDOT TECH
Yes. This is very easy what you need is a recommendation from someone who has successfully traded pi coins before with a merchant.
Who is a pi merchant?
A pi merchant is someone who buys pi network coins and resell them to Investors looking forward to hold thousands of pi coins before the open mainnet.
I will leave the telegram contact of my personal pi merchant to trade with
@Pi_vendor_247
how to sell pi coins at high rate quickly.DOT TECH
Where can I sell my pi coins at a high rate.
Pi is not launched yet on any exchange. But one can easily sell his or her pi coins to investors who want to hold pi till mainnet launch.
This means crypto whales want to hold pi. And you can get a good rate for selling pi to them. I will leave the telegram contact of my personal pi vendor below.
A vendor is someone who buys from a miner and resell it to a holder or crypto whale.
Here is the telegram contact of my vendor:
@Pi_vendor_247
Empowering the Unbanked: The Vital Role of NBFCs in Promoting Financial Inclu...Vighnesh Shashtri
In India, financial inclusion remains a critical challenge, with a significant portion of the population still unbanked. Non-Banking Financial Companies (NBFCs) have emerged as key players in bridging this gap by providing financial services to those often overlooked by traditional banking institutions. This article delves into how NBFCs are fostering financial inclusion and empowering the unbanked.
what is the best method to sell pi coins in 2024DOT TECH
The best way to sell your pi coins safely is trading with an exchange..but since pi is not launched in any exchange, and second option is through a VERIFIED pi merchant.
Who is a pi merchant?
A pi merchant is someone who buys pi coins from miners and pioneers and resell them to Investors looking forward to hold massive amounts before mainnet launch in 2026.
I will leave the telegram contact of my personal pi merchant to trade pi coins with.
@Pi_vendor_247
Introduction to Indian Financial System ()Avanish Goel
The financial system of a country is an important tool for economic development of the country, as it helps in creation of wealth by linking savings with investments.
It facilitates the flow of funds form the households (savers) to business firms (investors) to aid in wealth creation and development of both the parties
how can i use my minded pi coins I need some funds.DOT TECH
If you are interested in selling your pi coins, i have a verified pi merchant, who buys pi coins and resell them to exchanges looking forward to hold till mainnet launch.
Because the core team has announced that pi network will not be doing any pre-sale. The only way exchanges like huobi, bitmart and hotbit can get pi is by buying from miners.
Now a merchant stands in between these exchanges and the miners. As a link to make transactions smooth. Because right now in the enclosed mainnet you can't sell pi coins your self. You need the help of a merchant,
i will leave the telegram contact of my personal pi merchant below. 👇 I and my friends has traded more than 3000pi coins with him successfully.
@Pi_vendor_247
Falcon stands out as a top-tier P2P Invoice Discounting platform in India, bridging esteemed blue-chip companies and eager investors. Our goal is to transform the investment landscape in India by establishing a comprehensive destination for borrowers and investors with diverse profiles and needs, all while minimizing risk. What sets Falcon apart is the elimination of intermediaries such as commercial banks and depository institutions, allowing investors to enjoy higher yields.
Financial Assets: Debit vs Equity Securities.pptxWrito-Finance
financial assets represent claim for future benefit or cash. Financial assets are formed by establishing contracts between participants. These financial assets are used for collection of huge amounts of money for business purposes.
Two major Types: Debt Securities and Equity Securities.
Debt Securities are Also known as fixed-income securities or instruments. The type of assets is formed by establishing contracts between investor and issuer of the asset.
• The first type of Debit securities is BONDS. Bonds are issued by corporations and government (both local and national government).
• The second important type of Debit security is NOTES. Apart from similarities associated with notes and bonds, notes have shorter term maturity.
• The 3rd important type of Debit security is TRESURY BILLS. These securities have short-term ranging from three months, six months, and one year. Issuer of such securities are governments.
• Above discussed debit securities are mostly issued by governments and corporations. CERTIFICATE OF DEPOSITS CDs are issued by Banks and Financial Institutions. Risk factor associated with CDs gets reduced when issued by reputable institutions or Banks.
Following are the risk attached with debt securities: Credit risk, interest rate risk and currency risk
There are no fixed maturity dates in such securities, and asset’s value is determined by company’s performance. There are two major types of equity securities: common stock and preferred stock.
Common Stock: These are simple equity securities and bear no complexities which the preferred stock bears. Holders of such securities or instrument have the voting rights when it comes to select the company’s board of director or the business decisions to be made.
Preferred Stock: Preferred stocks are sometime referred to as hybrid securities, because it contains elements of both debit security and equity security. Preferred stock confers ownership rights to security holder that is why it is equity instrument
<a href="https://www.writofinance.com/equity-securities-features-types-risk/" >Equity securities </a> as a whole is used for capital funding for companies. Companies have multiple expenses to cover. Potential growth of company is required in competitive market. So, these securities are used for capital generation, and then uses it for company’s growth.
Concluding remarks
Both are employed in business. Businesses are often established through debit securities, then what is the need for equity securities. Companies have to cover multiple expenses and expansion of business. They can also use equity instruments for repayment of debits. So, there are multiple uses for securities. As an investor, you need tools for analysis. Investment decisions are made by carefully analyzing the market. For better analysis of the stock market, investors often employ financial analysis of companies.
how to swap pi coins to foreign currency withdrawable.DOT TECH
As of my last update, Pi is still in the testing phase and is not tradable on any exchanges.
However, Pi Network has announced plans to launch its Testnet and Mainnet in the future, which may include listing Pi on exchanges.
The current method for selling pi coins involves exchanging them with a pi vendor who purchases pi coins for investment reasons.
If you want to sell your pi coins, reach out to a pi vendor and sell them to anyone looking to sell pi coins from any country around the globe.
Below is the contact information for my personal pi vendor.
Telegram: @Pi_vendor_247
Even tho Pi network is not listed on any exchange yet.
Buying/Selling or investing in pi network coins is highly possible through the help of vendors. You can buy from vendors[ buy directly from the pi network miners and resell it]. I will leave the telegram contact of my personal vendor.
@Pi_vendor_247
Buy Orient Refractories, engineering sector to get boost from infrastructure projects
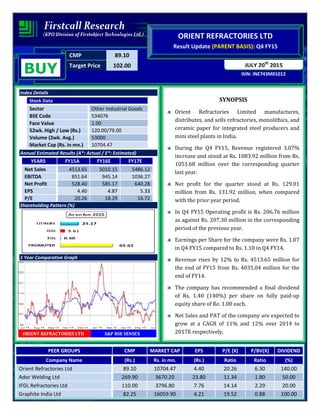
1. CMP 89.10
Target Price 102.00
ISIN: INE743M01012
JULY 20th
2015
ORIENT REFRACTORIES LTD
Result Update (PARENT BASIS): Q4 FY15
BUY
Index Details
Stock Data
Sector Other Industrial Goods
BSE Code 534076
Face Value 1.00
52wk. High / Low (Rs.) 120.00/79.00
Volume (2wk. Avg.) 53000
Market Cap (Rs. in mn.) 10704.47
Annual Estimated Results (A*: Actual / E*: Estimated)
YEARS FY15A FY16E FY17E
Net Sales 4513.65 5010.15 5486.12
EBITDA 851.64 945.14 1036.27
Net Profit 528.40 585.17 640.28
EPS 4.40 4.87 5.33
P/E 20.26 18.29 16.72
Shareholding Pattern (%)
1 Year Comparative Graph
ORIENT REFRACTORIES LTD S&P BSE SENSEX
SYNOPSIS
Orient Refractories Limited manufactures,
distributes, and sells refractories, monolithics, and
ceramic paper for integrated steel producers and
mini steel plants in India.
During the Q4 FY15, Revenue registered 3.07%
increase and stood at Rs. 1083.92 million from Rs.
1051.68 million over the corresponding quarter
last year.
Net profit for the quarter stood at Rs. 129.01
million from Rs. 131.92 million, when compared
with the prior year period.
In Q4 FY15 Operating profit is Rs. 206.76 million
as against Rs. 207.30 million in the corresponding
period of the previous year.
Earnings per Share for the company were Rs. 1.07
in Q4 FY15 compared to Rs. 1.10 in Q4 FY14.
Revenue rises by 12% to Rs. 4513.65 million for
the end of FY15 from Rs. 4035.04 million for the
end of FY14.
The company has recommended a final dividend
of Rs. 1.40 (140%) per share on fully paid-up
equity share of Re. 1.00 each.
Net Sales and PAT of the company are expected to
grow at a CAGR of 11% and 12% over 2014 to
2017E respectively.
PEER GROUPS CMP MARKET CAP EPS P/E (X) P/BV(X) DIVIDEND
Company Name (Rs.) Rs. in mn. (Rs.) Ratio Ratio (%)
Orient Refractories Ltd 89.10 10704.47 4.40 20.26 6.30 140.00
Ador Welding Ltd 269.90 3670.20 23.80 11.34 1.80 50.00
IFGL Refractories Ltd 110.00 3796.80 7.76 14.14 2.29 20.00
Graphite India Ltd 82.25 16059.90 4.21 19.52 0.88 100.00
2. QUARTERLY HIGHLIGHTS (PARENT BASIS)
Results Updates- Q4 FY15
The Company revenue for the quarter rose by 3.07% to Rs. 1083.92 million from Rs. 1051.68 million, when
compared with the prior year period. Net profit decreased by 2.21% to Rs. 129.01 million from Rs. 131.92
million, when compared with the prior year period. Reported earnings per share of the company stood at Rs.
1.07 a share during the quarter as against Rs. 1.10 over previous year period. Profit before interest, depreciation
and tax is Rs. 206.76 millions as against Rs. 207.30 million in the corresponding period of the previous year.
Break up of Expenditure
Months Mar-15 Mar-14 % Change
Net Sales 1083.92 1051.68 3.07
PAT 129.01 131.92 (2.21)
EPS 1.07 1.10 (2.21)
EBITDA 206.76 207.30 (0.26)
Break up of Expenditure
(Rs in millions)
Q4 FY15 Q4 FY14
%
CHNG
Material and related cost 442.96 420.26 5%
Purchase of stock in trade 152.07 149.97 1%
Employee Benefit Expenses 98.01 86.43 13%
Dep & Amortization Exp 13.07 7.98 64%
Other Expenses 184.00 200.66 -8%
3. COMPANY PROFILE
Orient Refractories Limited was incorporated in 2010 and is as a subsidiary of Dutch US Holding B.V. The
company manufactures, distributes, and sells refractories, monolithics, and ceramic paper for integrated steel
producers and mini steel plants in India. Its products include isostatically pressed continuous casting
refractories; slide gate plate refractories; inserts for repairing slide gate plates; metering, flying, and fixed
tundish nozzles; bottom purging refractories and top purging lances for steel ladles; precast shapes and blocks;
slag arresting darts for converters; basic spray mass for tundish working lining; blast furnace trough castables
for main trough, metal, and rocking runners; and conventional, low cement, and ultra low cement castables.
An in-house R&D facility supports the division’s product development initiatives. This makes ORL the preferred
choice for quality products. The company also exports its products to Europe, the Middle East, and South East
Asia.
Products
• Isostatically pressed Continuous Casting Refractories
• Slide gate plates
• Nozzles and Well Blocks
• Tundish Nozzles
• Bottom Purging Refractories and Top Purging Lances
• Slag Arresting Darts
• Basic Spray Mass for Tundish working lining
• Castables
4. FINANCIAL HIGHLIGHT (PARENT BASIS) (A*- Actual, E* -Estimations & Rs. In Millions)
Balance Sheet as at March 31, 2014 -2017E
FY14A FY15A FY16E FY17E
SOURCES OF FUNDS
Shareholder's Funds
Share Capital 120.14 120.14 120.14 120.14
Reserves and Surplus 1256.47 1577.89 1893.47 2234.29
1. Sub Total - Net worth 1376.61 1698.03 2013.61 2354.43
Non Current Liabilities
Deferred Tax Liabilities 2.11 0.00 0.00 0.00
Other Long term Liabilities 8.85 9.33 9.70 9.99
Long term Provisions 17.47 22.29 27.86 33.99
2. Sub Total - Non Current Liabilities 28.43 31.62 37.57 43.99
Current Liabilities
Short term Borrowings 57.17 52.42 49.80 48.31
Trade Payables 508.59 514.51 524.80 540.54
Other Current Liabilities 24.48 32.11 41.10 50.55
Short Term Provisions 180.35 207.87 234.89 260.73
3. Sub Total - Current Liabilities 770.58 806.91 850.59 900.13
Total Liabilities (1+2+3) 2175.62 2536.56 2901.77 3298.55
APPLICATION OF FUNDS
Non-Current Assets
a) Fixed Assets 319.64 371.90 442.56 513.37
b) Non-current investments 0.06 0.06 0.06 0.06
c) Deferred tax Assets 0.00 7.95 8.51 8.85
d) Long Term loans and advances 15.62 17.53 19.28 20.83
e) Other non-current assets 5.03 5.14 5.29 5.51
1. Sub Total - Non Current Assets 340.35 402.58 475.70 548.61
Current Assets
Inventories 633.24 715.59 787.15 861.93
Trade receivables 993.96 1126.95 1252.75 1394.46
Cash and Bank Balances 179.88 261.32 352.78 455.09
Short-terms loans & advances 17.62 20.27 24.12 29.67
Other current assets 10.57 9.85 9.26 8.80
2. Sub Total - Current Assets 1835.27 2133.98 2426.06 2749.94
Total Assets (1+2) 2175.62 2536.56 2901.77 3298.55
5. Annual Profit & Loss Statement for the period of 2014 to 2017E
Value(Rs.in.mn) FY14A FY15A FY16E FY17E
Description 12m 12m 12m 12m
Net Sales 4035.04 4513.65 5010.15 5486.12
Other Income 41.02 53.18 55.84 59.19
Total Income 4076.06 4566.83 5065.99 5545.31
Expenditure -3243.20 -3715.19 -4120.85 -4509.04
Operating Profit 832.86 851.64 945.14 1036.27
Interest -0.75 -0.43 -0.37 -0.35
Gross profit 832.11 851.21 944.78 1035.92
Depreciation -36.26 -54.93 -64.82 -74.54
Profit Before Tax 795.85 796.28 879.96 961.38
Tax -267.38 -267.88 -294.79 -321.10
Net Profit 528.47 528.40 585.17 640.28
Equity capital 120.14 120.14 120.14 120.14
Reserves 1256.47 1577.89 1893.47 2234.29
Face value 1.00 1.00 1.00 1.00
EPS 4.40 4.40 4.87 5.33
Quarterly Profit & Loss Statement for the period of 30th Sep, 2014 to 30th Jun, 2015E
Value(Rs.in.mn) 30-Sep-14 31-Dec-14 31-Mar-15 30-Jun-15E
Description 3m 3m 3m 3m
Net sales 1177.63 1169.32 1083.92 1132.70
Other income 24.74 9.67 6.80 8.98
Total Income 1202.37 1178.99 1090.72 1141.67
Expenditure -981.34 -966.36 -883.96 -932.21
Operating profit 221.03 212.63 206.76 209.46
Interest -0.11 -0.03 -0.27 -0.09
Gross profit 220.92 212.60 206.49 209.37
Depreciation -11.91 -12.25 -13.07 -14.64
Profit Before Tax 209.01 200.35 193.42 194.73
Tax -70.33 -68.77 -64.41 -65.62
Net Profit 138.68 131.58 129.01 129.11
Equity capital 120.14 120.14 120.14 120.14
Face value 1.00 1.00 1.00 1.00
EPS 1.15 1.10 1.07 1.07
7. OUTLOOK AND CONCLUSION
At the current market price of Rs. 89.10, the stock P/E ratio is at 18.29 x FY16E and 16.72 x FY17E
respectively.
Earnings per share (EPS) of the company for the earnings for FY16E and FY17E are seen at Rs. 4.87 and Rs.
5.33 respectively.
Net Sales and PAT of the company are expected to grow at a CAGR of 11% and 12% over 2014 to 2017E
respectively.
On the basis of EV/EBITDA, the stock trades at 11.01 x for FY16E and 9.94 x for FY17E.
Price to Book Value of the stock is expected to be at 5.32 x and 4.55 x for FY16E and FY17E respectively.
We recommend ‘BUY’ in this particular scrip with a target price of Rs. 102.00 for Medium to Long term
investment.
INDUSTRY OVERVIEW
The Indian Engineering sector has witnessed a remarkable growth over the last few years driven by increased
investments in infrastructure and industrial production. The engineering sector, being closely associated with
the manufacturing and infrastructure sectors of the economy, is of strategic importance to India’s economy.
Growth in the sector is driven by various sub-sectors such as infrastructure, power, steel, automotives, oil and
gas, consumer durables etc.
India on its quest to become a global superpower has made significant strides towards the development of its
engineering sector. The Indian government has appointed the Engineering Export Promotion Council (EEPC) to
8. be the apex body in charge of promotion of engineering goods, products and services from India. India exports
transport equipment, capital goods, other machinery/equipment and light engineering products such as castings,
forgings and fasteners to various countries of the world.
Coupled with favourable regulatory policies and growth in the manufacturing sector, many foreign players have
started to invest in the country. India recently became a permanent member of the Washington Accord (WA) on
June 13, 2014. The country now joins an exclusive group of 17 countries who are permanent signatories of the
WA, an elite international agreement on engineering studies and mobility of engineers.
Driven by strong demand for engineering goods, exports from India registered a double digit growth at 10.22 per
cent to touch US$ 26.4 billion in June 2014 from US$ 24.02 billion in the corresponding month last year. This
growth can be credited to the robust expansion in shipments of aircraft, spacecraft parts and automobiles. The
second best performing sector was non-ferrous metals and metal products.
Outlook
The engineering sector is a growing market. Current spending on engineering services is projected to increase to
US$ 1.1 trillion by 2020. With development in associated sectors such as automotive, industrial goods and
infrastructure, coupled with a well-developed technical human resources pool, engineering exports are expected
to touch US$ 120 billion by 2015.
Also, the Union Budget 2014-15 has allocated funds for several infrastructure projects which are further
expected to provide a boost to the engineering sector. The industry can also look forward to deriving revenues
from newer services and from newer geographies with Big Data, Cloud, M2M and Internet of Things becoming a
reality.
Disclaimer:
This document is prepared by our research analysts and it does not constitute an offer or solicitation for the
purchase or sale of any financial instrument or as an official confirmation of any transaction. The information
contained herein is from publicly available data or other sources believed to be reliable but we do not represent that
it is accurate or complete and it should not be relied on as such. Firstcall Research or any of its affiliates shall not be
in any way responsible for any loss or damage that may arise to any person from any inadvertent error in the
information contained in this report. Firstcall Research and/ or its affiliates and/or employees will not be liable for
the recipients’ investment decision based on this document.
9. Firstcall India Equity Research: Email – info@firstobjectindia.com
C.V.S.L.Kameswari Pharma & Diversified
U. Janaki Rao Capital Goods
B. Anil Kumar Auto, IT & FMCG
M. Vinayak Rao Diversified
G. Amarender Diversified
Firstcall Research Provides
Industry Research on all the Sectors and Equity Research on Major Companies
forming part of Listed and Unlisted Segments
For Further Details Contact:
Tel.: 022-2527 2510/2527 6077 / 25276089 Telefax: 022-25276089
040-20000235 /20000233
E-mail: info@firstobjectindia.com
www.firstcallresearch.com