Download as PDF, PPTX
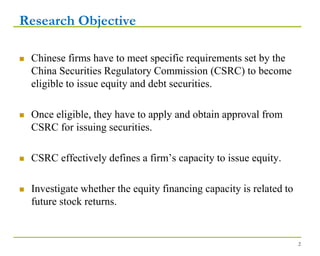
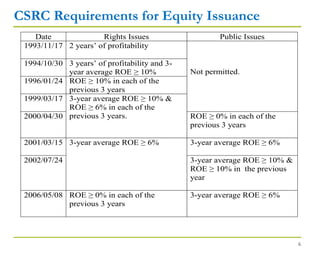
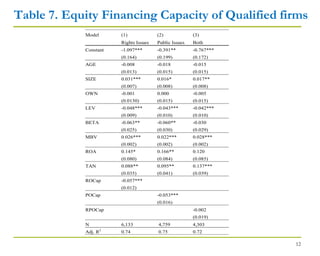
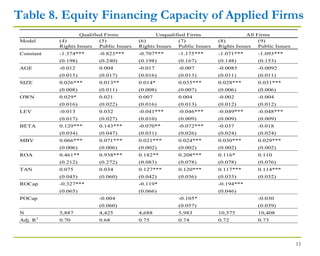
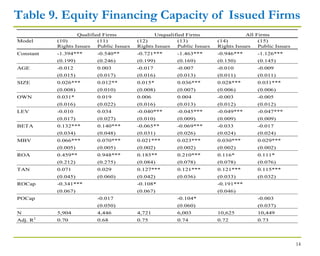

This document summarizes research presented at the Global Finance Conference in Chicago in 2012 on the relationship between equity financing capacity and future stock returns in China. The researchers investigated how the ability of Chinese firms to issue equity, as determined by regulations set by the China Securities Regulatory Commission, impacted subsequent stock performance. They found that for firms qualified to issue shares, having the capacity for rights issues or public offerings was strongly negatively correlated with future returns. This relationship held for qualified firms that both applied to issue shares and for those that successfully issued equity. The results support theories that predict investors react negatively to equity issuance due to agency problems, signaling effects, or earnings management.