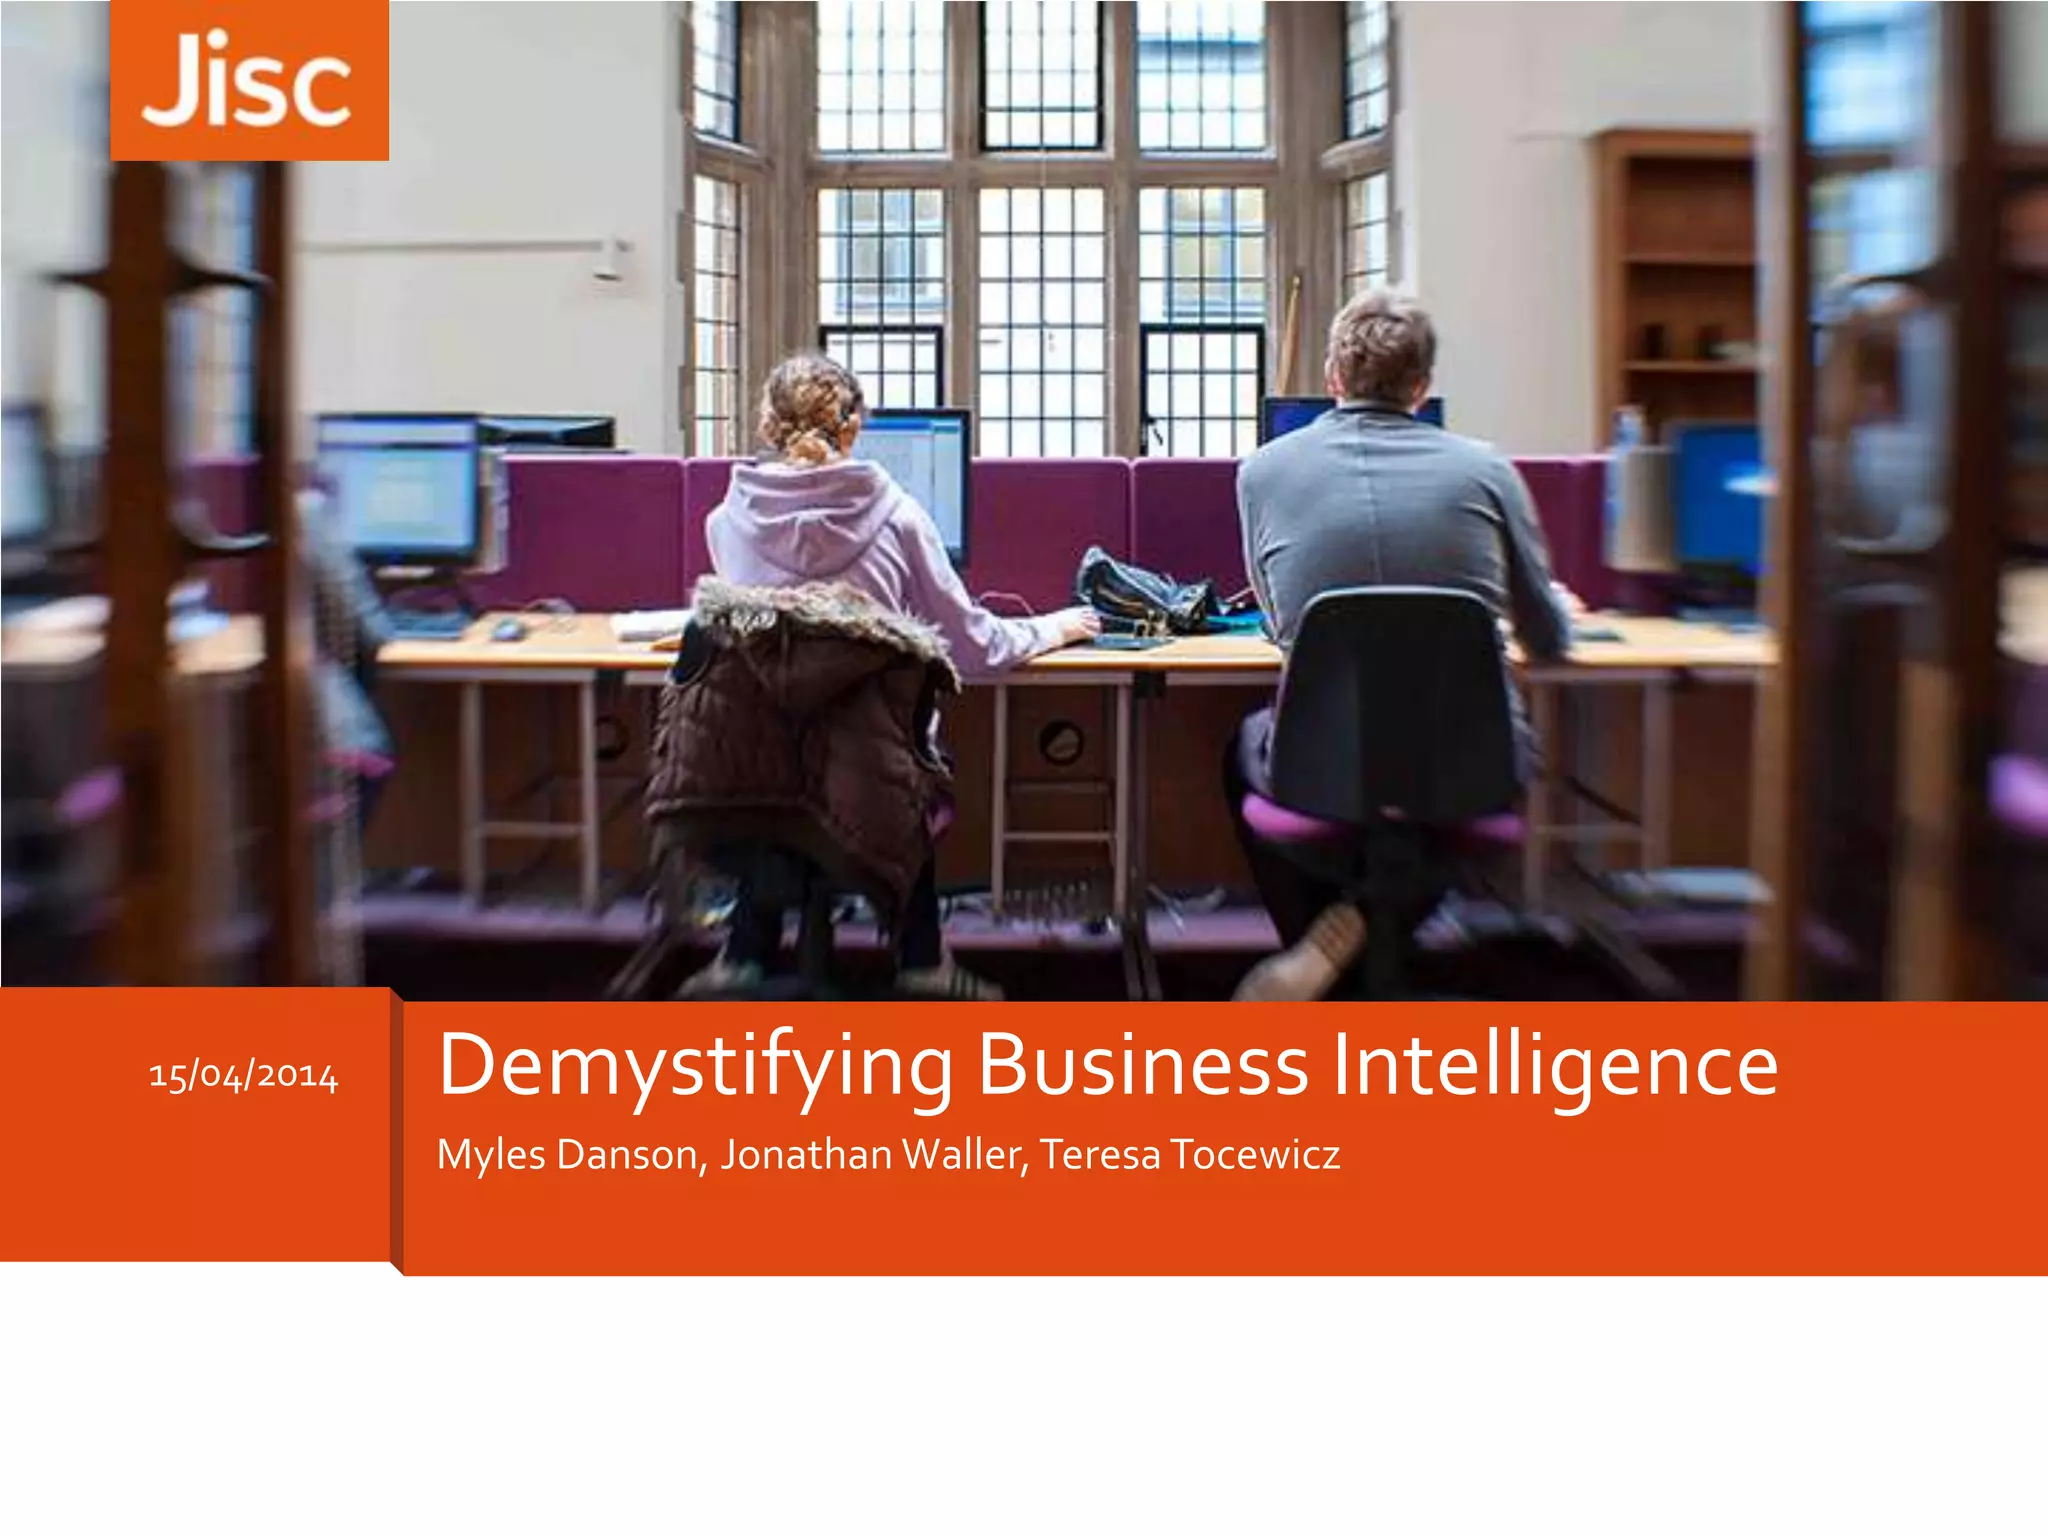
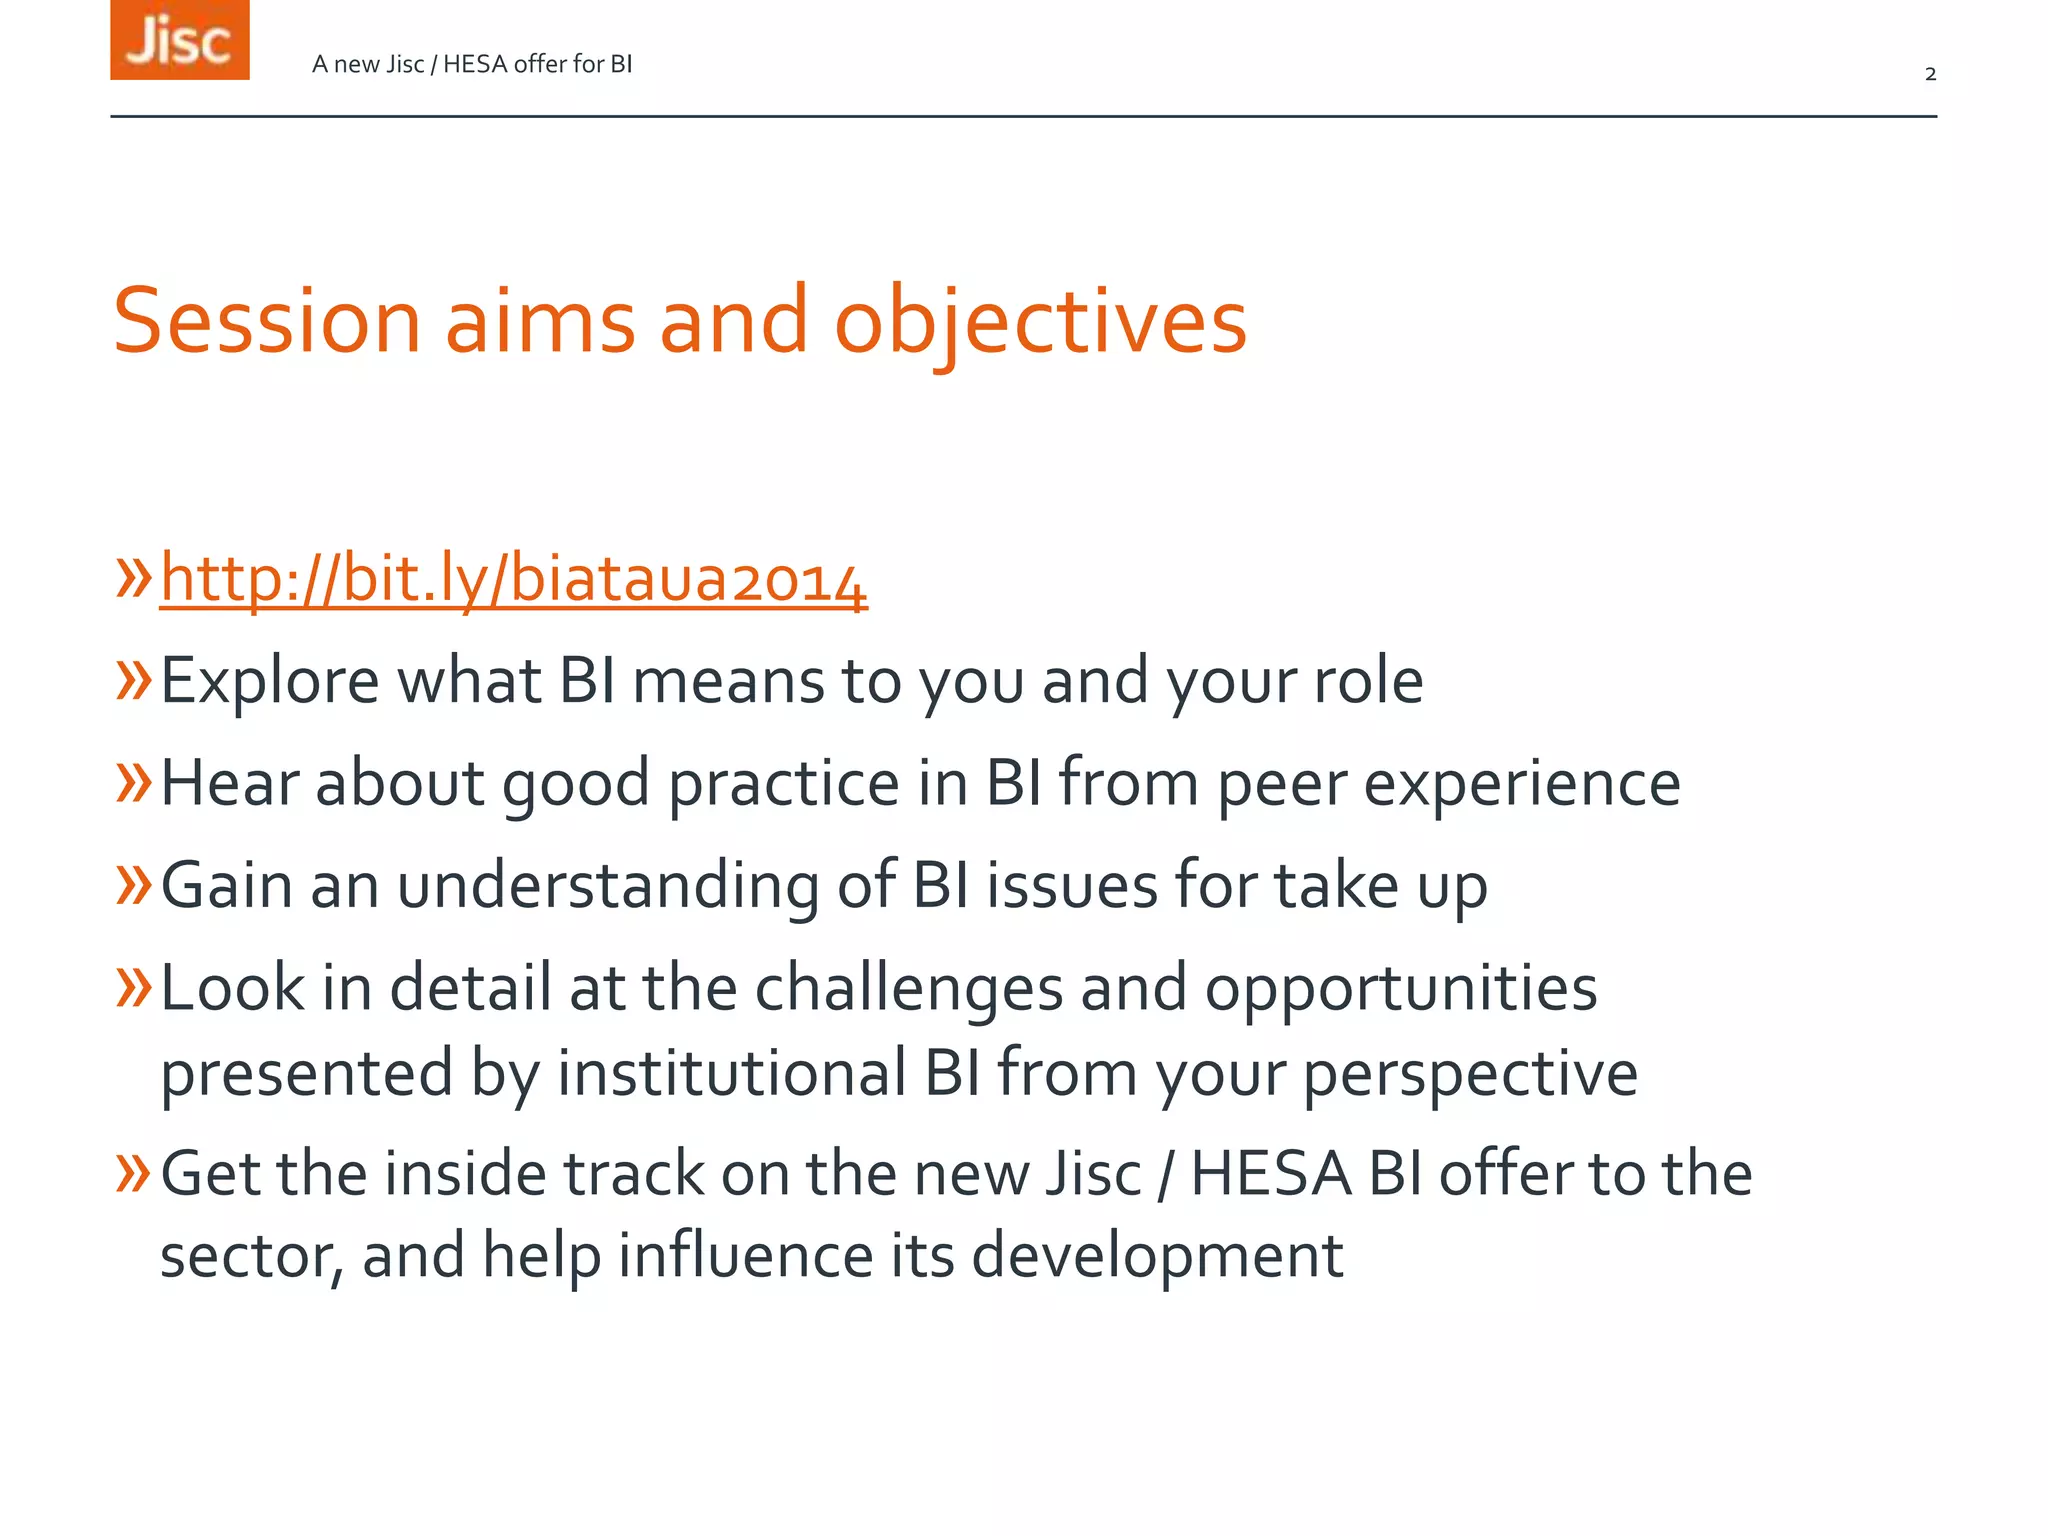
Presenting BI to the HE Community, identifying resources, practice, ideals, barriers and solutions and introducing a new Jisc / HESA National; BI Service
The document analyzes the current process for managing architectural decisions (ADs) at an industry partner. It identifies areas for improvement, such as ensuring ADs are documented in a central location using an enforced model and are easily retrievable. It also notes ADs should be easy to communicate and learn from through active/passive feedback. The authors propose an enhanced, process-oriented approach to AD management that formalizes the informal learning currently taking place.
Collab Comm+For+Soc+Chg+Intro.Rev+July+2008UC Santa Cruz
This document introduces collaborative processes that are used for social change and engagement of multiple stakeholders. It discusses several examples of collaborative processes like Appreciative Inquiry, World Cafe, Future Search and others. It outlines typical benefits like building understanding, relationships and generating creative solutions. It also discusses when these processes are appropriate to use and what determines their success, like participation and agreement on the process. It concludes with elements of effective meeting design like clarity of purpose and intended outcomes.
2014.01.30 Innovation overview by Glenn WintrichNUI Galway
Glenn Wintrich, Innovation Leader at Dell, presented this seminar entitled Innovation Overview on 30th January 2014 at the Whitaker Institute, NUI Galway.
Determining the value of information literacy for employersInformAll
The document summarizes the DeVIL project, which aims to demonstrate the value of information literacy (IL) to employers. The project developed a prototype tool mapping how investments in IL contribute to business value factors like efficiency, profitability, and compliance. The tool is based on case studies of organizations that invested in areas like staff training, information systems, and work practices. It allows users to explore how IL-related resources produce value. Further work is needed to refine the tool and gather more data from diverse organizations to comprehensively capture the potential value of IL.
A BA's Journey on the Organisations Transformation to SustainabilityAustraliaChapterIIBA
The document summarizes an IIBA presentation about a business analyst's journey in helping an organization transform to sustainability. It discusses the drivers of change toward sustainability, what constitutes a sustainable business, the analysis roadmap and techniques a BA can use. These include using the business model canvas to evaluate partnerships, activities, value propositions etc. and identifying elements of a business case like revenue drivers, cost management opportunities and risks of not transforming. The presentation provides an overview of how BAs can support organizations in evaluating and implementing sustainable business strategies and operations.
Presentation Bodet-Osys 2013 md eng linkedin indaBodet Osys
The document summarizes information about the company Bodet and its software division Bodet Software. It details the company's history starting in 1868 with tower clocks and expanding into industrial clock systems, sport scoreboards, and software solutions. Bodet Software's MES software called OSYS is highlighted as the French leader in MES and has over 1,500 customers across various industrial sectors. Key features of the OSYS software suite and the benefits of its modular MES solutions are summarized.
The document discusses the University of Kent's process mapping project which aims to create clear and consistent processes across the university's administration using Triaster process mapping software. It provides an overview of the university, introduces the process mapping project and its goals, and discusses challenges faced and lessons learned. Key points include engaging stakeholders, establishing clear governance, and focusing on facilitation and communication to boost staff engagement with process mapping.
volg nu de 2 daagse workshop van de brown paper methode te neijerode en optimaliseer uw organisatie met de leukste manier van veranderen met de hoogdte resultaten!
The document discusses the Brown Paper Process, which involves visually mapping out a business process using a large sheet of paper. Key points:
- A Brown Paper maps an entire process from start to finish, showing steps, decisions, documentation, and interfaces to identify strengths, weaknesses, and opportunities for improvement.
- Brown Papers are used to build consensus around needed changes by describing the current process and capturing its complexity.
- The process involves constructing the paper with relevant stakeholders, then presenting it along with findings and a list of identified opportunities.
- Helpful tips are provided for effectively building, presenting, and critiquing the Brown Paper to analyze the process and achieve process improvement goals.
This document discusses quality improvement through process mapping and analysis. It explains that quality is judged based on process output, not individual worker performance. To improve quality, the process itself must be improved. Simply defining a process is not enough - management must make changes and use data to demonstrate improvements. The document then describes process mapping techniques like SIPOC, flowcharts, identifying value-added vs. non-value added steps, measuring cycle time, and bottlenecks.
Process Mapping and Process Improvement for the Small Business OwnerMichiko Diby
This is a low-key, simple presentation for the small business owner.
Use this method to get a visual on bottlenecks, and create new processes that make work productive and fun.
The document discusses process mapping and how it can be used to analyze and improve processes within an organization. Process mapping involves visually displaying the steps in a process, including inputs, outputs, responsibilities and issues. This helps identify non-value added activities, bottlenecks and other problems. An effective process map requires identifying the scope, capturing details in sessions with stakeholders, and analyzing metrics to find areas for quick wins and process improvements.
Kanban method in four easy steps. Enjoy kanban.
Kanban in 4 easy steps is one of the most popular Kanban presentations. Learn how to successfully implement Kanban in your business process or life. Get to know basic Kanban principles and to see how easily you can improve your productivity using Kanban boards.
Recorded webinar: http://slidesha.re/LRBvC4
Subscribe: http://www.ksmartin.com/subscribe
To purchase the book: http://bit.ly/MBPMbk
Metrics-Based Process Mapping is a highly effective tool for improving office, service, and knowledge work processes.
Metrics-Based Process Mapping: Part 1 of 3TKMG, Inc.
Recorded webinar: http://slidesha.re/1eYtbZM
Part 2 - http://slidesha.re/17pgwcS
Part 3 - http://slidesha.re/139L8Sb (Excel tool product demo)
Subscribe: http://www.ksmartin.com/subscribe
To purchase the book: http://bit.ly/MBPMbk
Metrics-Based Process Mapping (MBPM) is a methodology that was developed to support the adoption of lean practices in office, service, and knowledge work environments.
Designed and developed by Karen Martin & Mike Osterling, this technique integrates the functional orientation of conventional swim-lane process maps with the time and quality metrics used in value stream mapping.
Learn how to create a metrics-based process map to identify and eliminate waste in an office/service process. Part 1 of 3.
Metrics-Based Process Mapping: Part 2 of 3TKMG, Inc.
Recorded webinar: http://slidesha.re/18boq16
Part 1 - http://slidesha.re/15qe1qW
Part 3 - http://slidesha.re/139L8Sb (Excel tool product demo)
Subscribe: http://www.ksmartin.com/subscribe
To purchase the book: http://bit.ly/MBPMbk
Metrics-Based Process Mapping (MBPM) is a methodology that was developed to support the adoption of lean practices in office, service, and knowledge work environments.
Designed and developed by Karen Martin & Mike Osterling, this technique integrates the functional orientation of conventional swim-lane process maps with the time and quality metrics used in value stream mapping.
The document discusses RACI (Responsible, Accountable, Consulted, Informed) matrices, which are used to define roles and responsibilities in processes. It explains the meanings of each RACI designation (Responsible, Accountable, Consulted, Informed). Some benefits of RACI matrices include removing ambiguities, defining roles, reducing duplication, and improving communication. Tips are provided such as considering future roles, assigning accountability and responsibility to lower ranks, and only having one accountable person per activity. Potential traps to avoid are also mentioned. An example RACI chart is included.
Kanban is the simplest approach which is currently used in software development. Since Kanban prescribes close to nothing there are often a lot of basic questions about the method.
The presentation depicts what Kanban is generally using Scrum as a reference point. Then it presents a series of situations to answer basic questions about working with Kanban
The document discusses process mapping techniques to analyze a company's current ("As-Is") processes and design improved future ("To-Be") processes. It covers identifying process steps, mapping workflows, analyzing inefficiencies, defining metrics, and implementing improvements through a Plan-Do-Study-Act cycle. The goal is to understand processes, find opportunities for streamlining, and establish a shared understanding of work across departments.
This presentation gives simple but effective techniques for mapping a business process. Process Mapping is a strong initial step in continuous improvement of any business process.
Information Strategies for Higher Education and the Jisc / HESA Business Inte...mylesdanson
A look at the Jisc / HESA National Business Intelligence Service for UK Higher / Further Education and how Information Strategy development and implementation overlaps
Jisc and HESA have partnered to provide business intelligence (BI) services to the higher education sector in the UK. Their BI journey began in 2010 with road testing an initial information kit. The presentation outlines a new multi-phase joint Jisc/HESA BI service offering concise and up-to-date analyses, visualizations, and dashboards based on existing HESA data. Future phases aim to explore additional non-HESA data sources and enable peer benchmarking between institutions. The goal is to promote sector maturity in BI and bring its benefits to more staff through training and a "sandpit" environment for experimentation.
Adding value through BI: a Jisc perspectiveJISC infoNet
Business intelligence (BI) refers to technologies used to analyze business data and make more informed decisions. Jisc aims to promote BI adoption and capabilities in UK higher education through several initiatives. Its BI service will provide analyses, visualizations, and dashboards based on HESA data, allow custom reporting, and explore integrating additional non-HESA datasets. The Library Analytics Project currently offers a beta shared analytics service using student data from various sources to identify at-risk students and enable benchmarking. Overall, Jisc seeks to improve decision-making through BI and actionable insights for students and stakeholders.
Jisc business intelligence, analytics and relationship management collaborati...mylesdanson
This document summarizes Jisc's collaborative opportunities related to business intelligence, analytics, and relationship management. It outlines Jisc's work in these areas since 2010, including developing various resources and road testing them. The document then discusses the benefits organizations can see from engaging in analytics and relationship management. Finally, it proposes collaboration opportunities for co-designing and delivering interventions to raise members' capacity in these areas, and provides references for webinars, resources, and contact information for further discussion.
Blooming analytics! The germination of a new Jisc/HESA service for data-drive...Jisc
Facilitators:
Myles Danson, product owner – business intelligence, Jisc
Adam Green, senior data and visualisation officer, Jisc
Victoria Atherstone, head of sales and marketing, HESA
Who remembers planting the very first seed in the nurturing eco-system of Jisc Analytics Labs? Four years ago, Jisc, HESA and universities nationwide joined forces to develop interactive, data-derived visualisation dashboards to offer insights to the most prevalent and topical issues facing HEIs through shared intelligence and data expertise.
The seedlings have been cross-pollinated by other additional activity and are now maturing into an array of powerful analytical dashboard suites to help you troubleshoot your most pressing institutional demands.
The document discusses developing a strategic intelligence framework and roadmap. It proposes a 5-step approach to create a strategic business intelligence plan, including conducting an inventory of current solutions, defining value, creating a deployment map, establishing measurement criteria, and setting enhancement targets. The goal is to develop a cohesive SBI strategy in phases, first building a solid foundation of governance, education, and communication before incrementally building business capabilities on top of that foundation.
6 STEPS TO CREATE A SUCCESSFUL BUSINESS INTELLIGENCE STRATEGYGeorge Beaton
The document outlines a 6-step process for creating a successful business intelligence (BI) strategy:
1. Start with a mandate from senior leadership to provide authority and resources.
2. Understand the existing ("as-is") BI capabilities by interviewing those involved in reporting and documenting current processes, technologies, data sources, and users.
3. Understand the business's goals for BI to define the desired future state ("to-be") and ensure the strategy is aligned with overall business objectives.
4. Prepare for change by communicating the need for the BI strategy and gaining stakeholder buy-in.
5. Evaluate options for technologies, tools, and solutions to meet the defined goals.
6
This document summarizes the changes in the scope of business intelligence (BI) over recent years. It discusses how BI has evolved from being IT-managed standard reporting to a more self-service, visual, and interactive environment. Key changes highlighted include BI tools now being used and managed by business users, greater flexibility for users to explore and create custom reports, advanced visualizations and interactive dashboards, and the inclusion of more advanced analytics beyond standard SQL. The blurring of lines between reporting and analytics tools and between IT and business user roles is seen as an overall positive development that enables more flexibility, discovery, and insight.
Apart from timely availability of data and insightful business knowledge, this presentation will find the list of benefits that are gained by investing in business intelligence services.
Projects are dynamic. Staying ahead of the curve means having real-time access to your project data and it’s leading indicators for actionable intelligence. A real-time, flexible platform Tivitie Insights service enables organizations to visualize critical Microsoft Project Online data in real-time, spot trends as they occur and produce actionable facts for better decision making in a fraction of the time.
Presentation I put together while at Business Objects where I spearheaded the development of the Business Intelligence Competency Center practice and service offering.
The Business Intelligence Competency Center is a shared service offering that your organization can and should be leveraging for your BI needs. This deck, produced when I was running one of the largest consulting practices at Business Objects, dives into the concepts and detail surrounding the planning, development and roll-out of a BICC for a Fortune 2000 organization.
SharePoint Best Practices Conference 2010 SummaryVeronique Palmer
The document summarizes key points from sessions attended at the SharePoint Best Practices Conference 2010 and SharePoint Saturday Baltimore. Recurring themes included the importance of governance, project management, requirements definition, executive buy-in, training, communication, and measuring ROI. Specific sessions provided best practices for post-deployment stability and support, understanding what SharePoint is and isn't suitable for, requirements gathering, governance, team management, and measuring non-technical success factors.
Do You Have Actionable BI Dashboards or Artsy BI Charts?Datavail
In this session, we’ll discuss how to best arm executives with actionable insights, the best practices for choosing the right visualization, and how to best extract the data story the executives are looking for.
SharePoint Establishing the Business Case - SP Sat KC Oct 1 2016Matthew W. Bowers
The document discusses building a business case for SharePoint. It provides an overview of key components of a business case including business drivers, problems, benefits, and costs. It emphasizes starting with measurable business pains and KPIs. The document also presents examples of how SharePoint can help with initiatives like HR, communications, and scenarios like intranets. It covers considerations for moving to SharePoint Online like total cost of ownership comparisons and key metrics for stakeholders.
Idea Swap: Helping Chapters Embrace ChangeBillhighway
We need chapter leaders to make changes. It could be huge like shifting structures, medium like embracing new volunteer models, support services, affiliate agreements, or easy like changing your schedule. Resistance to change is natural. Anytime you introduce a new process or technology, you have to think about change management from the very start. Unfortunately, we underestimate how our leader training can support us in leading that change. This idea swap will explore how we can use our current and future training opportunities to help chapters embrace change.
Hosted by Billhighway & Mariner Management.
The document outlines the charter for a Special Interest Group (SIG) on service innovation. The SIG aims to define a framework called "Service 2.0" that recreates service innovation. It also seeks to grow the culture and network around service innovation through activities like conferences, white papers, and developing models for accelerators/incubators. The SIG will focus on industries like IT, education, government, and healthcare and deliver resources like an inventory of existing models and a conceptual framework for service innovation.
This document discusses key factors for successful business intelligence (BI) solutions. It outlines that smart companies use BI to gain insights and competitive advantages. BI solutions transform raw data into valuable information and knowledge through extraction, integration, analysis and feedback loops. The document then discusses various aspects of establishing successful BI solutions, including having executive sponsorship, aligning business and IT, prioritizing projects, and building an organizational culture that values data-driven decision making.
The document provides information about the speaker's background and experience as a Solution Architect and SharePoint specialist with 19 years of experience. It also summarizes their current role as Director of Marketing Operations for Skechers USA, a global footwear manufacturer. Additional details provided include an overview of Skechers' business operations and IT environment, and how the speaker has helped implement SharePoint and business intelligence solutions to automate processes and provide analytics.
Similar to Business Intelligence in Higher Education for AUA Conference 2014 (20)
Jisc HESA and Heidi Lab at Tableau users conference Nov 15mylesdanson
50 minute session for Tableau users in Higher Ed in the UK outlining the collaborative work between Jisc and HESA and focusing on the opportunity to join an innovative national Agile Scrum analysis effort to produce Tableau dashboards
Jisc and HESA presentation on a national business intelligence service and research and development project using an agile data analysis model across UK University planning departments
This document provides an overview of two national data services in the UK: a business intelligence service and a learning analytics service. It discusses how the services will collect and analyze data from UK educational institutions to provide insights and recommendations. Key points include collecting student demographic and activity data, developing dashboards and tools for staff and students, addressing ethical and privacy issues, and partnering with universities and colleges in a phased rollout approach.
The document summarizes a conference session on a business intelligence project between HESA and Jisc. It provides an overview of Jisc's analytics activities and the goals of the HESA and Jisc BI Project, which included launching a website and data exploration tools. Attendees participated in an exercise to identify priority questions and data needs that could be addressed by the project, with their responses to be compiled on the project website. Next steps include regional workshops and using the feedback to inform future milestones and priorities for the project.
Student innovation teams transition start upmylesdanson
The document summarizes an upcoming start up meeting for service projects transitioning to Phase 1. The meeting will include an introduction, approach discussion, themes emerging from project plans, an action learning session on overcoming barriers and an expert class on social networking. It will also cover the student summer of innovation competition and how participants can get involved. The afternoon involves action learning sets and closing.
Digital Literacies for University Administrators 2013mylesdanson
Session at the AUA Development Conference helping delegates to;
understand the breadth of Jisc digital literacy work
explore digital literacies administrators need to be successful in their current roles and beyond
describe how AUA and Jisc support the development of these capabilities, and generate ideas on how they could better support them
identify priorities for action once back in the office
In order to
help achieve an excellent digital experience for all
The document discusses ways to add value when attending events by actively engaging on social media during the event. It provides tips such as standing up if you attend or tweet about the event, capturing complex slides, adding side conversations, using humor, sitting near the front, linking to the agenda, selling your wares, blogging about meetings too, and announcing yourself at events. The benefits mentioned are raising your profile as an attendee, adding value to the event, promoting Jisc resources and related work, painting Jisc as an authoritative organization, and exposing different audiences to one another. The document encourages trying these engagement techniques and managing expectations, as it can be hard but gets easier with practice.
Panel Session at Learning Analytics and Knowledge Conference 2013mylesdanson
This document summarizes recent trends in learning analytics (LA) and opportunities for the future. It discusses how in the early years LA lacked evidence for business cases, clear terminology and roles. However, it is now an opportunity for early adopters through collaboration and problem solving. Going forward, the challenges are coordinating an innovation cycle and embedding LA. Success will depend on clearly identifying benefits, co-designing with stakeholders, developing business cases, and addressing readiness at both the organizational and individual level while continuing grassroots innovation.
The document discusses relationship management in higher education and further education. It summarizes Jisc's investment in supporting relationship management through the development of resources like an information kit and good practice handbook. Relationship management can help institutions identify value by professionalizing management of important relationships, improving cost savings and efficiency, and enhancing the customer experience. The information kit provides guidance on implementing an effective relationship management strategy and continuum.
JISC Relationship Management in Higher Education Way Forward Meetingmylesdanson
Projects from 16 UK Universities and one FE college gather to discuss their experiences using Service Design to enhance Student Retention, Completion and Satisfaction, Alumni Relationships and broader customer relationship management
Benefits and Impact by Andy Stewart et almylesdanson
This document discusses the benefits of measuring key performance indicators and metrics. It notes that measurement allows organizations to focus attention, set goals, improve execution, and enhance decision-making. Specific benefits mentioned include increased alignment, improved problem-solving, providing early warnings, and motivating employees. The document also provides a three-step process for projects to establish a baseline, provide evidence of actual changes, and demonstrate impact. It emphasizes quantifying benefits where possible and highlighting how projects' actual changes led to their stated impacts.
What Skills do we need for the digital age? The future of the digital adminis...mylesdanson
The document discusses a workshop on digital literacy skills needed for the digital age. It provides an overview of JISC's Developing Digital Literacies programme, including emerging findings from baseline studies of various projects. Baseline studies found that while support for digital literacy exists, it is often varied and dispersed. There is also a range of expertise and attitudes toward digital literacy among staff and students. The document discusses recommendations from associations to better develop digital literacy at all levels of organizations. It aims to identify how digital literacy can be supported in a digital university environment.
How to Manage Your Lost Opportunities in Odoo 17 CRMCeline George
Odoo 17 CRM allows us to track why we lose sales opportunities with "Lost Reasons." This helps analyze our sales process and identify areas for improvement. Here's how to configure lost reasons in Odoo 17 CRM
LAND USE LAND COVER AND NDVI OF MIRZAPUR DISTRICT, UPRAHUL
This Dissertation explores the particular circumstances of Mirzapur, a region located in the
core of India. Mirzapur, with its varied terrains and abundant biodiversity, offers an optimal
environment for investigating the changes in vegetation cover dynamics. Our study utilizes
advanced technologies such as GIS (Geographic Information Systems) and Remote sensing to
analyze the transformations that have taken place over the course of a decade.
The complex relationship between human activities and the environment has been the focus
of extensive research and worry. As the global community grapples with swift urbanization,
population expansion, and economic progress, the effects on natural ecosystems are becoming
more evident. A crucial element of this impact is the alteration of vegetation cover, which plays a
significant role in maintaining the ecological equilibrium of our planet.Land serves as the foundation for all human activities and provides the necessary materials for
these activities. As the most crucial natural resource, its utilization by humans results in different
'Land uses,' which are determined by both human activities and the physical characteristics of the
land.
The utilization of land is impacted by human needs and environmental factors. In countries
like India, rapid population growth and the emphasis on extensive resource exploitation can lead
to significant land degradation, adversely affecting the region's land cover.
Therefore, human intervention has significantly influenced land use patterns over many
centuries, evolving its structure over time and space. In the present era, these changes have
accelerated due to factors such as agriculture and urbanization. Information regarding land use and
cover is essential for various planning and management tasks related to the Earth's surface,
providing crucial environmental data for scientific, resource management, policy purposes, and
diverse human activities.
Accurate understanding of land use and cover is imperative for the development planning
of any area. Consequently, a wide range of professionals, including earth system scientists, land
and water managers, and urban planners, are interested in obtaining data on land use and cover
changes, conversion trends, and other related patterns. The spatial dimensions of land use and
cover support policymakers and scientists in making well-informed decisions, as alterations in
these patterns indicate shifts in economic and social conditions. Monitoring such changes with the
help of Advanced technologies like Remote Sensing and Geographic Information Systems is
crucial for coordinated efforts across different administrative levels. Advanced technologies like
Remote Sensing and Geographic Information Systems
9
Changes in vegetation cover refer to variations in the distribution, composition, and overall
structure of plant communities across different temporal and spatial scales. These changes can
occur natural.
हिंदी वर्णमाला पीपीटी, hindi alphabet PPT presentation, hindi varnamala PPT, Hindi Varnamala pdf, हिंदी स्वर, हिंदी व्यंजन, sikhiye hindi varnmala, dr. mulla adam ali, hindi language and literature, hindi alphabet with drawing, hindi alphabet pdf, hindi varnamala for childrens, hindi language, hindi varnamala practice for kids, https://www.drmullaadamali.com
বাংলাদেশের অর্থনৈতিক সমীক্ষা ২০২৪ [Bangladesh Economic Review 2024 Bangla.pdf] কম্পিউটার , ট্যাব ও স্মার্ট ফোন ভার্সন সহ সম্পূর্ণ বাংলা ই-বুক বা pdf বই " সুচিপত্র ...বুকমার্ক মেনু 🔖 ও হাইপার লিংক মেনু 📝👆 যুক্ত ..
আমাদের সবার জন্য খুব খুব গুরুত্বপূর্ণ একটি বই ..বিসিএস, ব্যাংক, ইউনিভার্সিটি ভর্তি ও যে কোন প্রতিযোগিতা মূলক পরীক্ষার জন্য এর খুব ইম্পরট্যান্ট একটি বিষয় ...তাছাড়া বাংলাদেশের সাম্প্রতিক যে কোন ডাটা বা তথ্য এই বইতে পাবেন ...
তাই একজন নাগরিক হিসাবে এই তথ্য গুলো আপনার জানা প্রয়োজন ...।
বিসিএস ও ব্যাংক এর লিখিত পরীক্ষা ...+এছাড়া মাধ্যমিক ও উচ্চমাধ্যমিকের স্টুডেন্টদের জন্য অনেক কাজে আসবে ...
This presentation includes basic of PCOS their pathology and treatment and also Ayurveda correlation of PCOS and Ayurvedic line of treatment mentioned in classics.
The simplified electron and muon model, Oscillating Spacetime: The Foundation...RitikBhardwaj56
Discover the Simplified Electron and Muon Model: A New Wave-Based Approach to Understanding Particles delves into a groundbreaking theory that presents electrons and muons as rotating soliton waves within oscillating spacetime. Geared towards students, researchers, and science buffs, this book breaks down complex ideas into simple explanations. It covers topics such as electron waves, temporal dynamics, and the implications of this model on particle physics. With clear illustrations and easy-to-follow explanations, readers will gain a new outlook on the universe's fundamental nature.
This presentation was provided by Steph Pollock of The American Psychological Association’s Journals Program, and Damita Snow, of The American Society of Civil Engineers (ASCE), for the initial session of NISO's 2024 Training Series "DEIA in the Scholarly Landscape." Session One: 'Setting Expectations: a DEIA Primer,' was held June 6, 2024.
How to Fix the Import Error in the Odoo 17Celine George
An import error occurs when a program fails to import a module or library, disrupting its execution. In languages like Python, this issue arises when the specified module cannot be found or accessed, hindering the program's functionality. Resolving import errors is crucial for maintaining smooth software operation and uninterrupted development processes.
A review of the growth of the Israel Genealogy Research Association Database Collection for the last 12 months. Our collection is now passed the 3 million mark and still growing. See which archives have contributed the most. See the different types of records we have, and which years have had records added. You can also see what we have for the future.
Business Intelligence in Higher Education for AUA Conference 2014
1. Myles Danson, Jonathan Waller,Teresa Tocewicz
15/04/2014 Demystifying Business Intelligence
2. Session aims and objectives
»http://bit.ly/biataua2014
»Explore what BI means to you and your role
»Hear about good practice in BI from peer experience
»Gain an understanding of BI issues for take up
»Look in detail at the challenges and opportunities
presented by institutional BI from your perspective
»Get the inside track on the new Jisc / HESA BI offer to the
sector, and help influence its development
A new Jisc / HESA offer for BI 2
3. Jisc BI Journey to Date
Engage
HESA, H
ESPA, UC
ISA, ARC,
AHUA, U
HR, Guild
HE, UUK
National
research
fed
InfoKitV1
Project
Phase to
road test
V1
Analytics
included
as series
of
reports
InfoKit
updated
Visualisa
tions
launche
d
Jisc/HE
SA BI
Service
Plans
2010 2010 2011/12 2012/13 2013 2014
A new Jisc / HESA offer for BI
4. 4A new Jisc / HESA offer for BI
Examples of attributes of a BI system
Accessible when needed
Concise, pictorial or graphical
Up to date, current
Known update times and intervals
Can select data for [any, or defined] time period
Good, reliable quality and integrity of data items
[All, major] internal information sources are included
Drill-down and roll-up capabilities (zoom in or zoom out;
allowing broader or narrower views, as the user requires)
Easy to understand
And many more….
5. What does BI mean to you?
»Design your own definition
»Share with your neighbour
»We’ll ask for suggestions
»5 minutes
A new Jisc / HESA offer for BI 5
6. What does BI mean internationally?
1. BI is an umbrella term that includes the applications, infrastructure and tools,
and best practices that enable access to and analysis of information to improve
and optimize decisions and performance.
2. BI is the use of computing technologies for the identification, discovery and
analysis of business data - like sales revenue, products, costs and incomes.
3. BI simplifies information discovery and analysis, making it possible for decision-
makers at all levels of an organization to more easily access, understand,
analyze, collaborate, and act on information, anytime and anywhere
4. BI is evidence-based decision-making and the processes that gather, present,
and use that evidence base
5. Computer-based techniques used in spotting, digging-out, and analyzing 'hard'
business data, such as sales revenue by products or departments or associated
costs and incomes
A new Jisc / HESA offer for BI 6
7. How to ‘Do’ BI in an HE environment
»Practical advice
› http://bit.ly/jisc_bi
»What are others doing in BI in HE
› http://bit.ly/liverpool_bi
A new Jisc / HESA offer for BI 7
8. What would successful BI look like?
»Draw a giant ‘H’ on your flip chart, like ours…
»Use the Post it notes to individually describe:
› How effective BI currently helps you in your role, or
› How you believe it could and should
»Stick your Post its to the left ‘’ of your ‘H’ (as many as
you can come up with)
»Feel free to discuss with others, but ultimately we are
looking for a range of views…
»10 minutes
A new Jisc / HESA offer for BI 8
9. What factors are stopping you?
»Use the Post it notes to individually describe:
› What organisational, or other, factors are
preventing your institutions from delivering the kind
of benefits previously surfaced?
»Stick your Post its to the right ‘’of your ‘H’ (as many as
you can come up with)
»Feel free to discuss with others, but ultimately we are
looking for a range of views…
»10 minutes
A new Jisc / HESA offer for BI 9
10. Making progress
»Use the Post it notes to individually describe:
› What needs to happen within your institution to
overcome the issues that are holding you back and
preventing you from achieving the successful vision
of BI you have articulated?
»Stick your Post its in the middle of your ‘H’ (as many as
you can come up with)
»Feel free to discuss with others, but ultimately we are
looking for a range of views…
»10 minutes
A new Jisc / HESA offer for BI 10
11. Prioritising
»Take a look at the central ideas section of your group’s
‘H’ and all the suggestions it contains
»Take 3 ‘sticky dots’ each and award them to the idea(s)
that you feel are the most likely to make a difference
»Allocate them how you wish:
› All 3 dots on the best idea
› 2 dots on one and 1 dot on another
› 1 dot each on three good ideas
»5 minutes
A new Jisc / HESA offer for BI 11
13. Next steps…
»We will capture the results of each group’s forms and
circulate electronically to each of you by the end of the
week
»We will also include a list of BI-related resources which
may be of use to you
»We will then use the results of this session, especially
the prioritised list of ideas to help inform the planning
and development of the new Jisc / HESA BI offer that
you are about to hear more about…
A new Jisc / HESA offer for BI 13
14. Jisc / HESA Project Objectives
»Promoting sector maturity and capability for BI
»Bring the benefits of BI to wider staff groups
Through;
› Building on HESA expertise and experience of Heidi
› New technical service provision with satellite services
› Providing a sand pit to experiment
› Exploring non-HESA data sets
› Investigating data upload for benchmarking
A new Jisc / HESA offer for BI 14
15. Jisc / HESA BI Service
A new Jisc / HESA offer for BI 15
16. Q & A
»Any questions / comments?
»Keep in touch; business cards and session write up
»Jisc-hesa- business-intel@jiscmail.ac.uk
A new Jisc / HESA offer for BI 16
Editor's Notes
Go to ‘View’ menu > ‘Header and Footer…’ to edit the footers on this slide (click ‘Apply’ to change only the currently selected slide, or ‘Apply to All’ to change the footers on all slides).To change the image on this slide:Click once on the image to select it, and then delete itDrag a replacement picture to the placeholder or click the icon in the centre of the placeholder to browse for & add another imageOnce you have added your replacement image, you may need to put it into the background so that it doesn’t cover other items on the slide. Do this by right-clicking on the new image and choosing ‘Arrange’ > ‘Send to Back’ from the contextual menu
Go to ‘View’ menu > ‘Header and Footer…’ to edit the footers on this slide (click ‘Apply’ to change only the currently selected slide, or ‘Apply to All’ to change the footers on all slides).
Service Level 1 This level caters for the low - middle BI maturity customers. It comprises the suite of Heidi data sets delivered through a commercial data explorer tool replacing appropriate current Heidi client with enhanced functionality. Projects will be commissioned to produce innovative visualisations based on HESA data sets along with supporting documentation to ensure onward use is sound. A selection process will be enacted to choose which visualisations migrate to service. It is envisaged that Level 1 will provide access to the most generically applicable visualisations and related BICC services. As customer maturity increases, Level 1 will offer a wider choice of additional visualisations to cater for specific missions / areas of interest as derived through the BICC along with the ability to for customers to create their own visualisations.Level 2 is very much an exploratory activity to determine what is possible in the following areas being high risk and potentially highly innovative. It is anticipated that Level 2 will add new visualisations based on the interpretation of non-HESA data sets. These may be mashed up with HESA data. Innovations in data visualisations will be explored through technical data mashup and visualisation projects providing complimentary supporting documentation to ensure onward use is sound. If demand for such visualisations is proven, the visualisations will become part of a Level 2 service. Customers may be required to pay additional fees for access to the additional aspects of the non HESA data catalogues. There will be a role for Jisc to negotiate with the data owners. It is envisaged that should this gain momentum it would pave the way to a national data catalogue for BI. Level 2 will be championed by HESPA in partnership with Jisc.Level 2 candidate data sets might include XXXX and cross sectors including FE and schoolsLevel 2 customers could include UUK, Jisc ,national abodies, BI, FE S and more….l Both Service Level 1 and Level 2 must cater for existing Heidi features such as API functionality for local data import.
Go to ‘View’ menu > ‘Header and Footer…’ to edit the footers on this slide (click ‘Apply’ to change only the currently selected slide, or ‘Apply to All’ to change the footers on all slides).