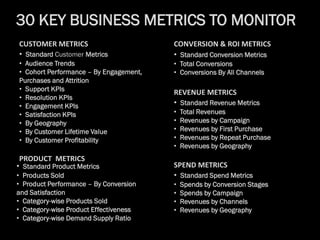
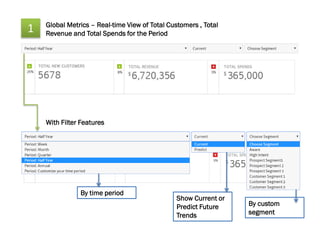
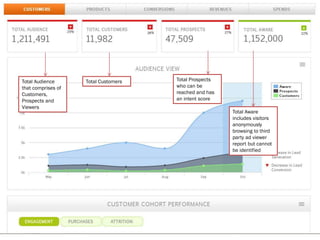
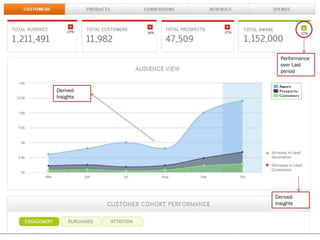
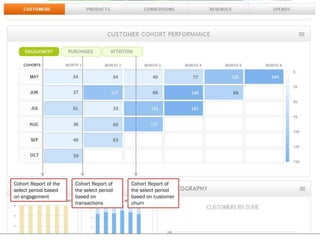
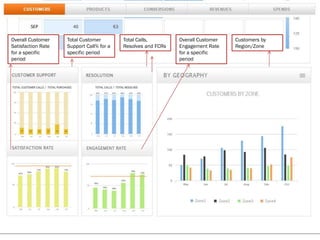
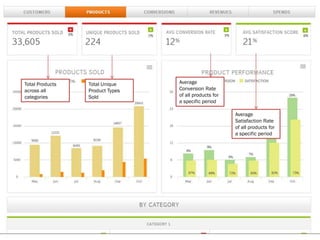
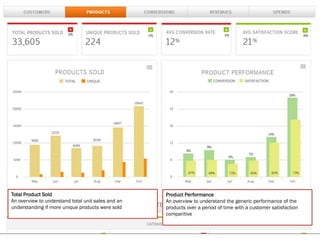
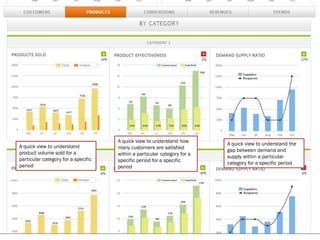
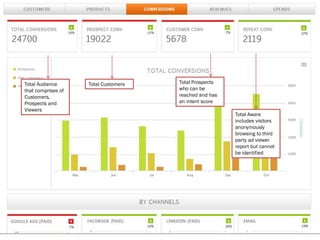
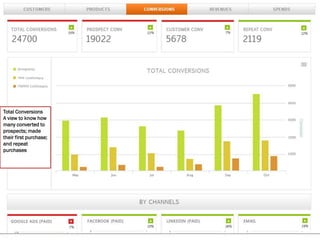
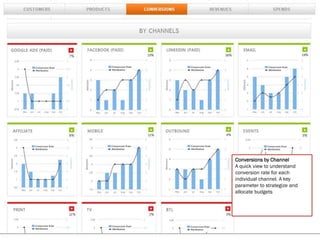
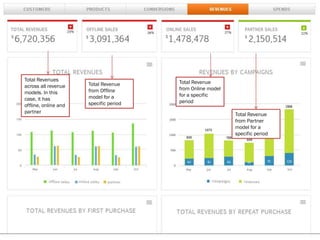
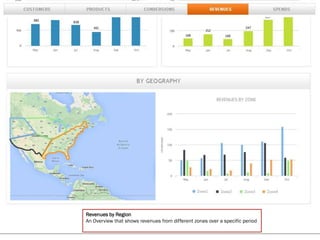
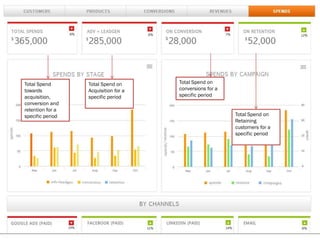
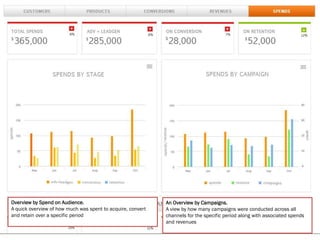
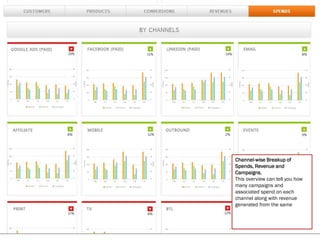
REAL-TIME BUSINESS
DASHBOARDS
• Standard Customer Metrics
• Audience Trends
• Cohort Performance – By Engagement,
Purchases and Attrition
• Support KPIs
• Resolution KPIs
• Engagement KPIs
• Satisfaction KPIs
• By Geography
• By Customer Lifetime Value
• By Customer Profitability
• Standard Product Metrics
• Products Sold
• Product Performance – By Conversion
and Satisfaction
• Category-wise Products Sold
• Category-wise Product Effectiveness
• Category-wise Demand Supply Ratio
• Standard Conversion Metrics
• Total Conversions
• Conversions By All Channels
• Standard Revenue Metrics
• Total Revenues
• Revenues by Campaign
• Revenues by First Purchase
• Revenues by Repeat Purchase
• Revenues by Geography
• Standard Spend Metrics
• Spends by Conversion Stages
• Spends by Campaign
• Revenues by Channels
• Revenues by Geography
30 KEY BUSINESS METRICS TO MONITOR
CUSTOMER METRICS
PRODUCT METRICS
CONVERSION & ROI METRICS
REVENUE METRICS
SPEND METRICS
Global Metrics – Real-time View of Total Customers , Total
Revenue and Total Spends for the Period1
With Filter Features
By time period
By custom
segment
Show Current or
Predict Future
Trends
Total Audience
that comprises of
Customers,
Prospects and
Viewers
Total Customers Total Prospects
who can be
reached and has
an intent score
Total Aware
includes visitors
anonymously
browsing to third
party ad viewer
report but cannot
be identified
Performance
over Last
period
Derived
Insights
Derived
Insights
Cohort Report of the
select period based
on engagement
Cohort Report of
the select period
based on
transactions
Cohort Report of
the select period
based on customer
churn
Overall Customer
Satisfaction Rate
for a specific
period
Total Customer
Support Call% for a
specific period
Total Calls,
Resolves and FCRs
Overall Customer
Engagement Rate
for a specific
period
Customers by
Region/Zone
Total Products
across all
categories
Total Unique
Product Types
Sold
Average
Conversion Rate
of all products for
a specific period
Average
Satisfaction Rate
of all products for
a specific period
Product Performance
An overview to understand the generic performance of the
products over a period of time with a customer satisfaction
comparitive
Total Product Sold
An overview to understand total unit sales and an
understanding if more unique products were sold
A quick view to understand
product volume sold for a
particular category for a specific
period
A quick view to understand how
many customers are satisfied
within a particular category for a
specific period for a specific
period
A quick view to understand the
gap between demand and
supply within a particular
category for a specific period
Total Audience
that comprises of
Customers,
Prospects and
Viewers
Total Customers Total Prospects
who can be
reached and has
an intent score
Total Aware
includes visitors
anonymously
browsing to third
party ad viewer
report but cannot
be identified
Total Conversions
A view to know how
many converted to
prospects; made
their first purchase;
and repeat
purchases
Conversions by Channel
A quick view to understand
conversion rate for each
individual channel. A key
parameter to strategize and
allocate budgets
Total Revenues
across all revenue
models. In this
case, it has
offline, online and
partner
Total Revenue
from Offline
model for a
specific period
Total Revenue
from Online model
for a specific
period
Total Revenue
from Partner
model for a
specific period
Revenues by Campaign
An overview to understand which of their campaigns are driving
more revenues
Total Revenues
An overview to understand which model is generating more
revenue. In this case, there is online, offline and partner
models
Revenue by Repeat Purchase
First Purchase accounts to customers who have already made
their first purchase (Loyal customers). An overview to
understand how much of revenue was generated through
repeat purchases
Revenue by First Purchase
First Purchase accounts to customers who made their first
purchase. An overview to understand how much of revenue
was generated through first purchases
Revenues by Region
An Overview that shows revenues from different zones over a specific period
Total Spend
towards
acquisition,
conversion and
retention for a
specific period
Total Spend on
Acquisition for a
specific period
Total Spend on
conversions for a
specific period
Total Spend on
Retaining
customers for a
specific period
An Overview by Campaigns.
A view by how many campaigns were conducted across all
channels for the specific period along with associated spends
and revenues
Overview by Spend on Audience.
A quick overview of how much was spent to acquire, convert
and retain over a specific period
Channel-wise Breakup of
Spends, Revenue and
Campaigns.
This overview can tell you how
many campaigns and
associated spend on each
channel along with revenue
generated from the same
All these dashboards are customizable from the Plumb5 Data Management App
1. To measure Marketing
ROI and customer
Profitability
2. We need inputs such as
spends, revenue and
parameters of time and
time-costs
3. Spend Inputs are
gathered at the first step
of each conversion cycle
4. Revenue Inputs are
gathered at the last step
of each conversion cycle
5. Time Data is available
between the first and
the last touch-point
6. Time related costs like
interests is a user field
7. Since Each input is
captured by individual
user, all inputs necessary
for ROI and profitability
calculation is available
8. Reverse Roll-up all
customers to understand
the Marketing ROI of
each conversion stage
METHODOLOGY
• Since Customer Data, Product Data, Interaction Data, Transaction Data and
Marketing Spends are present in multiple silos, it is a very hard task to create a single
sheet of record due to missing handles
• Plumb5 Unified Stack Solution solves this problem easily as it maintains handle
across all data points and creates relationship tags across customer, product,
revenues and spends
• This allows Plumb5 to create
• Single Customer View
• Seamless Customer Journeys with money spent and earned on every customer
• Customer Lifetime Value
• Customer Profitability
WHY PLUMB5

Business Dashboards

  • 1.
  • 2.
    • Standard CustomerMetrics • Audience Trends • Cohort Performance – By Engagement, Purchases and Attrition • Support KPIs • Resolution KPIs • Engagement KPIs • Satisfaction KPIs • By Geography • By Customer Lifetime Value • By Customer Profitability • Standard Product Metrics • Products Sold • Product Performance – By Conversion and Satisfaction • Category-wise Products Sold • Category-wise Product Effectiveness • Category-wise Demand Supply Ratio • Standard Conversion Metrics • Total Conversions • Conversions By All Channels • Standard Revenue Metrics • Total Revenues • Revenues by Campaign • Revenues by First Purchase • Revenues by Repeat Purchase • Revenues by Geography • Standard Spend Metrics • Spends by Conversion Stages • Spends by Campaign • Revenues by Channels • Revenues by Geography 30 KEY BUSINESS METRICS TO MONITOR CUSTOMER METRICS PRODUCT METRICS CONVERSION & ROI METRICS REVENUE METRICS SPEND METRICS
  • 3.
    Global Metrics –Real-time View of Total Customers , Total Revenue and Total Spends for the Period1 With Filter Features By time period By custom segment Show Current or Predict Future Trends
  • 4.
    Total Audience that comprisesof Customers, Prospects and Viewers Total Customers Total Prospects who can be reached and has an intent score Total Aware includes visitors anonymously browsing to third party ad viewer report but cannot be identified
  • 5.
  • 6.
    Cohort Report ofthe select period based on engagement Cohort Report of the select period based on transactions Cohort Report of the select period based on customer churn
  • 7.
    Overall Customer Satisfaction Rate fora specific period Total Customer Support Call% for a specific period Total Calls, Resolves and FCRs Overall Customer Engagement Rate for a specific period Customers by Region/Zone
  • 8.
    Total Products across all categories TotalUnique Product Types Sold Average Conversion Rate of all products for a specific period Average Satisfaction Rate of all products for a specific period
  • 9.
    Product Performance An overviewto understand the generic performance of the products over a period of time with a customer satisfaction comparitive Total Product Sold An overview to understand total unit sales and an understanding if more unique products were sold
  • 10.
    A quick viewto understand product volume sold for a particular category for a specific period A quick view to understand how many customers are satisfied within a particular category for a specific period for a specific period A quick view to understand the gap between demand and supply within a particular category for a specific period
  • 11.
    Total Audience that comprisesof Customers, Prospects and Viewers Total Customers Total Prospects who can be reached and has an intent score Total Aware includes visitors anonymously browsing to third party ad viewer report but cannot be identified
  • 12.
    Total Conversions A viewto know how many converted to prospects; made their first purchase; and repeat purchases
  • 13.
    Conversions by Channel Aquick view to understand conversion rate for each individual channel. A key parameter to strategize and allocate budgets
  • 14.
    Total Revenues across allrevenue models. In this case, it has offline, online and partner Total Revenue from Offline model for a specific period Total Revenue from Online model for a specific period Total Revenue from Partner model for a specific period
  • 15.
    Revenues by Campaign Anoverview to understand which of their campaigns are driving more revenues Total Revenues An overview to understand which model is generating more revenue. In this case, there is online, offline and partner models
  • 16.
    Revenue by RepeatPurchase First Purchase accounts to customers who have already made their first purchase (Loyal customers). An overview to understand how much of revenue was generated through repeat purchases Revenue by First Purchase First Purchase accounts to customers who made their first purchase. An overview to understand how much of revenue was generated through first purchases
  • 17.
    Revenues by Region AnOverview that shows revenues from different zones over a specific period
  • 18.
    Total Spend towards acquisition, conversion and retentionfor a specific period Total Spend on Acquisition for a specific period Total Spend on conversions for a specific period Total Spend on Retaining customers for a specific period
  • 19.
    An Overview byCampaigns. A view by how many campaigns were conducted across all channels for the specific period along with associated spends and revenues Overview by Spend on Audience. A quick overview of how much was spent to acquire, convert and retain over a specific period
  • 20.
    Channel-wise Breakup of Spends,Revenue and Campaigns. This overview can tell you how many campaigns and associated spend on each channel along with revenue generated from the same
  • 21.
    All these dashboardsare customizable from the Plumb5 Data Management App
  • 22.
    1. To measureMarketing ROI and customer Profitability 2. We need inputs such as spends, revenue and parameters of time and time-costs 3. Spend Inputs are gathered at the first step of each conversion cycle 4. Revenue Inputs are gathered at the last step of each conversion cycle 5. Time Data is available between the first and the last touch-point 6. Time related costs like interests is a user field 7. Since Each input is captured by individual user, all inputs necessary for ROI and profitability calculation is available 8. Reverse Roll-up all customers to understand the Marketing ROI of each conversion stage METHODOLOGY
  • 23.
    • Since CustomerData, Product Data, Interaction Data, Transaction Data and Marketing Spends are present in multiple silos, it is a very hard task to create a single sheet of record due to missing handles • Plumb5 Unified Stack Solution solves this problem easily as it maintains handle across all data points and creates relationship tags across customer, product, revenues and spends • This allows Plumb5 to create • Single Customer View • Seamless Customer Journeys with money spent and earned on every customer • Customer Lifetime Value • Customer Profitability WHY PLUMB5