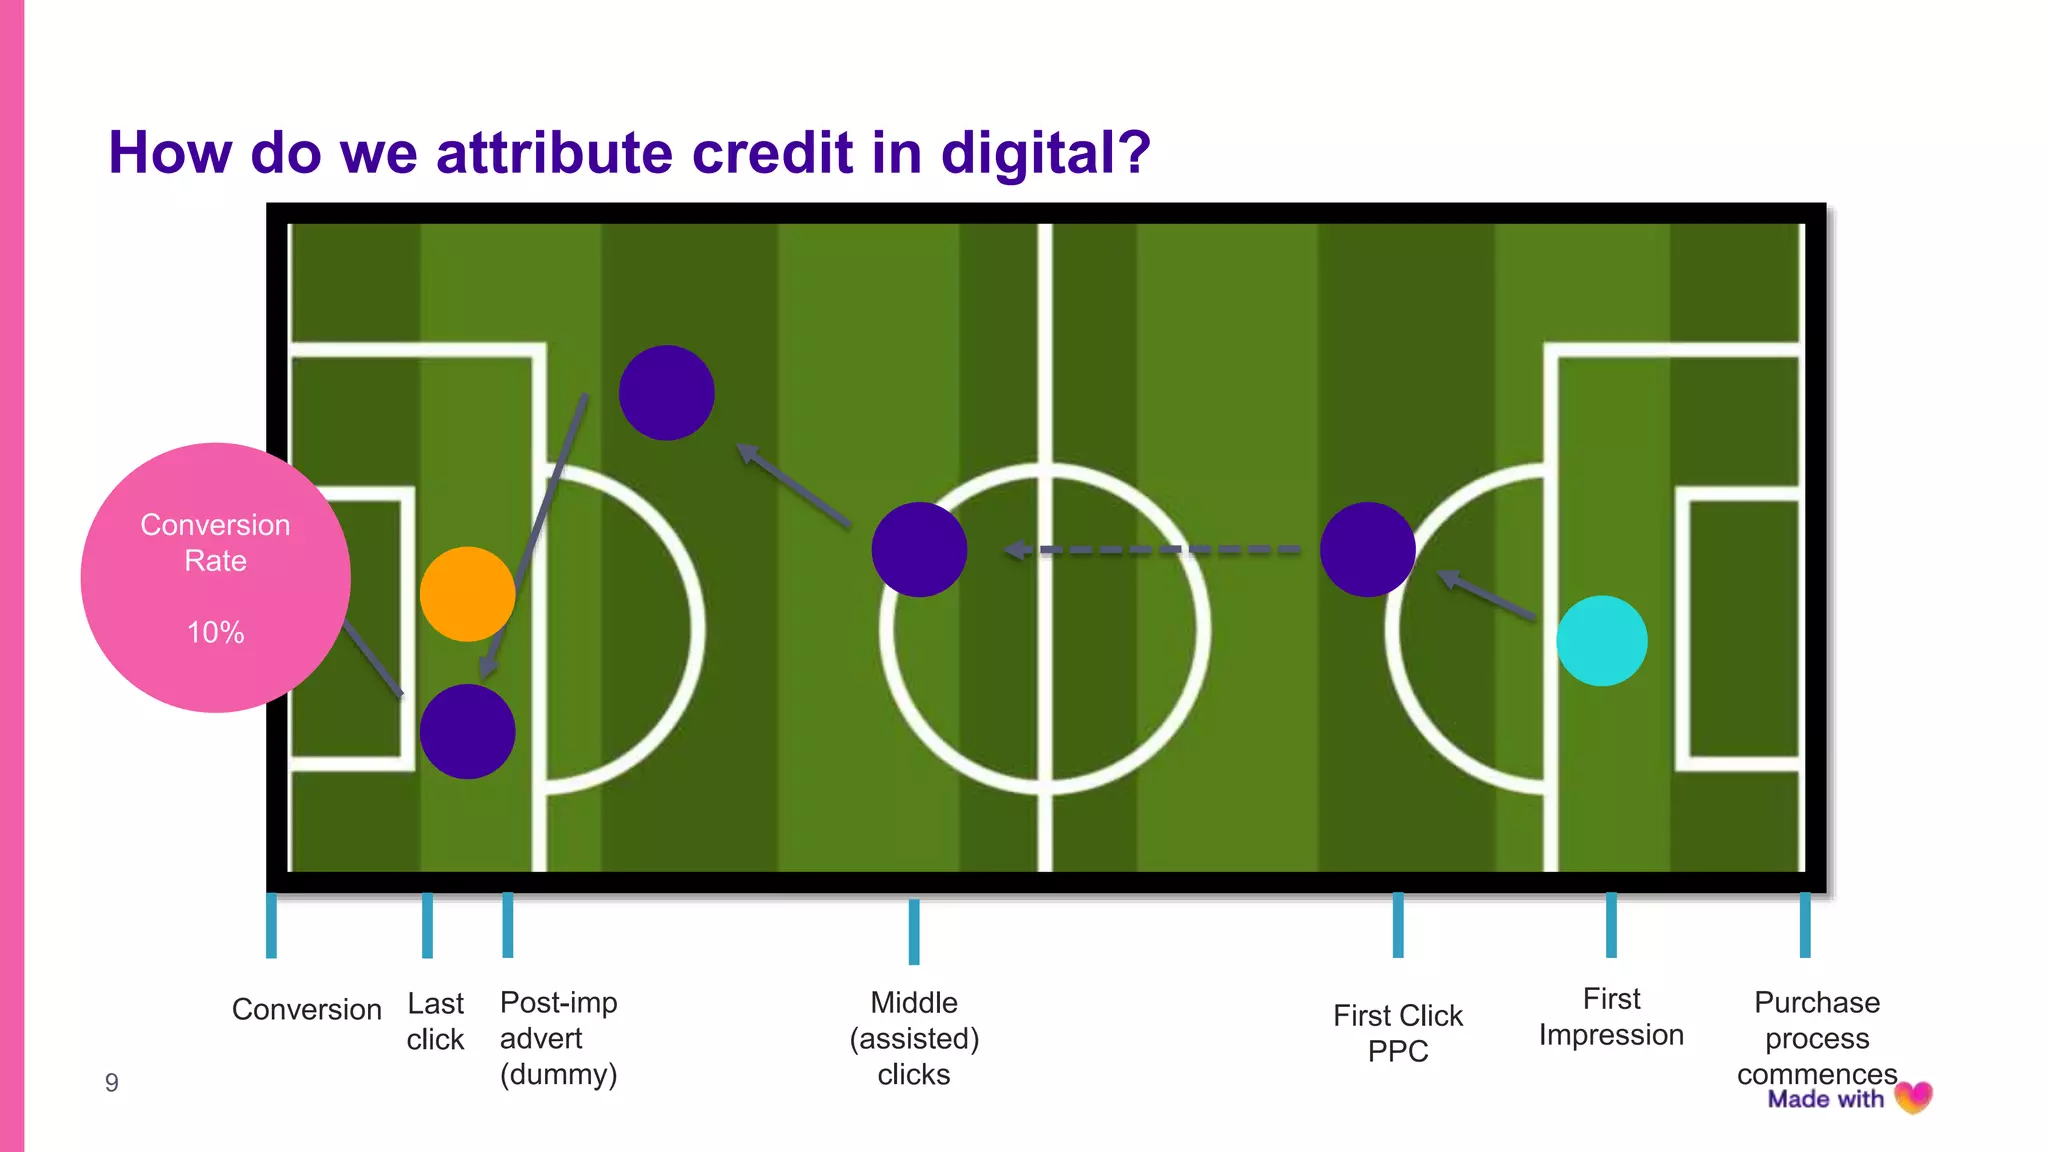
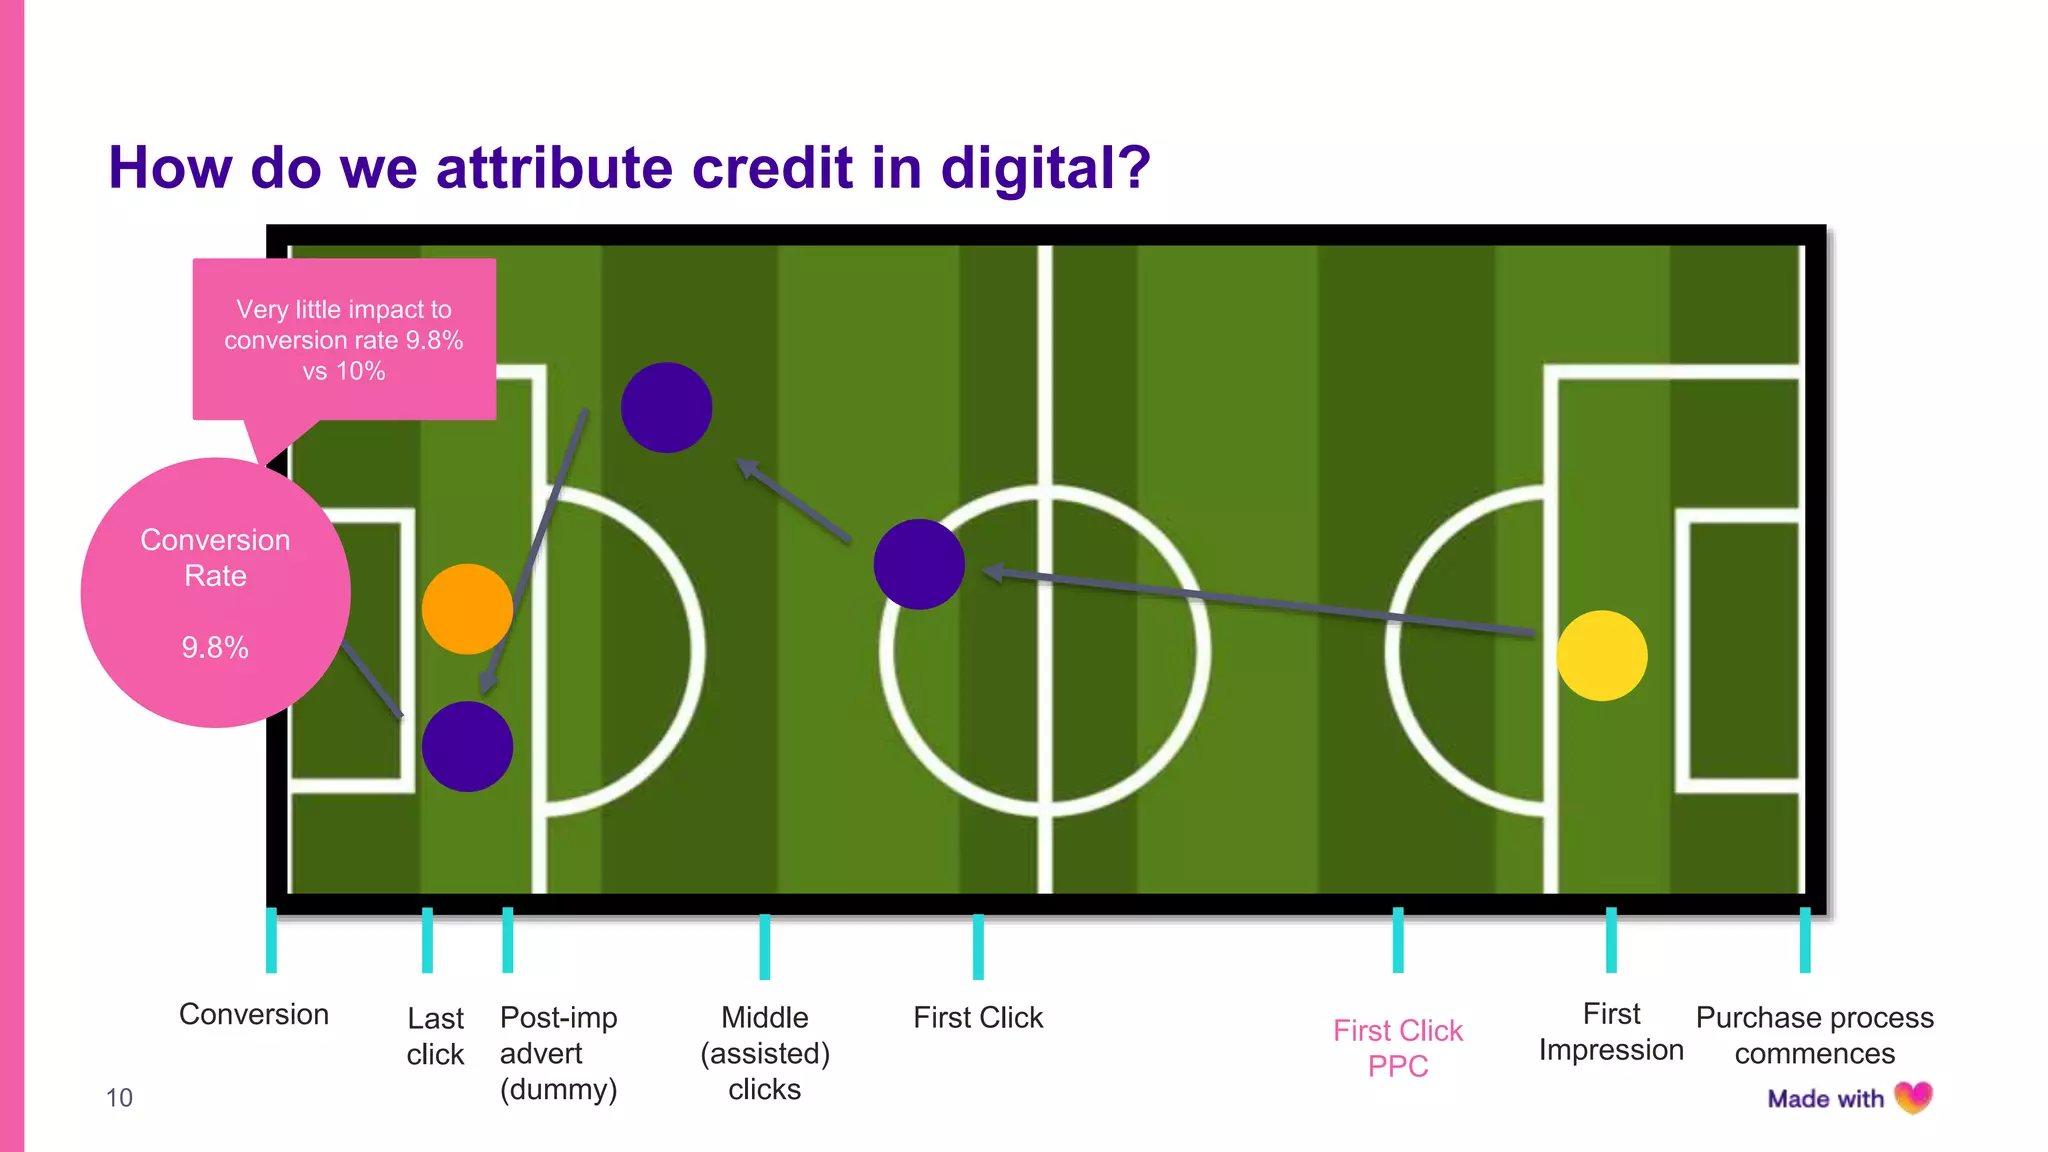
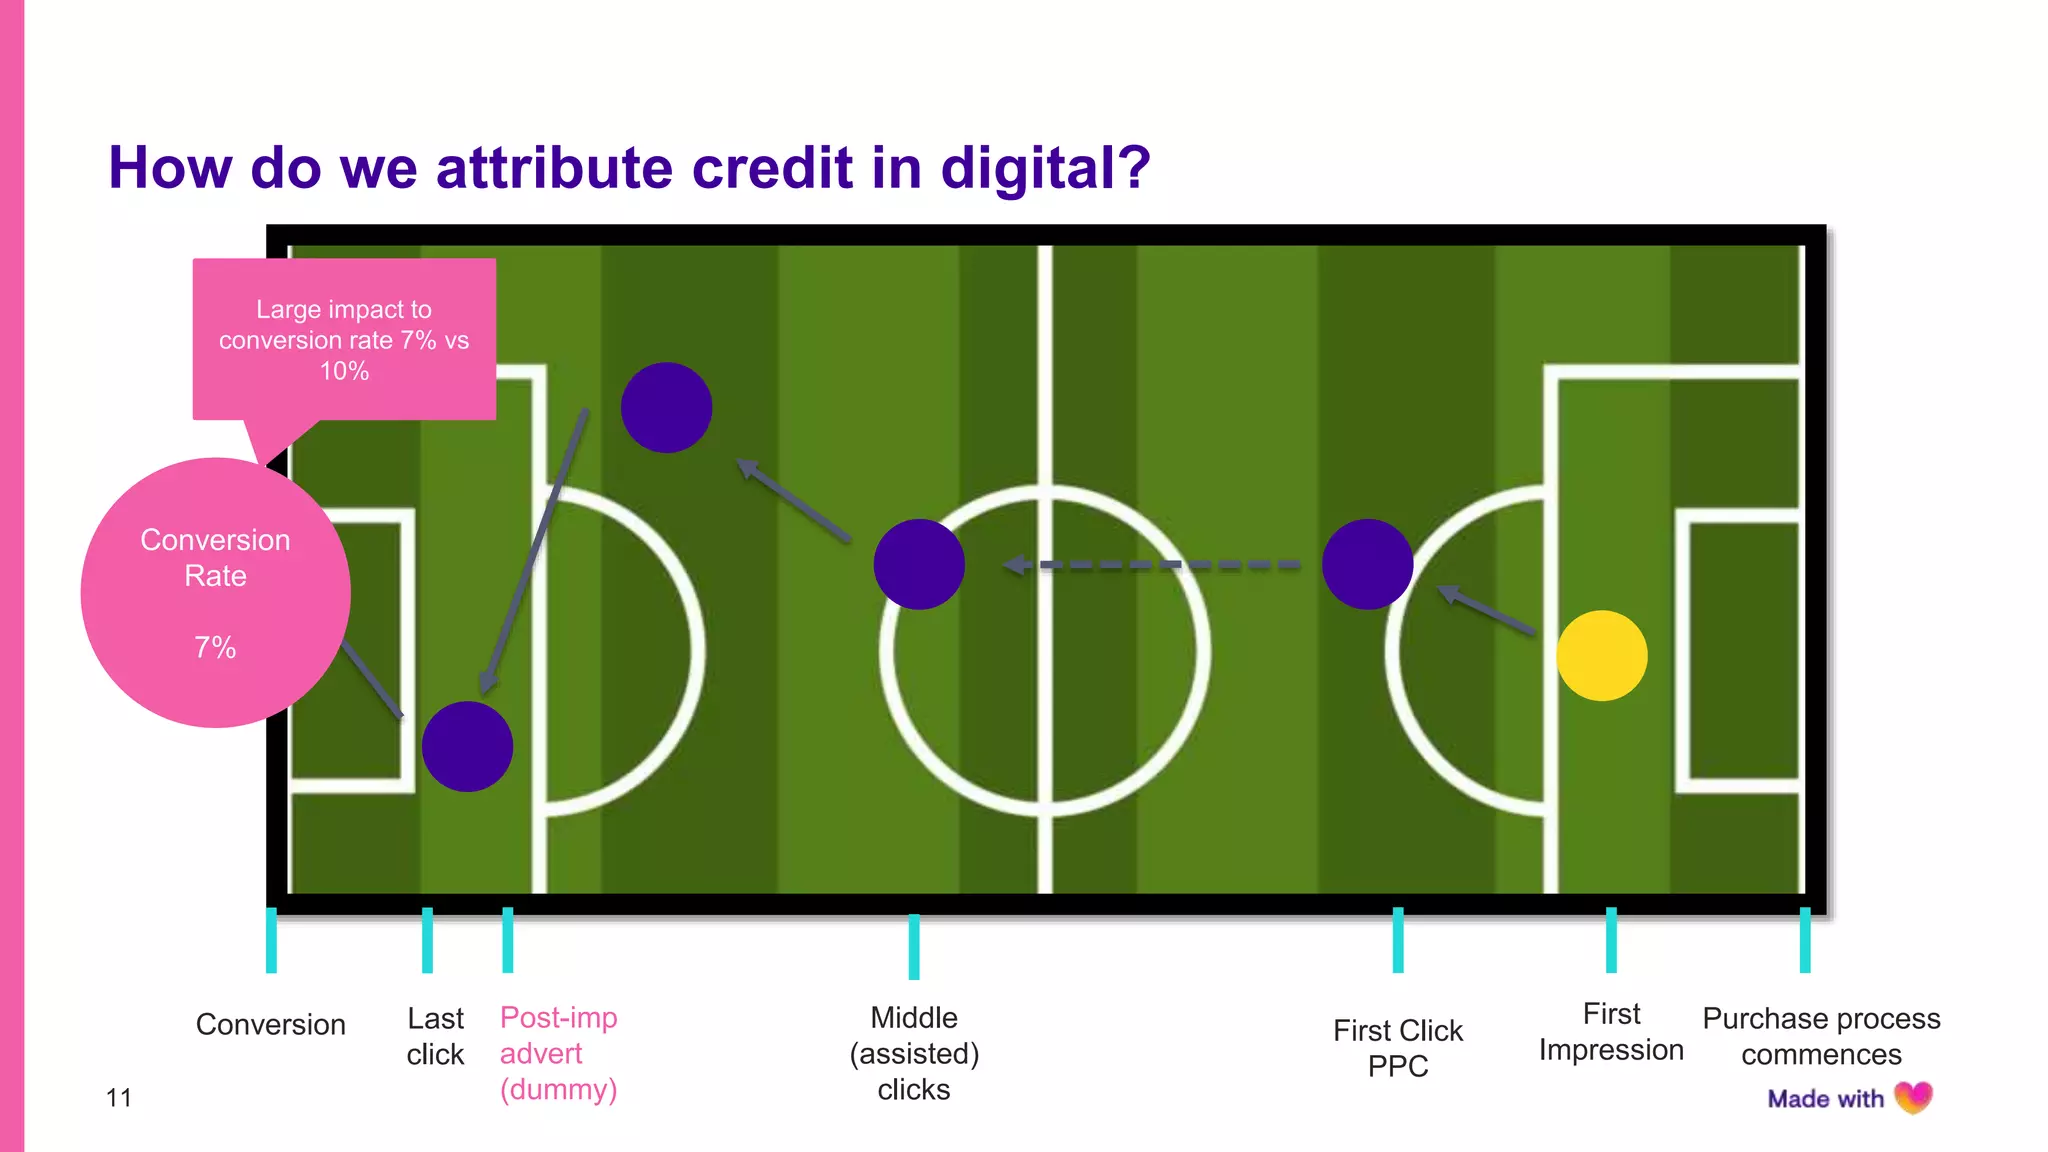
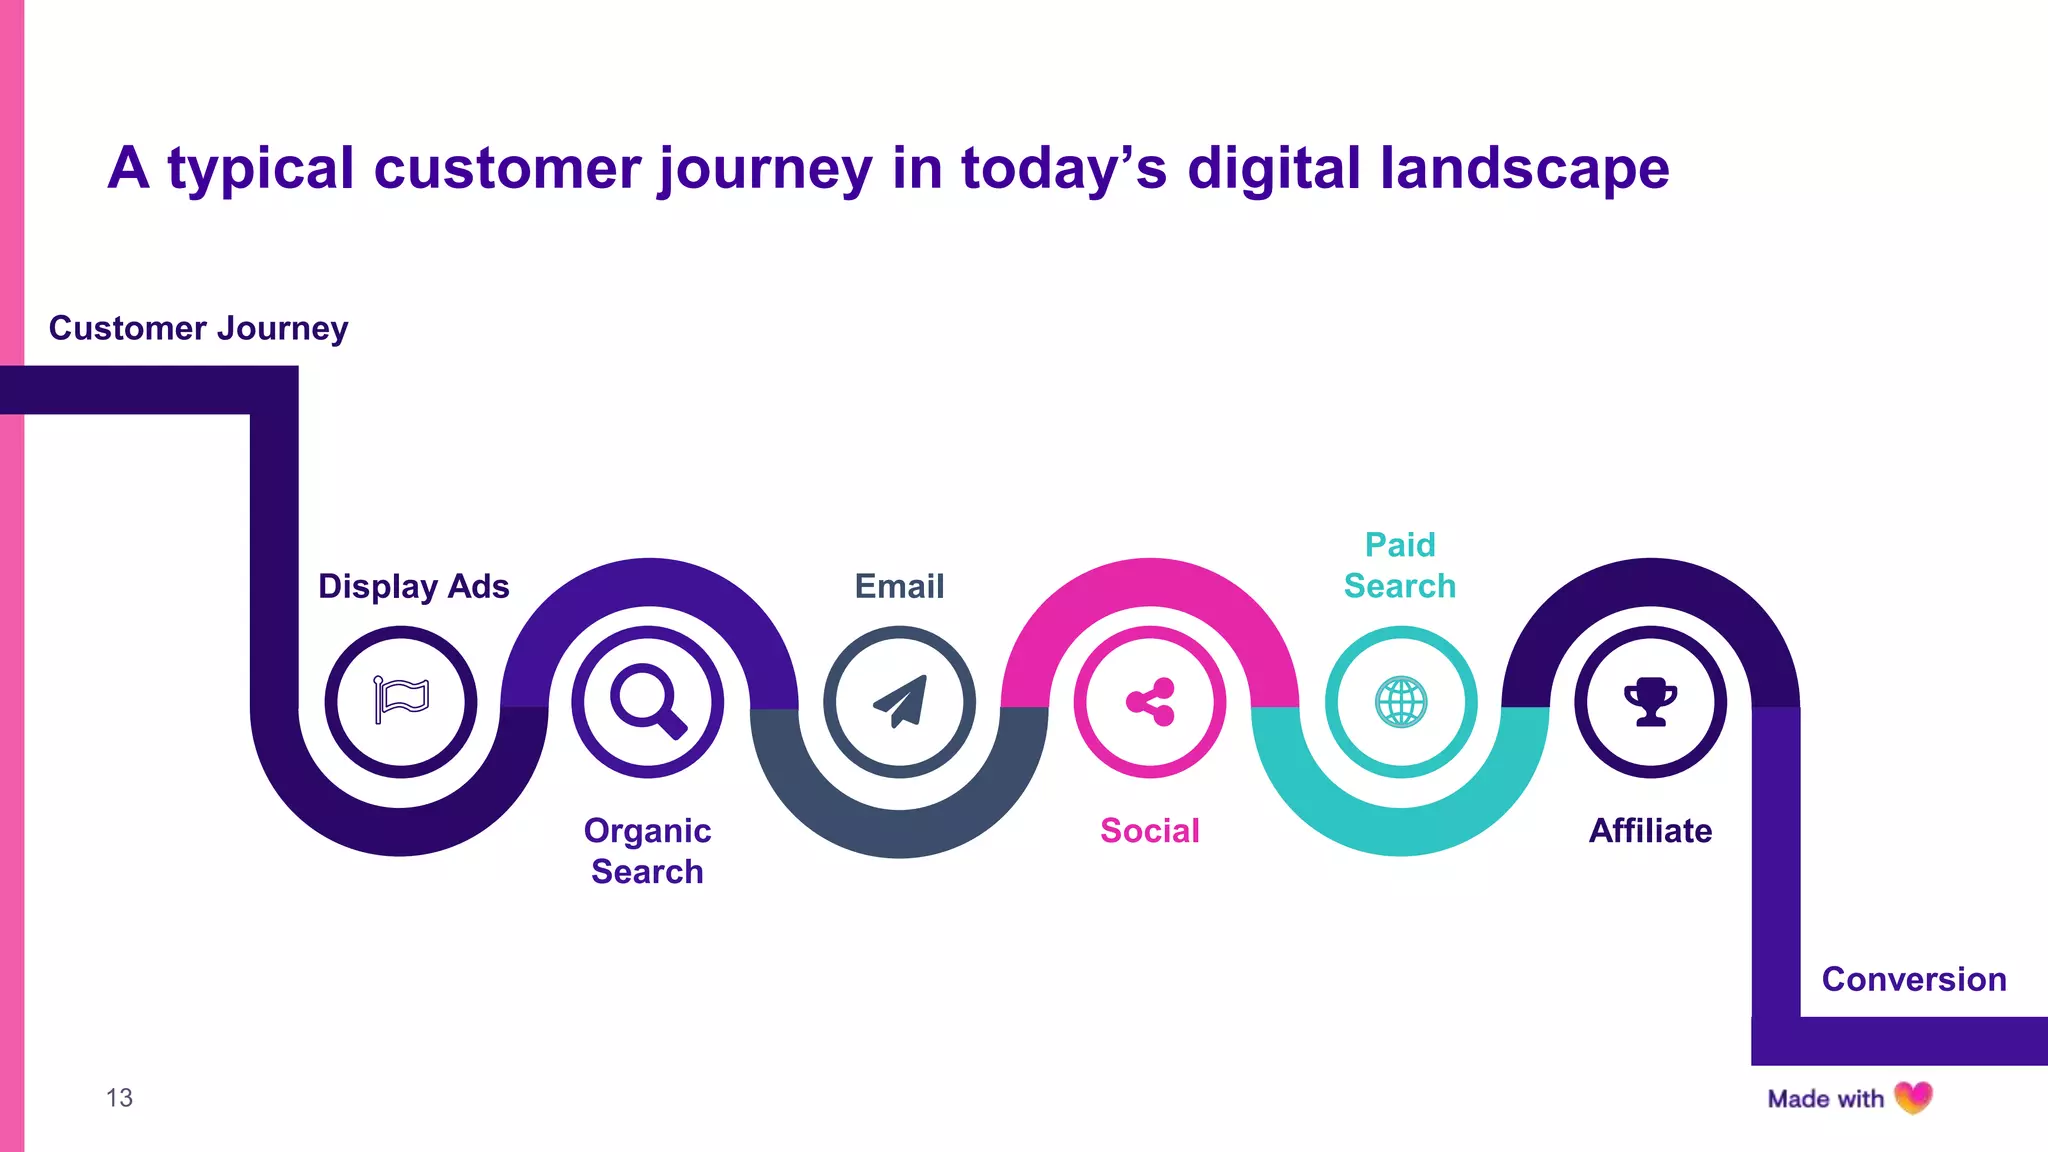
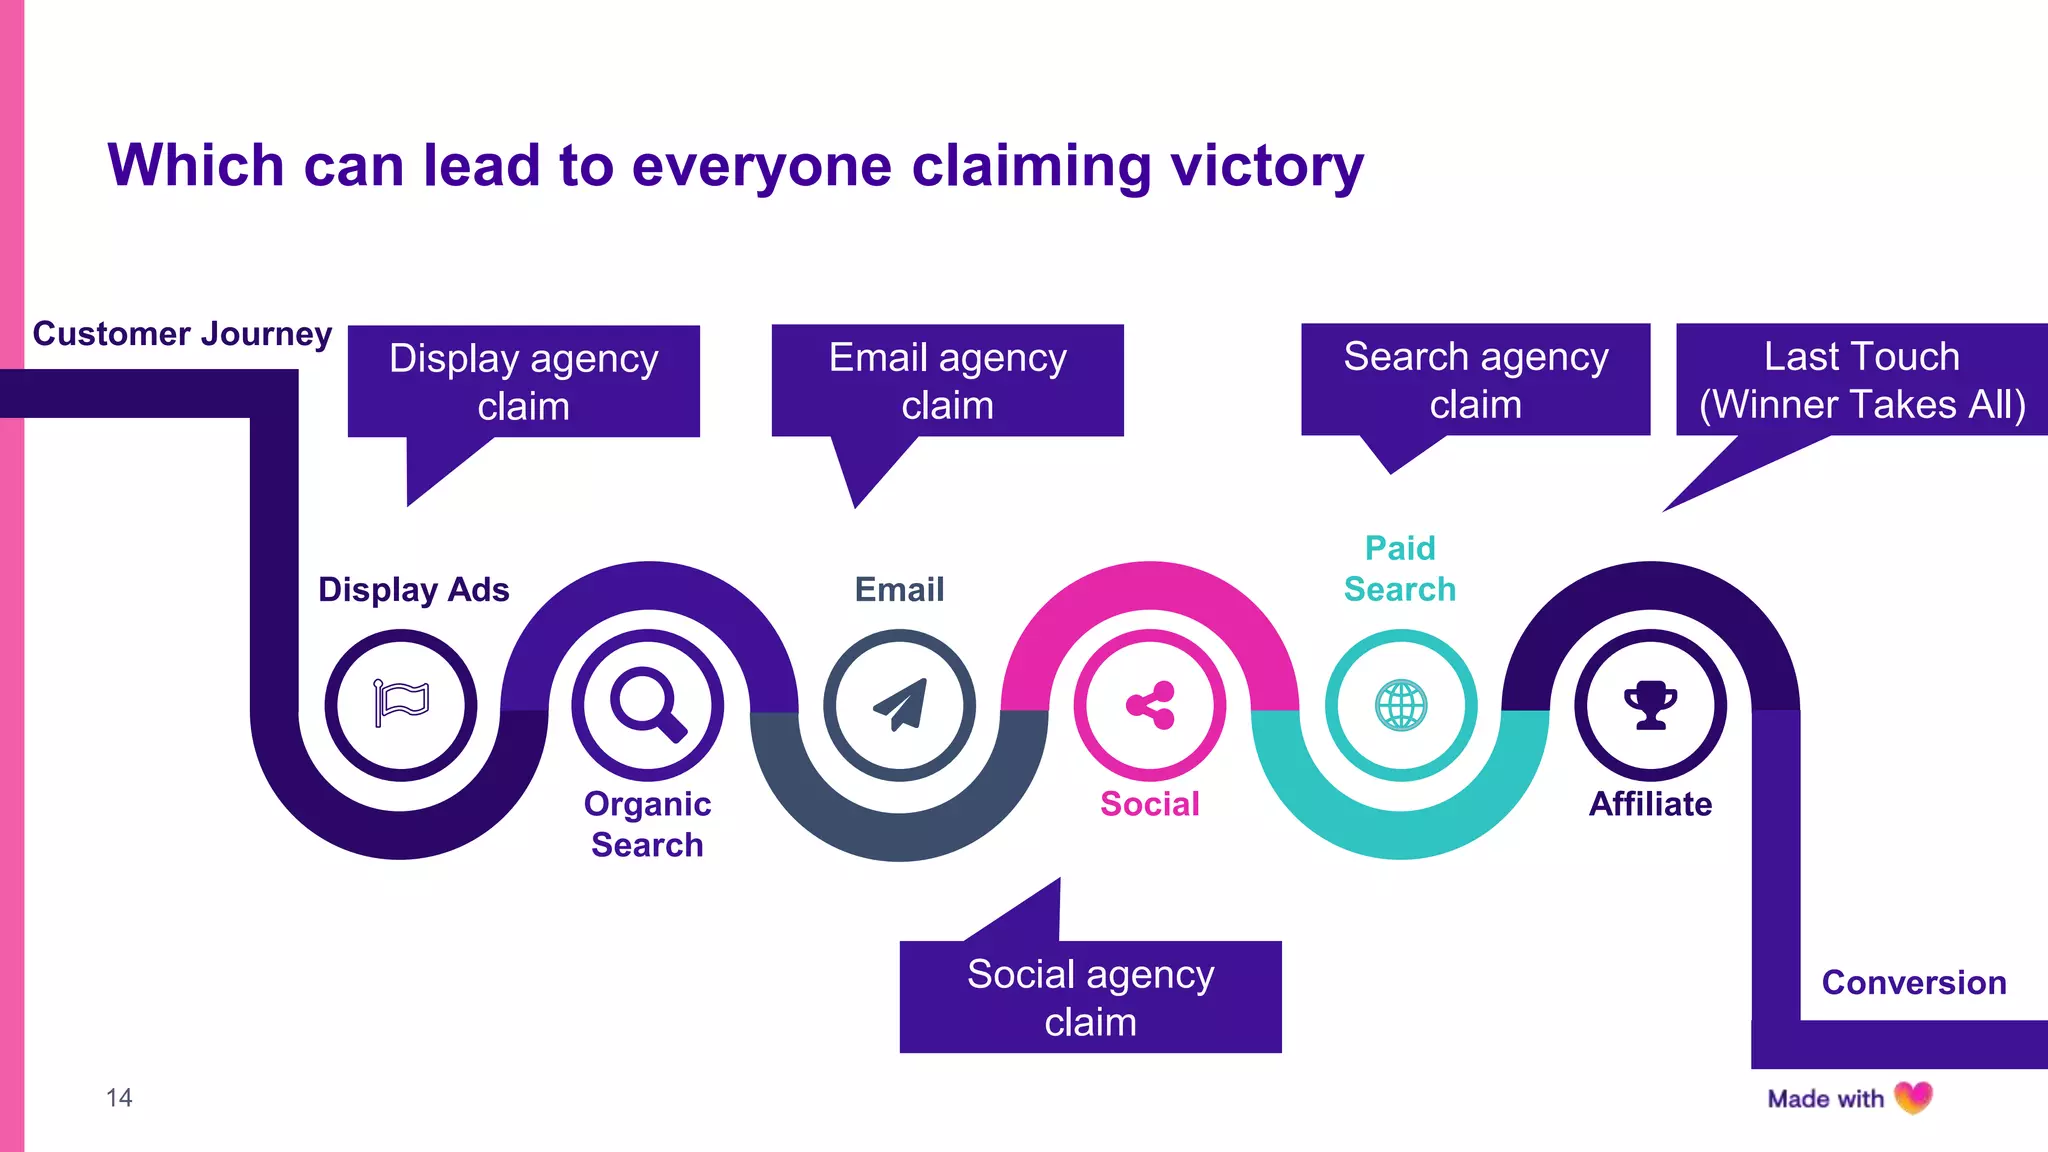
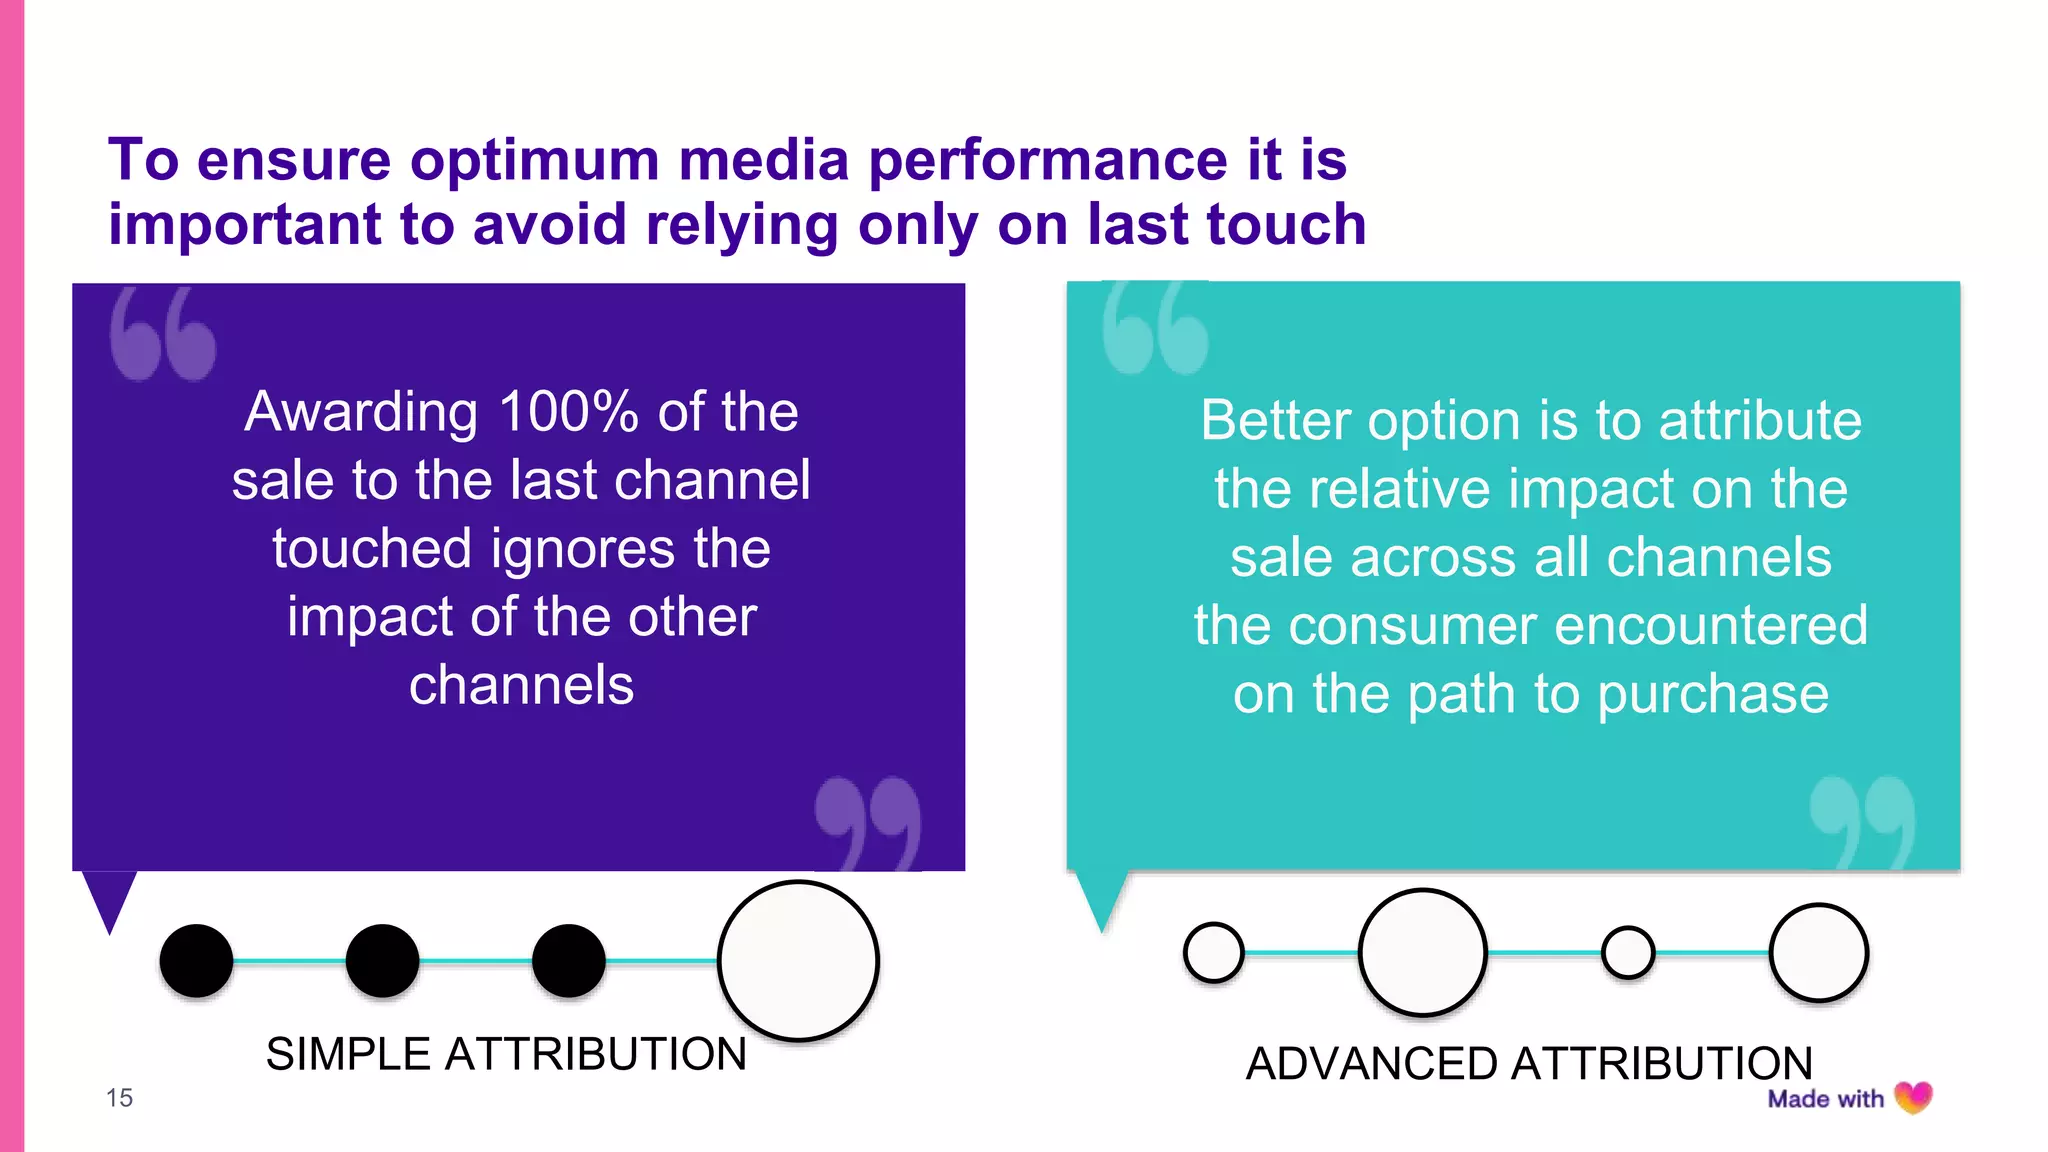
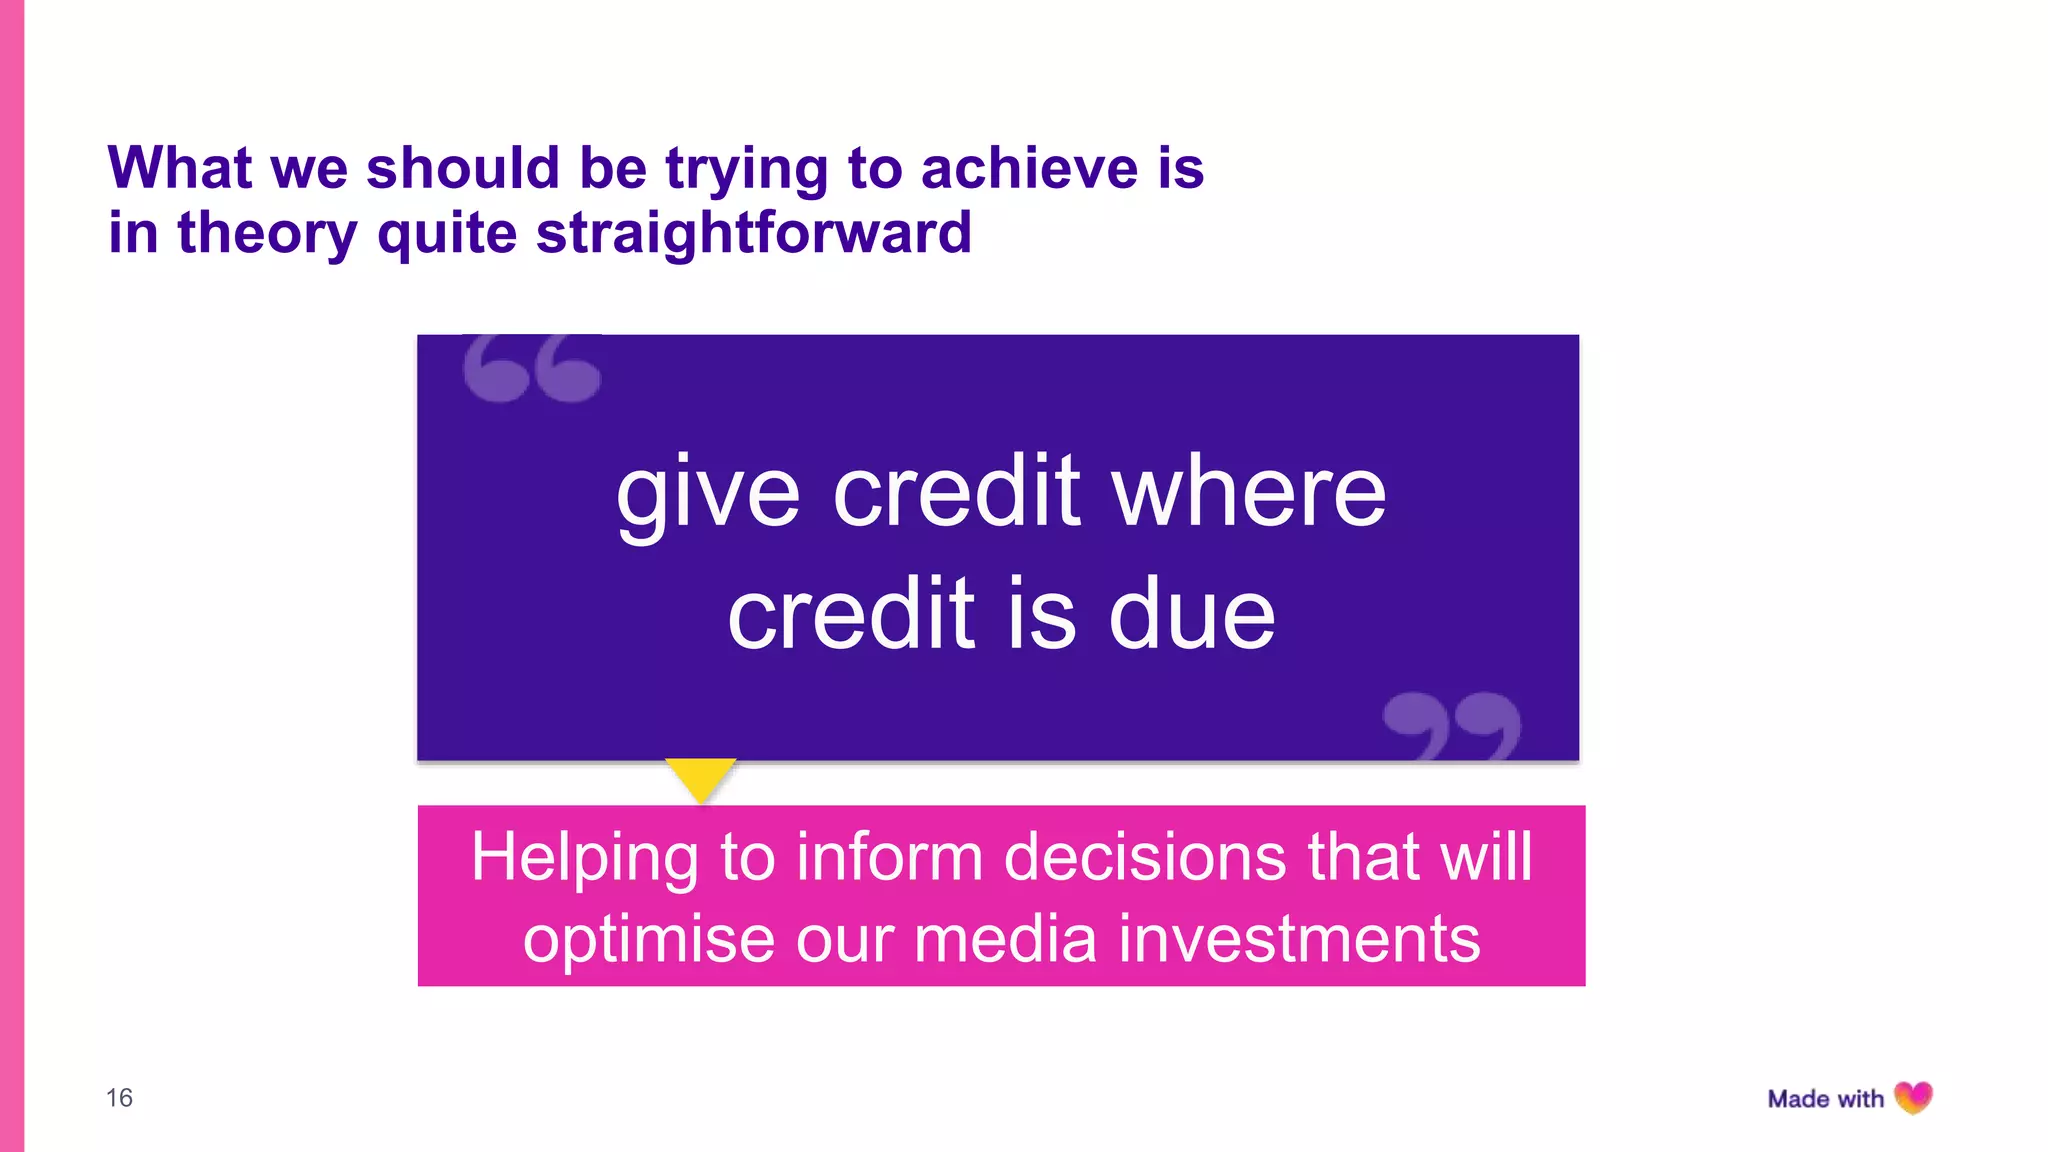
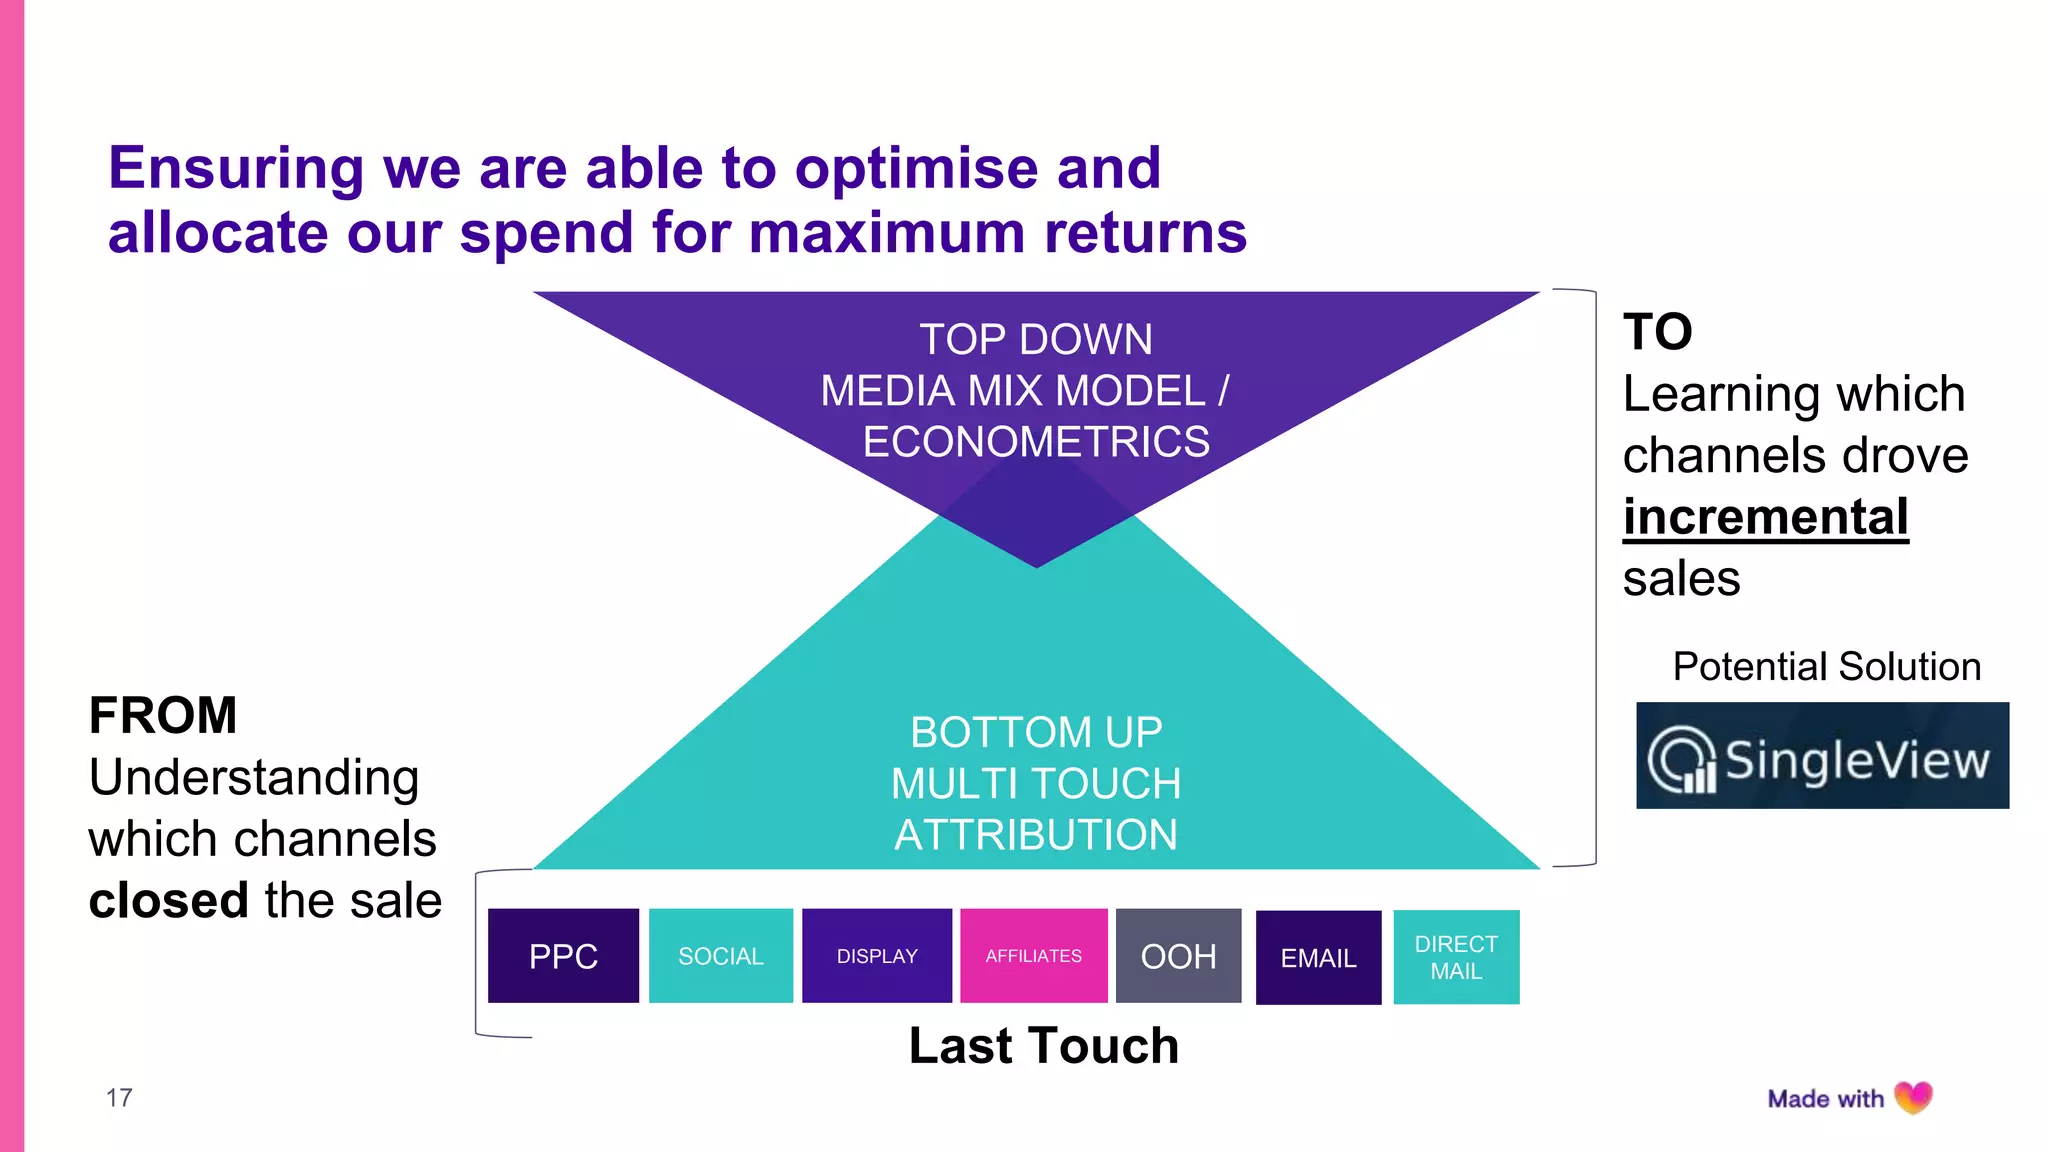
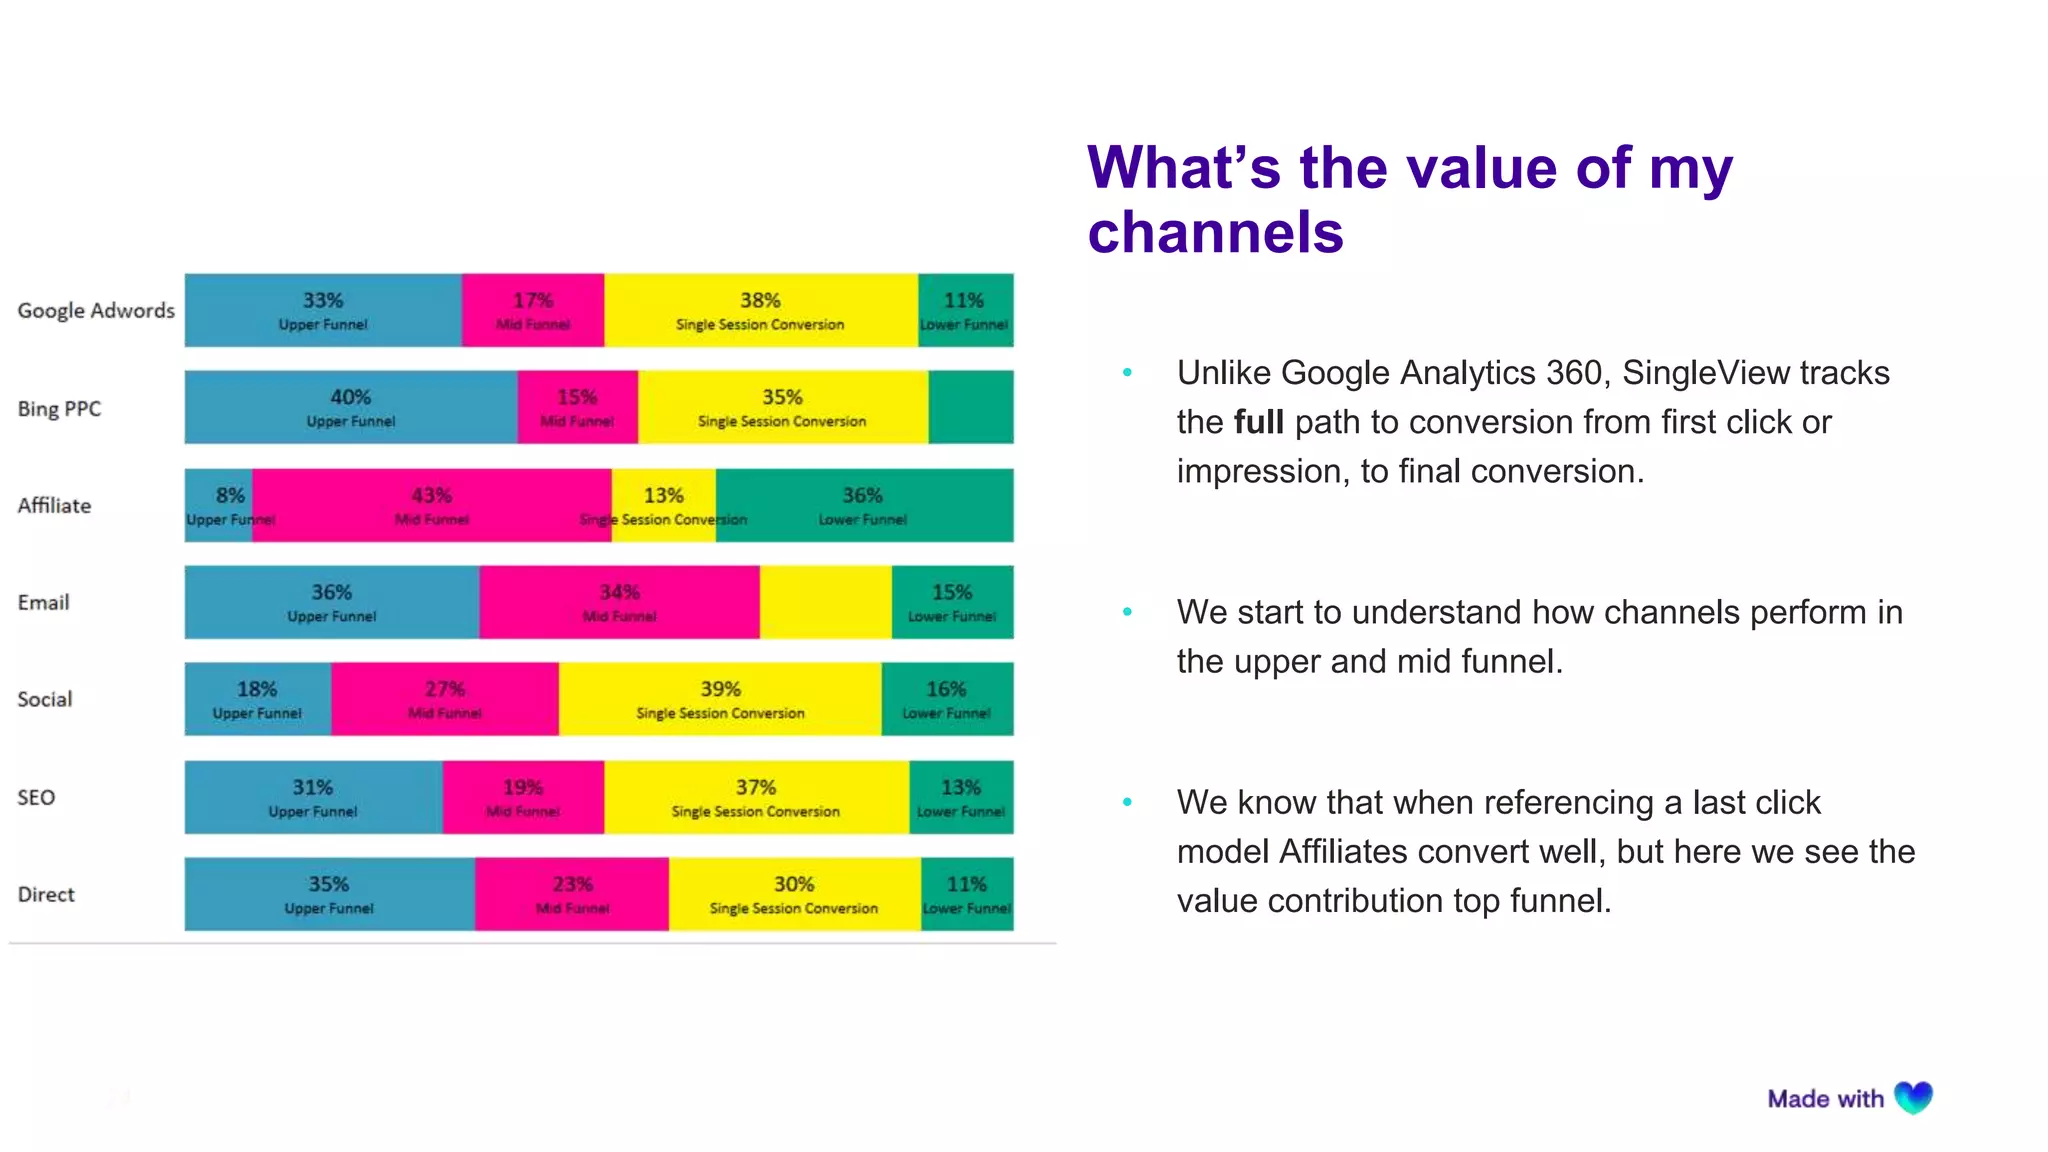
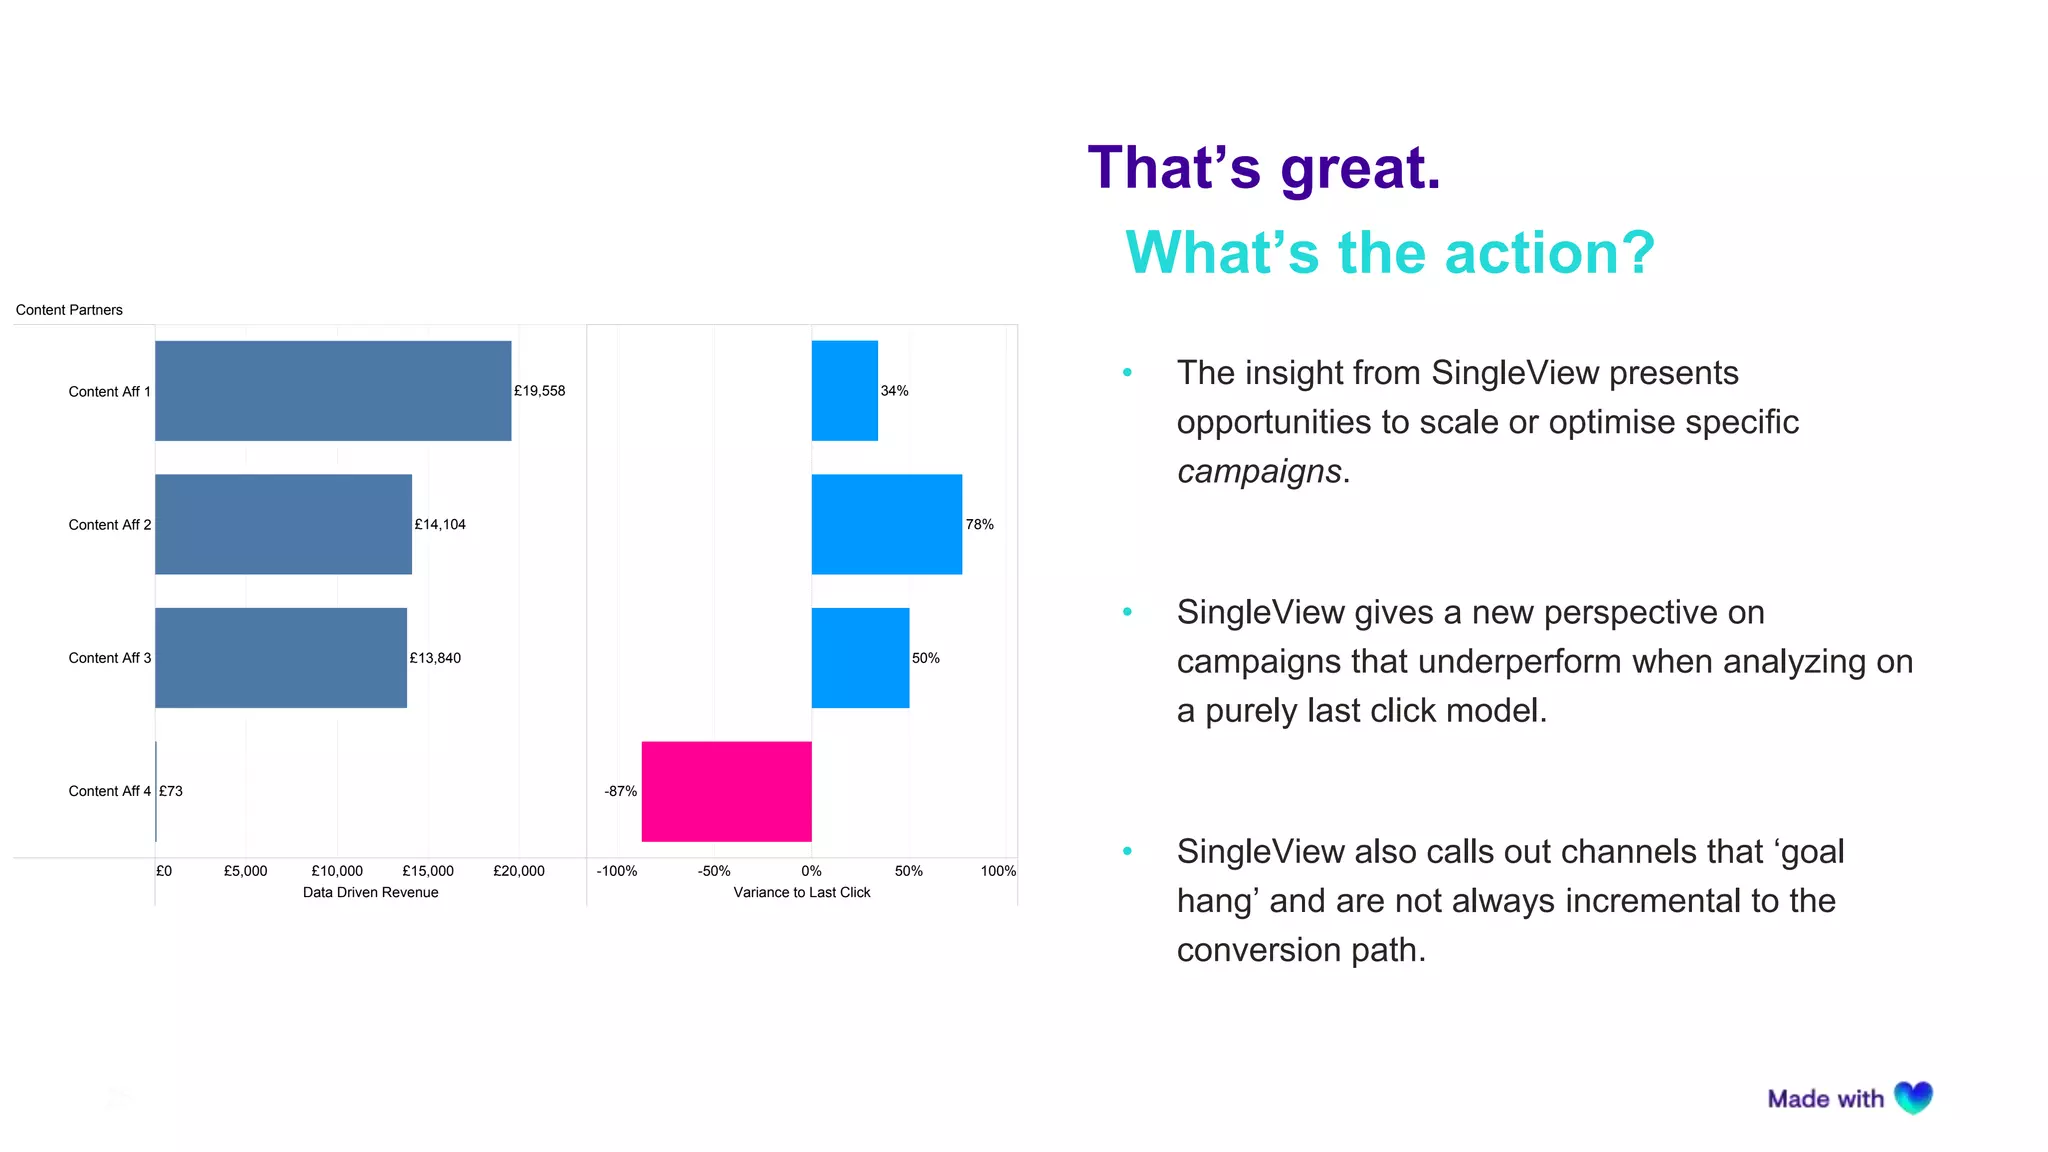
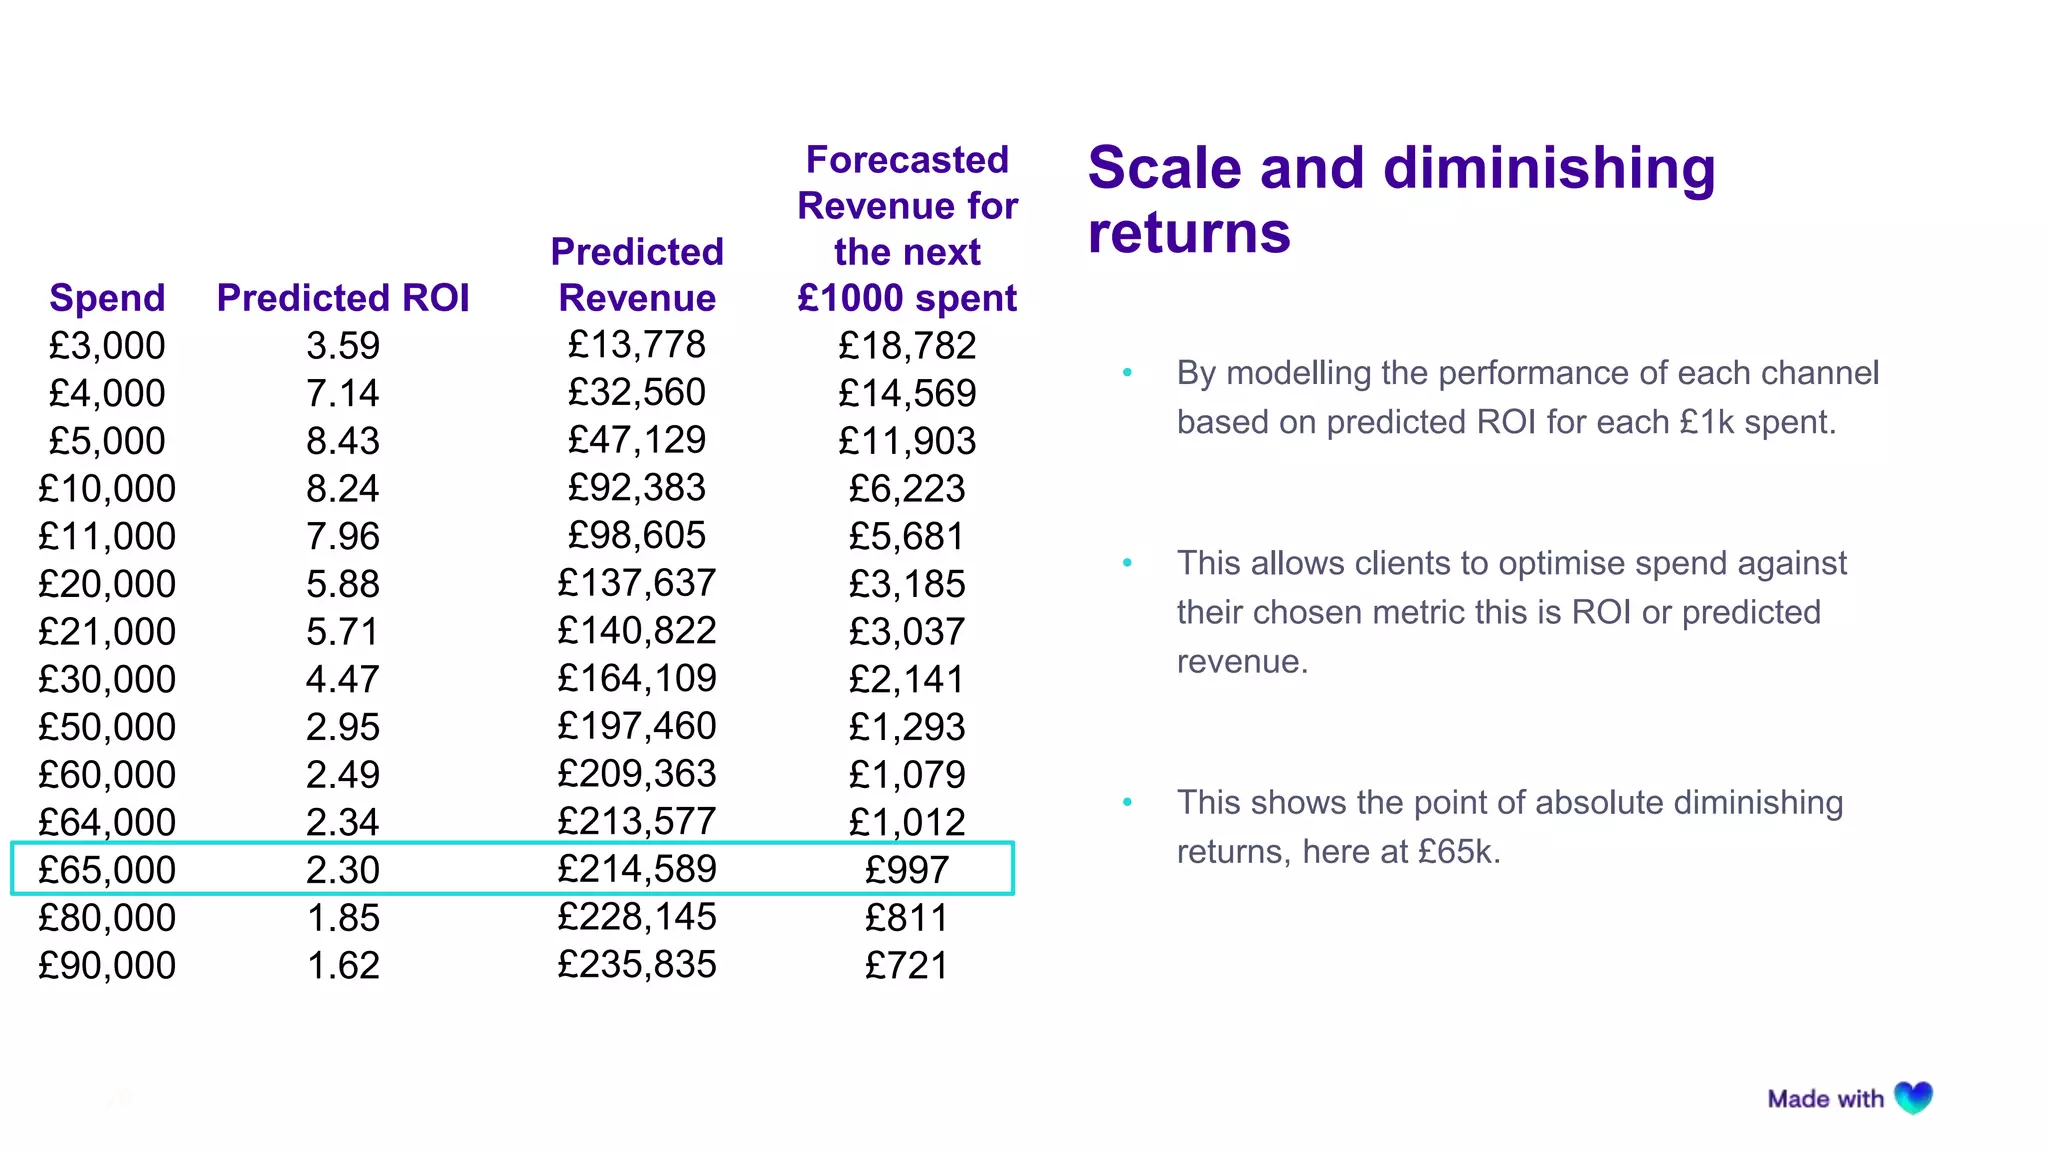
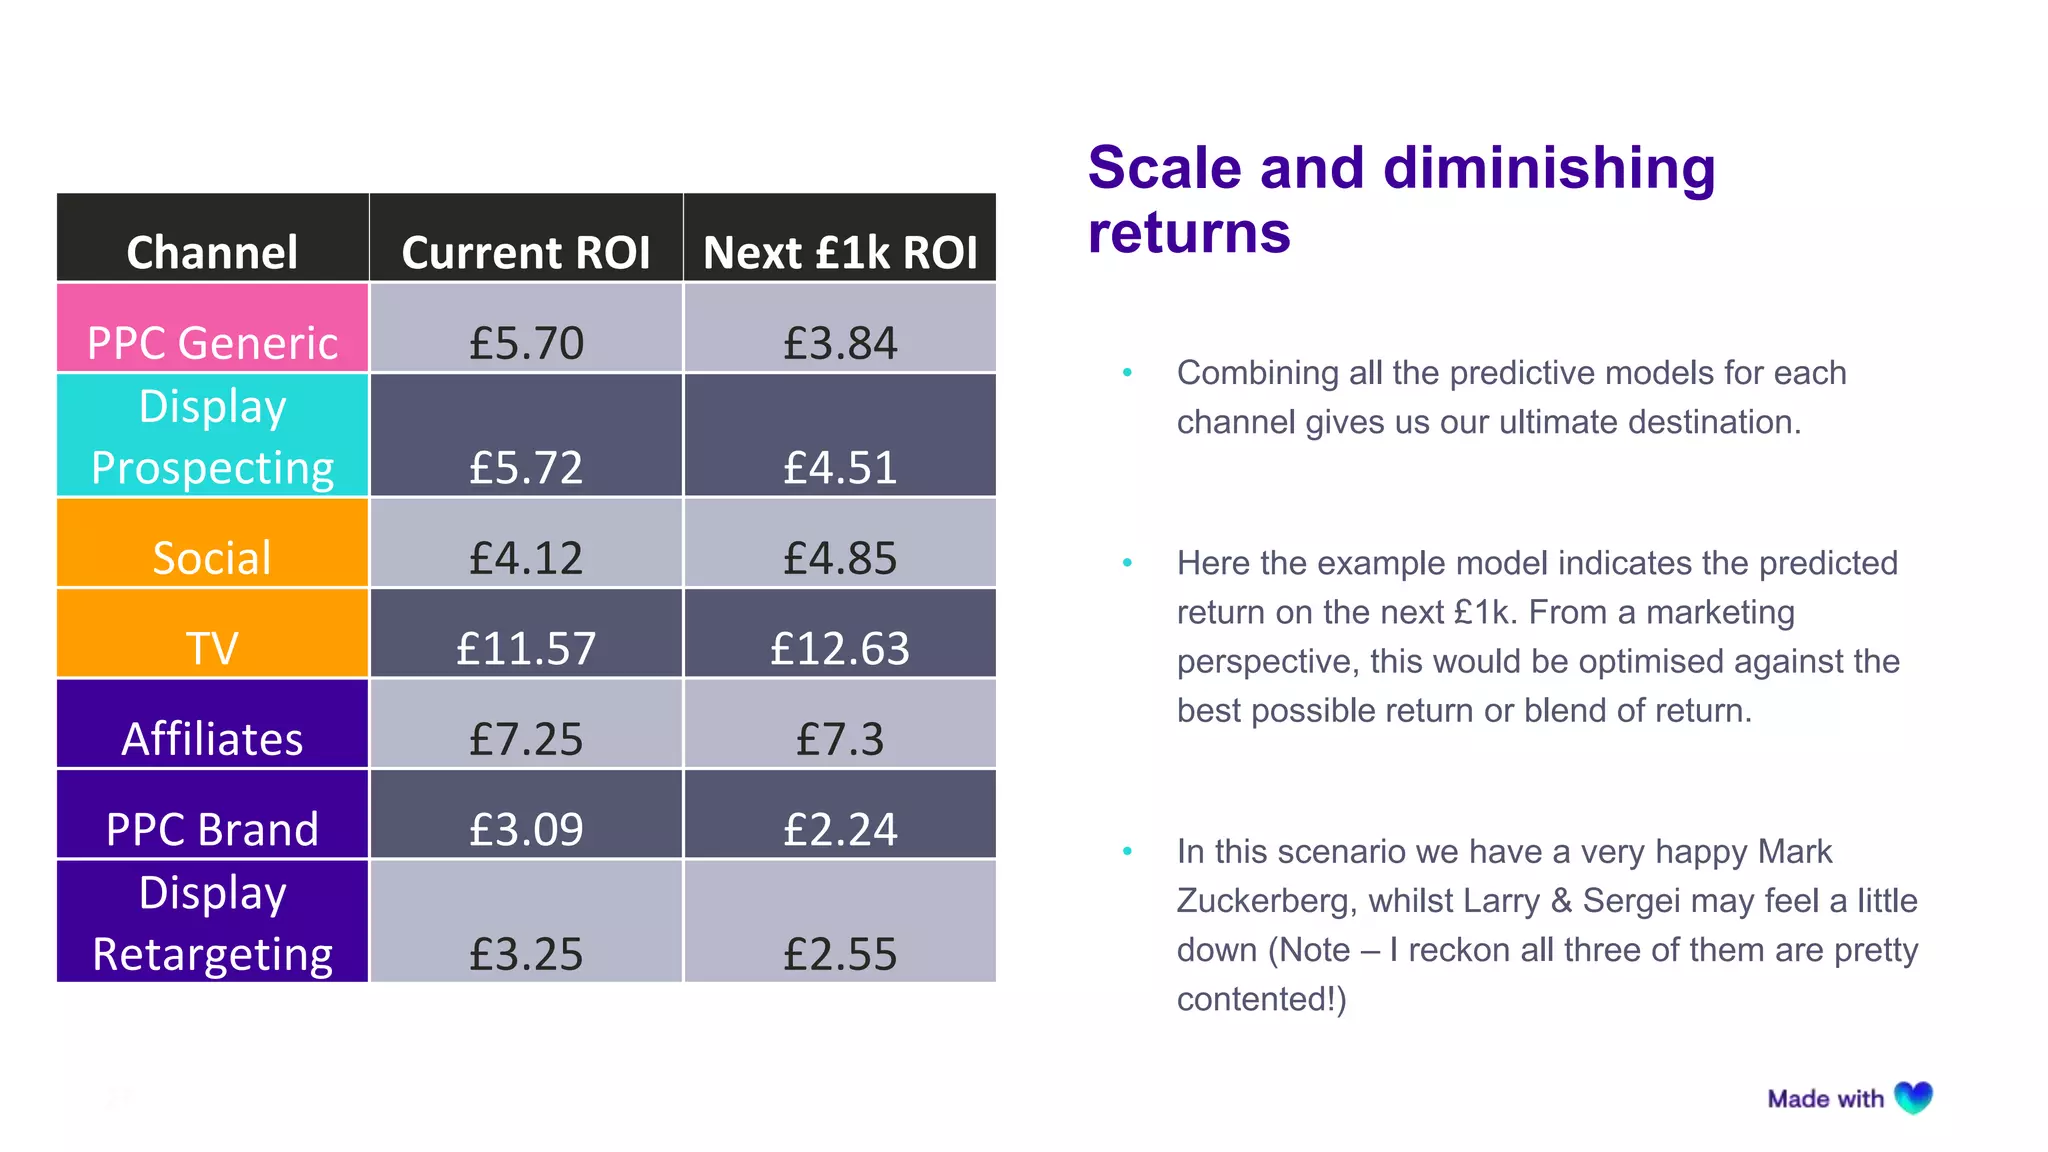
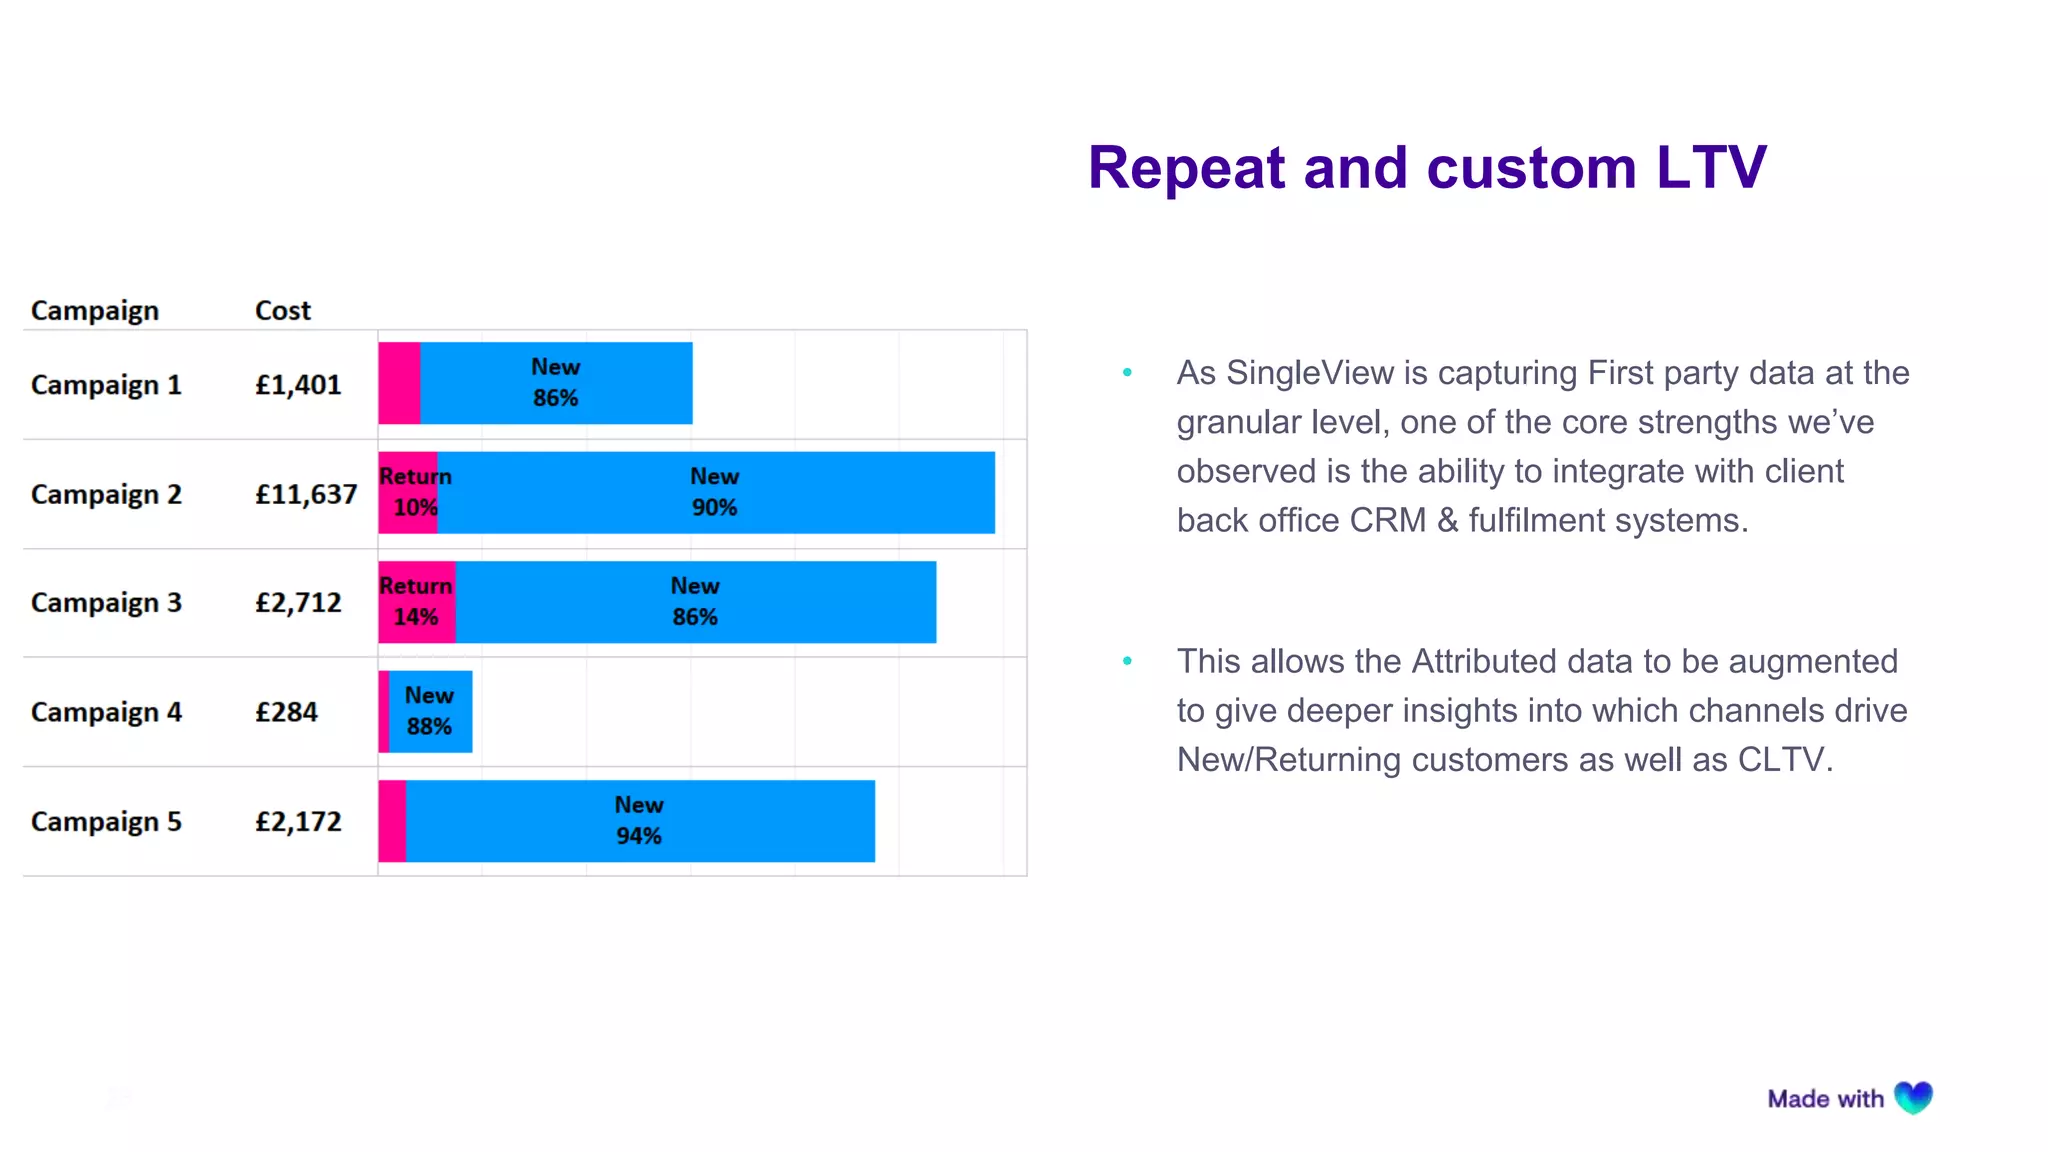
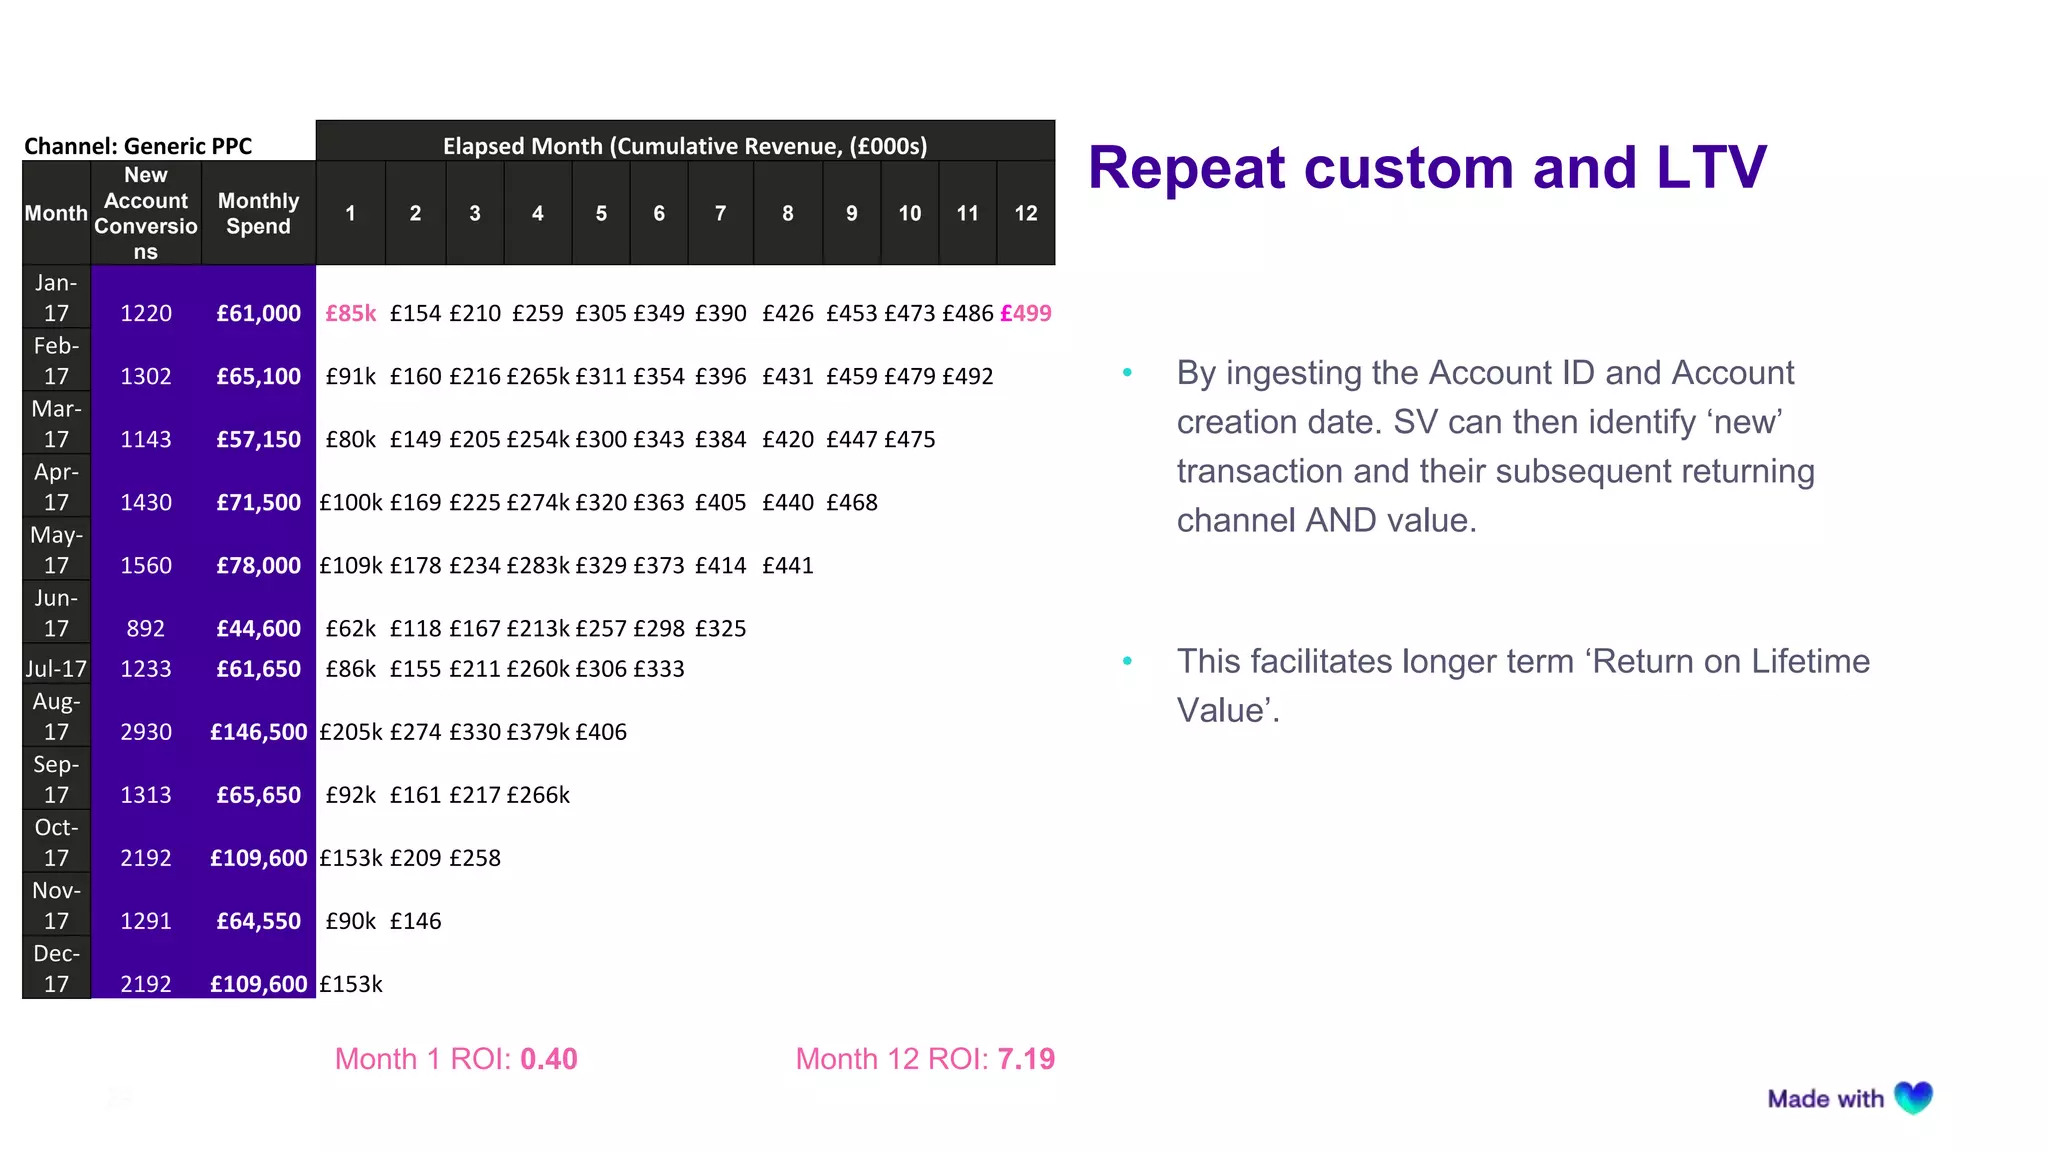
How attribution can make you a
title contender
Paul McCallum – Director of Customer Acquisition
Babylon Health
Chris Blower – Head of New Business Development
SingleView (R.O. EYE)
Babylon was founded
with a single purpose:
2
To put an accessible
and affordable health
service in the hands of
every person on earth.
3
So how many of you
have ever heard of
Babylon Health before
today?
How many of you have
ever used an online
doctor service?
What do these two have in
common?
Not that much to be completely honest!
• John Wanamaker (the one with the bow tie)
‒ Famous advertising quote
“Half the money I spend on advertising is wasted; the
trouble is I don't know which half."
• Nacer Chadli, Belgium World Cup star who also
played for Spurs & West Brom.
‒ No famous advertising quotes however
“90 per cent of people don't understand' why I moved
to West Brom”
They both won the World
Cup?
• No neither of them have won the World Cup.
• However during the World Cup this summer
Chadli whilst playing for Belgium scored a goal
that we are going to take a look at just now.
• In the 2018 world cup Belgium scored a last
minute winner against japan
• The attack started in their own 6 yard box and
involved 5 players before Chadli scored
• Was Chadli the hero? Or should the plaudits be
shared by his teammates?
• Let’s have a look!
Definitely one of the goals of
the tournament
https://www.youtube.com/watch?v=6jVdO1Q5xPE&feature=youtu.be
8
Different ways we can look at that goal of the tournament
Step 1 Step 2 Step 4Step 3
Conversi
on
X1
0
X .3
0
0
X .1
0
0
X .1
0
0
X .2
0
X1
X .3
X .2 X .2 X .2 X .2 X .2
First
Touch
Last
Touch
Position
Based
9
How do we attribute credit in digital?
Purchase
process
commences
First
Impression
First Click
PPC
Post-imp
advert
(dummy)
Last
click
Conversion Middle
(assisted)
clicks
Conversion
Rate
10%
10
How do we attribute credit in digital?
Purchase process
commences
First
Impression
Post-imp
advert
(dummy)
Last
click
Conversion First Click
Conversion
Rate
9.8%
Middle
(assisted)
clicks
Very little impact to
conversion rate 9.8%
vs 10%
First Click
PPC
11
How do we attribute credit in digital?
Purchase process
commences
First
Impression
First Click
PPC
Post-imp
advert
(dummy)
Last
click
Conversion Middle
(assisted)
clicks
Conversion
Rate
7%
Large impact to
conversion rate 7% vs
10%
12
Let’s move this back away from football and back to advertising.
13
A typical customer journey in today’s digital landscape
Display Ads
AffiliateSocial
Customer Journey
Conversion
Paid
SearchEmail
Organic
Search
14
Which can lead to everyone claiming victory
Display agency
claim
Email agency
claim
Social agency
claim
Search agency
claim
Last Touch
(Winner Takes All)
Display Ads
AffiliateSocial
Conversion
Paid
SearchEmail
Organic
Search
Customer Journey
15
To ensure optimum media performance it is
important to avoid relying only on last touch
Better option is to attribute
the relative impact on the
sale across all channels
the consumer encountered
on the path to purchase
SIMPLE ATTRIBUTION
Awarding 100% of the
sale to the last channel
touched ignores the
impact of the other
channels
ADVANCED ATTRIBUTION
16
What we should be trying to achieve is
in theory quite straightforward
Helping to inform decisions that will
optimise our media investments
give credit where
credit is due
17
Ensuring we are able to optimise and
allocate our spend for maximum returns
BOTTOM UP
MULTI TOUCH
ATTRIBUTION
TOP DOWN
MEDIA MIX MODEL /
ECONOMETRICS
TO
Learning which
channels drove
incremental
sales
PPC OOHSOCIAL DISPLAY AFFILIATES EMAIL
DIRECT
MAIL
Last Touch
FROM
Understanding
which channels
closed the sale
Potential Solution
18
This will give us the confidence that we are investing in the right
areas to grow our business as effectively as possible
19
Which has solid evidence as being the key to driving
the best marketing results
20
So how can we go about achieving this?
21
An ROI Evaluation Platform
22
The core question
Where do I
spend my next
marketing £1?
23
Answering key questions
How can I optimise
my campaigns
based on repeat
custom, and LTV?
Am I undervaluing (and
underutilising) any
advertising channels?
What’s the value of my
different advertising
channels?
How can I move spend
around to aid profit,
factoring economies of
scale and diminishing
returns
I’m seeing good
returns from my
advertising – but how
do I know my returns
are optimal?
What’s the value of my
channels
24
• Unlike Google Analytics 360, SingleView tracks
the full path to conversion from first click or
impression, to final conversion.
• We start to understand how channels perform in
the upper and mid funnel.
• We know that when referencing a last click
model Affiliates convert well, but here we see the
value contribution top funnel.
That’s great.
25
• The insight from SingleView presents
opportunities to scale or optimise specific
campaigns.
• SingleView gives a new perspective on
campaigns that underperform when analyzing on
a purely last click model.
• SingleView also calls out channels that ‘goal
hang’ and are not always incremental to the
conversion path.
What’s the action?
£0 £5,000 £10,000 £15,000 £20,000
Data Driven Revenue
-100% -50% 0% 50% 100%
Variance to Last Click
Content Aff 1
Content Aff 2
Content Aff 3
Content Aff 4
£19,558
£14,104
£13,840
£73 -87%
34%
78%
50%
Content Partners
Scale and diminishing
returns
26
• By modelling the performance of each channel
based on predicted ROI for each £1k spent.
• This allows clients to optimise spend against
their chosen metric this is ROI or predicted
revenue.
• This shows the point of absolute diminishing
returns, here at £65k.
Spend Predicted ROI
Predicted
Revenue
Forecasted
Revenue for
the next
£1000 spent
£3,000 3.59 £13,778 £18,782
£4,000 7.14 £32,560 £14,569
£5,000 8.43 £47,129 £11,903
£10,000 8.24 £92,383 £6,223
£11,000 7.96 £98,605 £5,681
£20,000 5.88 £137,637 £3,185
£21,000 5.71 £140,822 £3,037
£30,000 4.47 £164,109 £2,141
£50,000 2.95 £197,460 £1,293
£60,000 2.49 £209,363 £1,079
£64,000 2.34 £213,577 £1,012
£65,000 2.30 £214,589 £997
£80,000 1.85 £228,145 £811
£90,000 1.62 £235,835 £721
Scale and diminishing
returns
27
• Combining all the predictive models for each
channel gives us our ultimate destination.
• Here the example model indicates the predicted
return on the next £1k. From a marketing
perspective, this would be optimised against the
best possible return or blend of return.
• In this scenario we have a very happy Mark
Zuckerberg, whilst Larry & Sergei may feel a little
down (Note – I reckon all three of them are pretty
contented!)
Channel Current ROI Next £1k ROI
PPC Generic £5.70 £3.84
Display
Prospecting £5.72 £4.51
Social £4.12 £4.85
TV £11.57 £12.63
Affiliates £7.25 £7.3
PPC Brand £3.09 £2.24
Display
Retargeting £3.25 £2.55
Repeat and custom LTV
28
• As SingleView is capturing First party data at the
granular level, one of the core strengths we’ve
observed is the ability to integrate with client
back office CRM & fulfilment systems.
• This allows the Attributed data to be augmented
to give deeper insights into which channels drive
New/Returning customers as well as CLTV.
Repeat custom and LTV
29
• By ingesting the Account ID and Account
creation date. SV can then identify ‘new’
transaction and their subsequent returning
channel AND value.
• This facilitates longer term ‘Return on Lifetime
Value’.
Channel: Generic PPC Elapsed Month (Cumulative Revenue, (£000s)
Month
New
Account
Conversio
ns
Monthly
Spend
1 2 3 4 5 6 7 8 9 10 11 12
Jan-
17 1220 £61,000 £85k £154 £210 £259 £305 £349 £390 £426 £453 £473 £486 £499
Feb-
17 1302 £65,100 £91k £160 £216 £265k £311 £354 £396 £431 £459 £479 £492
Mar-
17 1143 £57,150 £80k £149 £205 £254k £300 £343 £384 £420 £447 £475
Apr-
17 1430 £71,500 £100k £169 £225 £274k £320 £363 £405 £440 £468
May-
17 1560 £78,000 £109k £178 £234 £283k £329 £373 £414 £441
Jun-
17 892 £44,600 £62k £118 £167 £213k £257 £298 £325
Jul-17 1233 £61,650 £86k £155 £211 £260k £306 £333
Aug-
17 2930 £146,500 £205k £274 £330 £379k £406
Sep-
17 1313 £65,650 £92k £161 £217 £266k
Oct-
17 2192 £109,600 £153k £209 £258
Nov-
17 1291 £64,550 £90k £146
Dec-
17 2192 £109,600 £153k
Month 1 ROI: 0.40 Month 12 ROI: 7.19
Our work has transformed
perceptions
30
Brief:
Understand the customer journey and test the general
hypothesis that Harvey’s customers on average have a
three week consideration period.
Solution:
Tag up all online data and track data for the online store
locator to understand the online / offline relationship
R.O.EYE were able to isolate transactions that completed
over the Easter period and identify when their journeys
started and in which channel.
Result:
The SingleView data indicated that very few of the customer
journeys Harveys were targeting in the early consideration
period were actually converting in the key Easter period.
Source: Harveys Easter Bank Holiday 2017
>3weeks
>48hours
Perceived customer
consideration period
Actual customer
consideration period
31
What about Cross Device Attribution?
41% of online retail transactions
involve two or more devices
Almost 40% of mobile cross
device conversions started on
Desktop
Source Criteo Q4 2016
32
Say Hello to TAPAD
Tapad tracks 3.9 billion devices
globally which equates to 560 million
device clusters
We can identify relationships between
devices, and can identify new devices
that belong to a single customer
Source Tapad 2018
33
What can you take away from today?
The importance of measuring
the true impact of your
marketing efforts throughout
your customer journey.
The reward being that you
will you get a better bang for
your buck from your
marketing budget.
Which will result in your
marketing turn your company
into a real title contender!
35
Questions

How attribution can make you a title contender

  • 1.
    How attribution canmake you a title contender Paul McCallum – Director of Customer Acquisition Babylon Health Chris Blower – Head of New Business Development SingleView (R.O. EYE)
  • 2.
    Babylon was founded witha single purpose: 2 To put an accessible and affordable health service in the hands of every person on earth.
  • 3.
    3 So how manyof you have ever heard of Babylon Health before today? How many of you have ever used an online doctor service?
  • 4.
    What do thesetwo have in common? Not that much to be completely honest! • John Wanamaker (the one with the bow tie) ‒ Famous advertising quote “Half the money I spend on advertising is wasted; the trouble is I don't know which half." • Nacer Chadli, Belgium World Cup star who also played for Spurs & West Brom. ‒ No famous advertising quotes however “90 per cent of people don't understand' why I moved to West Brom”
  • 5.
    They both wonthe World Cup? • No neither of them have won the World Cup. • However during the World Cup this summer Chadli whilst playing for Belgium scored a goal that we are going to take a look at just now.
  • 6.
    • In the2018 world cup Belgium scored a last minute winner against japan • The attack started in their own 6 yard box and involved 5 players before Chadli scored • Was Chadli the hero? Or should the plaudits be shared by his teammates? • Let’s have a look! Definitely one of the goals of the tournament
  • 7.
  • 8.
    8 Different ways wecan look at that goal of the tournament Step 1 Step 2 Step 4Step 3 Conversi on X1 0 X .3 0 0 X .1 0 0 X .1 0 0 X .2 0 X1 X .3 X .2 X .2 X .2 X .2 X .2 First Touch Last Touch Position Based
  • 9.
    9 How do weattribute credit in digital? Purchase process commences First Impression First Click PPC Post-imp advert (dummy) Last click Conversion Middle (assisted) clicks Conversion Rate 10%
  • 10.
    10 How do weattribute credit in digital? Purchase process commences First Impression Post-imp advert (dummy) Last click Conversion First Click Conversion Rate 9.8% Middle (assisted) clicks Very little impact to conversion rate 9.8% vs 10% First Click PPC
  • 11.
    11 How do weattribute credit in digital? Purchase process commences First Impression First Click PPC Post-imp advert (dummy) Last click Conversion Middle (assisted) clicks Conversion Rate 7% Large impact to conversion rate 7% vs 10%
  • 12.
    12 Let’s move thisback away from football and back to advertising.
  • 13.
    13 A typical customerjourney in today’s digital landscape Display Ads AffiliateSocial Customer Journey Conversion Paid SearchEmail Organic Search
  • 14.
    14 Which can leadto everyone claiming victory Display agency claim Email agency claim Social agency claim Search agency claim Last Touch (Winner Takes All) Display Ads AffiliateSocial Conversion Paid SearchEmail Organic Search Customer Journey
  • 15.
    15 To ensure optimummedia performance it is important to avoid relying only on last touch Better option is to attribute the relative impact on the sale across all channels the consumer encountered on the path to purchase SIMPLE ATTRIBUTION Awarding 100% of the sale to the last channel touched ignores the impact of the other channels ADVANCED ATTRIBUTION
  • 16.
    16 What we shouldbe trying to achieve is in theory quite straightforward Helping to inform decisions that will optimise our media investments give credit where credit is due
  • 17.
    17 Ensuring we areable to optimise and allocate our spend for maximum returns BOTTOM UP MULTI TOUCH ATTRIBUTION TOP DOWN MEDIA MIX MODEL / ECONOMETRICS TO Learning which channels drove incremental sales PPC OOHSOCIAL DISPLAY AFFILIATES EMAIL DIRECT MAIL Last Touch FROM Understanding which channels closed the sale Potential Solution
  • 18.
    18 This will giveus the confidence that we are investing in the right areas to grow our business as effectively as possible
  • 19.
    19 Which has solidevidence as being the key to driving the best marketing results
  • 20.
    20 So how canwe go about achieving this?
  • 21.
  • 22.
    22 The core question Wheredo I spend my next marketing £1?
  • 23.
    23 Answering key questions Howcan I optimise my campaigns based on repeat custom, and LTV? Am I undervaluing (and underutilising) any advertising channels? What’s the value of my different advertising channels? How can I move spend around to aid profit, factoring economies of scale and diminishing returns I’m seeing good returns from my advertising – but how do I know my returns are optimal?
  • 24.
    What’s the valueof my channels 24 • Unlike Google Analytics 360, SingleView tracks the full path to conversion from first click or impression, to final conversion. • We start to understand how channels perform in the upper and mid funnel. • We know that when referencing a last click model Affiliates convert well, but here we see the value contribution top funnel.
  • 25.
    That’s great. 25 • Theinsight from SingleView presents opportunities to scale or optimise specific campaigns. • SingleView gives a new perspective on campaigns that underperform when analyzing on a purely last click model. • SingleView also calls out channels that ‘goal hang’ and are not always incremental to the conversion path. What’s the action? £0 £5,000 £10,000 £15,000 £20,000 Data Driven Revenue -100% -50% 0% 50% 100% Variance to Last Click Content Aff 1 Content Aff 2 Content Aff 3 Content Aff 4 £19,558 £14,104 £13,840 £73 -87% 34% 78% 50% Content Partners
  • 26.
    Scale and diminishing returns 26 •By modelling the performance of each channel based on predicted ROI for each £1k spent. • This allows clients to optimise spend against their chosen metric this is ROI or predicted revenue. • This shows the point of absolute diminishing returns, here at £65k. Spend Predicted ROI Predicted Revenue Forecasted Revenue for the next £1000 spent £3,000 3.59 £13,778 £18,782 £4,000 7.14 £32,560 £14,569 £5,000 8.43 £47,129 £11,903 £10,000 8.24 £92,383 £6,223 £11,000 7.96 £98,605 £5,681 £20,000 5.88 £137,637 £3,185 £21,000 5.71 £140,822 £3,037 £30,000 4.47 £164,109 £2,141 £50,000 2.95 £197,460 £1,293 £60,000 2.49 £209,363 £1,079 £64,000 2.34 £213,577 £1,012 £65,000 2.30 £214,589 £997 £80,000 1.85 £228,145 £811 £90,000 1.62 £235,835 £721
  • 27.
    Scale and diminishing returns 27 •Combining all the predictive models for each channel gives us our ultimate destination. • Here the example model indicates the predicted return on the next £1k. From a marketing perspective, this would be optimised against the best possible return or blend of return. • In this scenario we have a very happy Mark Zuckerberg, whilst Larry & Sergei may feel a little down (Note – I reckon all three of them are pretty contented!) Channel Current ROI Next £1k ROI PPC Generic £5.70 £3.84 Display Prospecting £5.72 £4.51 Social £4.12 £4.85 TV £11.57 £12.63 Affiliates £7.25 £7.3 PPC Brand £3.09 £2.24 Display Retargeting £3.25 £2.55
  • 28.
    Repeat and customLTV 28 • As SingleView is capturing First party data at the granular level, one of the core strengths we’ve observed is the ability to integrate with client back office CRM & fulfilment systems. • This allows the Attributed data to be augmented to give deeper insights into which channels drive New/Returning customers as well as CLTV.
  • 29.
    Repeat custom andLTV 29 • By ingesting the Account ID and Account creation date. SV can then identify ‘new’ transaction and their subsequent returning channel AND value. • This facilitates longer term ‘Return on Lifetime Value’. Channel: Generic PPC Elapsed Month (Cumulative Revenue, (£000s) Month New Account Conversio ns Monthly Spend 1 2 3 4 5 6 7 8 9 10 11 12 Jan- 17 1220 £61,000 £85k £154 £210 £259 £305 £349 £390 £426 £453 £473 £486 £499 Feb- 17 1302 £65,100 £91k £160 £216 £265k £311 £354 £396 £431 £459 £479 £492 Mar- 17 1143 £57,150 £80k £149 £205 £254k £300 £343 £384 £420 £447 £475 Apr- 17 1430 £71,500 £100k £169 £225 £274k £320 £363 £405 £440 £468 May- 17 1560 £78,000 £109k £178 £234 £283k £329 £373 £414 £441 Jun- 17 892 £44,600 £62k £118 £167 £213k £257 £298 £325 Jul-17 1233 £61,650 £86k £155 £211 £260k £306 £333 Aug- 17 2930 £146,500 £205k £274 £330 £379k £406 Sep- 17 1313 £65,650 £92k £161 £217 £266k Oct- 17 2192 £109,600 £153k £209 £258 Nov- 17 1291 £64,550 £90k £146 Dec- 17 2192 £109,600 £153k Month 1 ROI: 0.40 Month 12 ROI: 7.19
  • 30.
    Our work hastransformed perceptions 30 Brief: Understand the customer journey and test the general hypothesis that Harvey’s customers on average have a three week consideration period. Solution: Tag up all online data and track data for the online store locator to understand the online / offline relationship R.O.EYE were able to isolate transactions that completed over the Easter period and identify when their journeys started and in which channel. Result: The SingleView data indicated that very few of the customer journeys Harveys were targeting in the early consideration period were actually converting in the key Easter period. Source: Harveys Easter Bank Holiday 2017 >3weeks >48hours Perceived customer consideration period Actual customer consideration period
  • 31.
    31 What about CrossDevice Attribution? 41% of online retail transactions involve two or more devices Almost 40% of mobile cross device conversions started on Desktop Source Criteo Q4 2016
  • 32.
    32 Say Hello toTAPAD Tapad tracks 3.9 billion devices globally which equates to 560 million device clusters We can identify relationships between devices, and can identify new devices that belong to a single customer Source Tapad 2018
  • 33.
    33 What can youtake away from today?
  • 34.
    The importance ofmeasuring the true impact of your marketing efforts throughout your customer journey. The reward being that you will you get a better bang for your buck from your marketing budget. Which will result in your marketing turn your company into a real title contender!
  • 35.