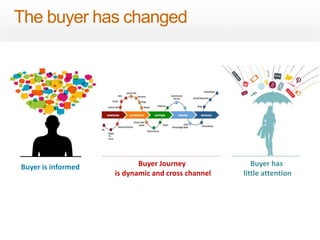
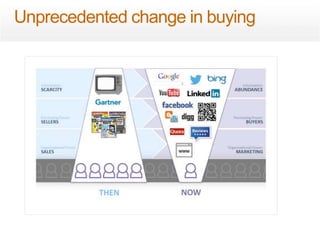
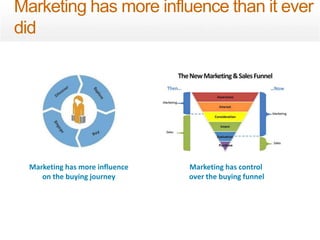
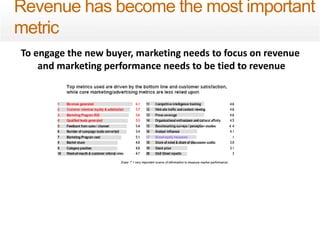
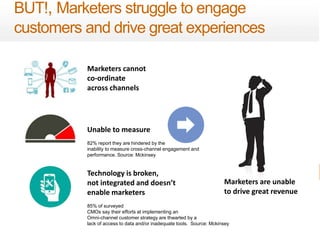
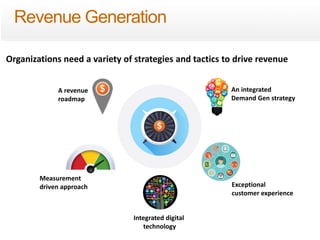
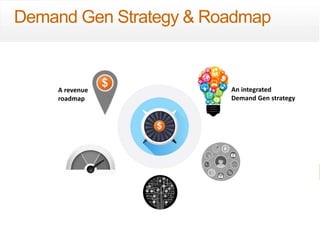
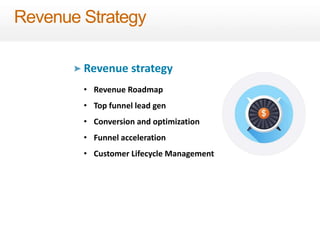
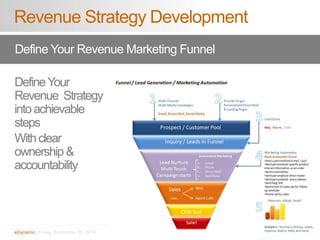
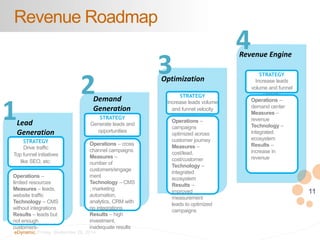
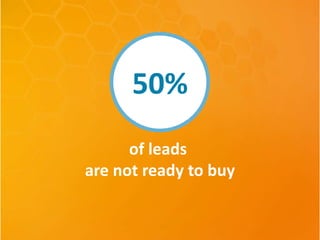
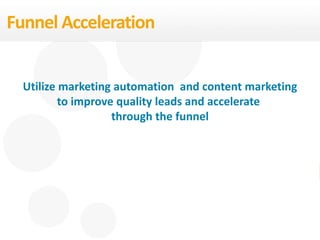
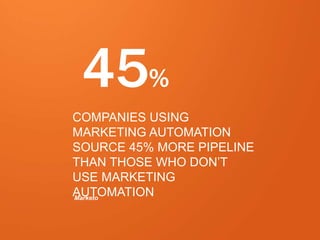
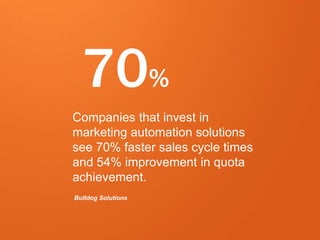
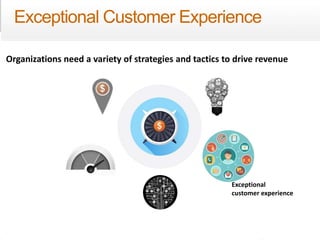
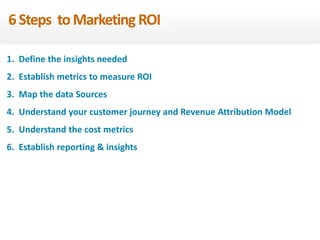
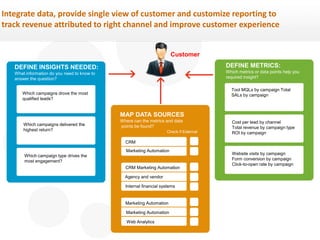
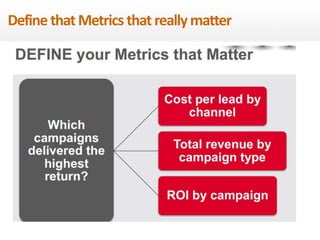
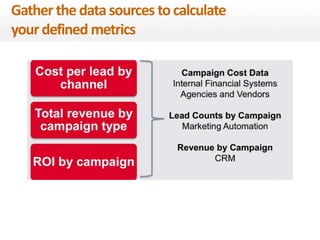
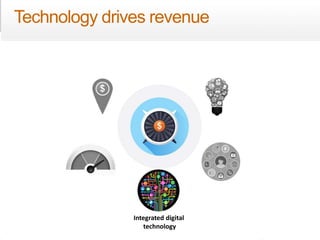
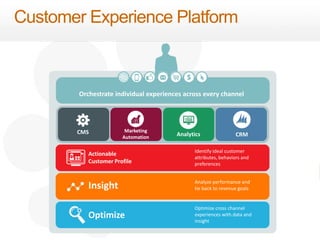
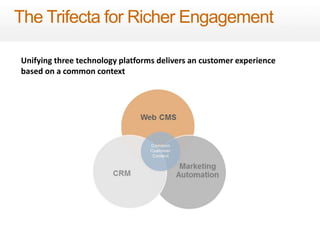
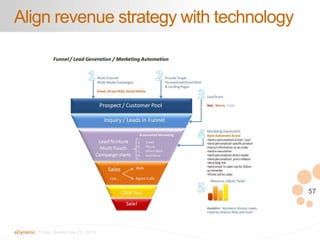
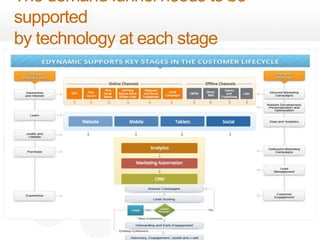
Turn your digital 
marketing 
programs into a 
Revenue 
Engine
Buyer is informed Buyer Journey 
is dynamic and cross channel 
Buyer has 
little attention 
The buyer has changed
Unprecedented change in buying
Marketing has more influence than it ever 
did 
Marketing has more influence 
on the buying journey 
Marketing has control 
over the buying funnel
Revenue has become the most important 
metric 
To engage the new buyer, marketing needs to focus on revenue 
and marketing performance needs to be tied to revenue
5 
BUT!, Marketers struggle to engage 
customers and drive great experiences 
Marketers cannot 
co-ordinate 
across channels 
Unable to measure 
82% report they are hindered by the 
inability to measure cross-channel engagement and 
performance. Source: Mckinsey 
Technology is broken, 
not integrated and doesn’t 
enable marketers 
85% of surveyed 
CMOs say their efforts at implementing an 
Omni-channel customer strategy are thwarted by a 
lack of access to data and/or inadequate tools. Source: Mckinsey 
eDynamic, Friday, September 26, 2014 
Marketers are unable 
to drive great revenue
Organizations need to re-align 
their marketing strategy, 
processes and technology 
to drive revenue
Organizations need a variety of strategies and tactics to drive revenue 
A revenue 
roadmap 
Measurement 
driven approach 
Integrated digital 
technology 
An integrated 
Demand Gen strategy 
Exceptional 
customer experience 
Revenue Generation
8 
Demand Gen Strategy & Roadmap 
eDynamic, Friday, September 26, 2014 
An integrated 
Demand Gen strategy 
A revenue 
roadmap
Revenue Strategy 
Revenue strategy 
• Revenue Roadmap 
• Top funnel lead gen 
• Conversion and optimization 
• Funnel acceleration 
• Customer Lifecycle Management
10 
Revenue Strategy Development 
Define Your Revenue Marketing Funnel 
Define Your 
Revenue Strategy 
into achievable 
steps 
With clear 
ownership & 
accountability 
eDynamic, Friday, September 26, 2014
11 
Revenue Roadmap 
Lead 
Generation 
STRATEGY 
Drive traffic 
Top funnel initiatives 
like SEO, etc. 
Demand 
Generation 
eDynamic, Friday, September 26, 2014 
STRATEGY 
Generate leads and 
opportunities 
Operations – cross 
channel campaigns 
Measures – number of 
customers/engagemen 
t 
Technology – CMS , 
marketing automation, 
analytics, CRM with no 
integrations 
Results – high 
investment, inadequate 
results 
Optimization 
STRATEGY 
Increase leads volume 
and funnel velocity 
Operations – 
campaigns optimized 
across customer 
journey 
Measures – 
cost/lead, 
cost/customer 
Technology – 
integrated ecosystem 
Results – improved 
measurement leads 
to optimized 
campaigns 
1 
2 
3 
4 
Revenue Engine 
STRATEGY 
Increase leads 
volume and funnel 
velocity 
Operations – 
demand center 
Measures – 
revenue 
Technology – 
integrated 
ecosystem 
Results – increase 
in revenue 
Operations – limited 
resources 
Measures – leads, 
website traffic 
Technology – CMS 
without integrations 
Results – leads but not 
enough customers-
Top Funnel 
Lead Gen
Top Funnel Strategies 
Persona Based Content Marketing 
Website Conversion 
Paid, Earned and Owned Media 
Advertising – Re-targeting
Top Funnel Strategies
Conversion 
and Optimization
Conversion and Optimization 
Personalized Communications 
Right Message 
Right Time 
Right Channel 
Right Device 
Website Optimization 
Marketing Channel Optimization 
Content Marketing
Contextual Engagement drives Conversion 
17 
• 82% of prospects say content targeted to 
their specific industry is more valuable 
• 67% say content targeted to their job 
function is more valuable 
*MarketingSherpa2012 
eDynamic, Friday, September 26, 2014
18 
Your Website with a Conversion 
Engine. 
Content + Strategy + Testing = Leads = Revenue 
eDynamic, Friday, September 26, 2014
19 
Call to action tips the prospects 
Call to action is key to 
driving conversion 
eDynamic, Friday, September 26, 2014 
•Merchandise your 
product 
•Create Scent 
•Simple and persuasive 
content 
•Obvious and Engaging 
call to action 
•Relevance, value and 
what happens next
Funnel 
Acceleration
50% 
of leads 
are not ready to buy
22 
Funnel Acceleration 
Utilize marketing automation and content marketing 
to improve quality leads and accelerate 
eDynamic, Friday, September 26, 2014 
through the funnel
23 
45% 
COMPANIES USING 
MARKETING AUTOMATION 
SOURCE 45% MORE PIPELINE 
THAN THOSE WHO DON’T 
USE MARKETING 
AUTOMATION 
Marketo 
eDynamic, Friday, September 26, 2014
24 
70% 
Companies that invest in 
marketing automation solutions 
see 70% faster sales cycle times 
and 54% improvement in quota 
achievement. 
Bulldog Solutions 
eDynamic, Friday, September 26, 2014
25 
70% 
70% OF BUYERS PURCHASE A 
MARKETING AUTOMATION 
SOFTWARE FOR BETTER 
REPORTING / MARKETING 
ANALYTICS 
Gleanster 
eDynamic, Friday, September 26, 2014
Customer 
Lifecycle Management
Customer Lifecycle Management 
Onboard customers 
Promote Usage & Adoption 
Continue to Educate & Train 
Target for cross sell and upsell 
Enable Account Management 
Loyalty and retention
28 
DDrriivveess RReevveennuuee 
eDynamic, Friday, September 26, 2014
29 
Understand your 
Buying Cycle 
eDynamic, Friday, September 26, 2014 
Segment 
your audience 
Map the 
Messages 
Implement 
the Platforms 
Target the buying lifecycle
30 
Best-in-Class Content : 
Use the website to convert the unknown to the known 
Focus on copy 
Adopt a problem-solution approach to copy 
Speak directly to the reader 
Concentrate on decision points 
Re-think Lead Gen forms/CTAs 
Un-gate some copy as a preview 
Add visual cues 
Focus the reader on your goals 
eDynamic, Friday, September 26, 2014
31 
Best-in-Class Content : 
Develop Thought Leadership 
Target content for specific audiences 
Repurpose existing material 
Add graphic elements 
Use tools and calendars to streamline production 
Promote on multiple channels (COPE) 
Focus on distribution 
Understand this is an iterative process; you get what you put in 
eDynamic, Friday, September 26, 2014
32 
Best-in-Class Content : 
Focus the reader on your goals 
eDynamic, Friday, September 26, 2014
33 
Best-in-Class Content : 
Structure content chunks, not blobs 
Content “blob” Content “blob” 
Unstructured 
Page (& print) specific 
Inflexible, monolithic 
Hard-coded & historically entrenched 
Action-averse 
eDynamic, Friday, September 26, 2014 
Structured 
Platform & channel agnostic 
Nimble, componentized 
Optimized & future friendly 
Action-oriented
34 
Best-in-Class Content : 
COPE (Create once, publish everywhere) 
eDynamic, Friday, September 26, 2014
35 
Exceptional Customer Experience 
Organizations need a variety of strategies and tactics to drive revenue 
eDynamic, Friday, September 26, 2014 
Exceptional 
customer experience
36 
Why Customer Experience Matters to Revenue 
Generation 
eDynamic, Friday, September 26, 2014 
36 
• 2X customer retention 
- Aberdeen Group 
• 89% retention for 
companies with 
strongest omni-channel 
strategies 
-Aberdeen Group 
• By 2020 customer 
experience > price & 
product 
- Customers 2020 
Report 
Source: Watermark Consulting
94% 
of customers have 
discontinued communication 
with a company because of 
irrelevant messages. 
Blue Research
38 
Customer experience matters 
eDynamic, Friday, September 26, 2014 
Source: Oracle
39 
Understand your customer 
eDynamic, Friday, September 26, 2014
40 
CUSTOMER JOURNEY MAP 
eDynamic, Friday, September 26, 2014
41 
Target the buying lifecycle 
Understand your 
Buying Cycle 
eDynamic, Friday, September 26, 2014 
Segment 
your audience 
Map the 
Messages 
Implement 
the Platforms
Relevant, personalized communication across all 
channels drives revenue 
87%OF TOP-PERFORMING MARKETERS SAY TARGETING CAMPAIGNS TO 
AUDIENCE SEGMENTS IS THE LARGEST VALUE DRIVER, WITH 78% 
LISTING SEGMENTATION AS THE #1 MARKETING-AUTOMATION 
CAPABILITY THEY CAN’T LIVE WITHOUT. 
Cross channel, 
multi device 
Gleanster 
Personalized to a 
customer journey
43 
Revenue Analytics 
Measurement 
driven approach 
eDynamic, Friday, September 26, 2014
77% 
Marketers indicated 
improvement in revenue 
by gathering customer 
intelligence. 
Forrester Customer Intelligence Survey
45 
Use analytics to perform financially better and execute 
decisions faster 
Research: http://www.bain.com/publications/articles/big_data_the_organizational_challenge.aspx 
eDynamic, Friday, September 26, 2014
Challenges to calculating marketing ROI 
• Closing the loop - getting ROI reporting 
• Reporting across the entire funnel 
• Understanding how marketing influences pipeline and closed deals 
• Lack of integration 
• Lack of a clear path on which reports demonstrate "success". This may 
be due to lack of focus on defining metrics
6 Steps to Marketing ROI 
1. Define the insights needed 
2. Establish metrics to measure ROI 
3. Map the data Sources 
4. Understand your customer journey and Revenue Attribution Model 
5. Understand the cost metrics 
6. Establish reporting & insights
Integrate data, provide single view of customer and customize reporting to 
track revenue attributed to right channel and improve customer experience 
DEFINE INSIGHTS NEEDED: 
What information do you need to know to 
answer the question? 
Which campaigns drove the most 
qualified leads? 
Which campaigns delivered the 
highest return? 
Which campaign type drives the 
most engagement? 
DEFINE METRICS: 
Which metrics or data points help you 
required insight? 
Tool MQLs by campaign Total 
SALs by campaign 
Cost per lead by channel 
Total revenue by campaign type 
ROI by campaign 
Website visits by campaign 
Form conversion by campaign 
Click-to-open rate by campaign 
Customer 
MAP DATA SOURCES 
Where can the metrics and data 
points be found? 
Check if External 
CRM 
Marketing Automation 
CRM Marketing Automation 
Agency and vendor 
Internal financial systems 
Marketing Automation 
Web Analytics
Define that Metrics that really matter
Gather the data sources to calculate 
your defined metrics
51 
Key measures and alignment 
eDynamic, Friday, September 26, 2014 
Define a Common 
Definition of a Lead
Attribution model is the rule, or set of rules, that determines how credit 
for conversions is assigned to a channel during customer journey 
1. Last Interaction attribution model, the last touchpoint 
would receive 100% of credit for the sale. 
2. First Interaction attribution model, the first touchpoint 
would receive 100% of credit for the sale. 
3. Linear attribution model, each touchpoint in the 
conversion path would share equal credit (25% each) for 
the sale. 
4. Time Decay attribution model, the touchpoints closest 
in time to the sale get most of the credit.
53 
Technology drives revenue 
eDynamic, Friday, September 26, 2014 
Integrated digital 
technology
54 
The Revenue Engine Elements 
How Prepared Are You ? 
eDynamic, Friday, September 26, 2014 
Technologies impact on revenue 
Key Marketing Revenue Engine 
Components include a holistic 
integration of the following;
55 
Customer Experience Platform 
Orchestrate individual experiences across every channel 
CMS Marketing 
eDynamic, Friday, September 26, 2014 
Automation Analytics 
Actionable 
Customer Profile 
Insight 
Optimize 
CRM 
Identify ideal customer 
attributes, behaviors and 
preferences 
Analyze performance and 
tie back to revenue goals 
Optimize cross channel 
experiences with data and 
insight
The Trifecta for Richer Engagement 
Unifying three technology platforms delivers an customer experience 
based on a common context
57 
Align revenue strategy with technology 
eDynamic, Friday, September 26, 2014
The demand funnel needs to be supported by 
technology at each stage
59 
Connect with us 
www.edynamic.net 
contact@edynamic.net 
1-877-339-6264 
eDynamic, Friday, September 26, 2014 
twitter.com/edynamic 
youtube.com/1999dynamic 
facebook.com/edynamic.net

Revenue Engine for Marketers

  • 1.
    Turn your digital marketing programs into a Revenue Engine
  • 2.
    Buyer is informedBuyer Journey is dynamic and cross channel Buyer has little attention The buyer has changed
  • 3.
  • 4.
    Marketing has moreinfluence than it ever did Marketing has more influence on the buying journey Marketing has control over the buying funnel
  • 5.
    Revenue has becomethe most important metric To engage the new buyer, marketing needs to focus on revenue and marketing performance needs to be tied to revenue
  • 6.
    5 BUT!, Marketersstruggle to engage customers and drive great experiences Marketers cannot co-ordinate across channels Unable to measure 82% report they are hindered by the inability to measure cross-channel engagement and performance. Source: Mckinsey Technology is broken, not integrated and doesn’t enable marketers 85% of surveyed CMOs say their efforts at implementing an Omni-channel customer strategy are thwarted by a lack of access to data and/or inadequate tools. Source: Mckinsey eDynamic, Friday, September 26, 2014 Marketers are unable to drive great revenue
  • 7.
    Organizations need tore-align their marketing strategy, processes and technology to drive revenue
  • 8.
    Organizations need avariety of strategies and tactics to drive revenue A revenue roadmap Measurement driven approach Integrated digital technology An integrated Demand Gen strategy Exceptional customer experience Revenue Generation
  • 9.
    8 Demand GenStrategy & Roadmap eDynamic, Friday, September 26, 2014 An integrated Demand Gen strategy A revenue roadmap
  • 10.
    Revenue Strategy Revenuestrategy • Revenue Roadmap • Top funnel lead gen • Conversion and optimization • Funnel acceleration • Customer Lifecycle Management
  • 11.
    10 Revenue StrategyDevelopment Define Your Revenue Marketing Funnel Define Your Revenue Strategy into achievable steps With clear ownership & accountability eDynamic, Friday, September 26, 2014
  • 12.
    11 Revenue Roadmap Lead Generation STRATEGY Drive traffic Top funnel initiatives like SEO, etc. Demand Generation eDynamic, Friday, September 26, 2014 STRATEGY Generate leads and opportunities Operations – cross channel campaigns Measures – number of customers/engagemen t Technology – CMS , marketing automation, analytics, CRM with no integrations Results – high investment, inadequate results Optimization STRATEGY Increase leads volume and funnel velocity Operations – campaigns optimized across customer journey Measures – cost/lead, cost/customer Technology – integrated ecosystem Results – improved measurement leads to optimized campaigns 1 2 3 4 Revenue Engine STRATEGY Increase leads volume and funnel velocity Operations – demand center Measures – revenue Technology – integrated ecosystem Results – increase in revenue Operations – limited resources Measures – leads, website traffic Technology – CMS without integrations Results – leads but not enough customers-
  • 13.
  • 14.
    Top Funnel Strategies Persona Based Content Marketing Website Conversion Paid, Earned and Owned Media Advertising – Re-targeting
  • 15.
  • 16.
  • 17.
    Conversion and Optimization Personalized Communications Right Message Right Time Right Channel Right Device Website Optimization Marketing Channel Optimization Content Marketing
  • 18.
    Contextual Engagement drivesConversion 17 • 82% of prospects say content targeted to their specific industry is more valuable • 67% say content targeted to their job function is more valuable *MarketingSherpa2012 eDynamic, Friday, September 26, 2014
  • 19.
    18 Your Websitewith a Conversion Engine. Content + Strategy + Testing = Leads = Revenue eDynamic, Friday, September 26, 2014
  • 20.
    19 Call toaction tips the prospects Call to action is key to driving conversion eDynamic, Friday, September 26, 2014 •Merchandise your product •Create Scent •Simple and persuasive content •Obvious and Engaging call to action •Relevance, value and what happens next
  • 21.
  • 22.
    50% of leads are not ready to buy
  • 23.
    22 Funnel Acceleration Utilize marketing automation and content marketing to improve quality leads and accelerate eDynamic, Friday, September 26, 2014 through the funnel
  • 24.
    23 45% COMPANIESUSING MARKETING AUTOMATION SOURCE 45% MORE PIPELINE THAN THOSE WHO DON’T USE MARKETING AUTOMATION Marketo eDynamic, Friday, September 26, 2014
  • 25.
    24 70% Companiesthat invest in marketing automation solutions see 70% faster sales cycle times and 54% improvement in quota achievement. Bulldog Solutions eDynamic, Friday, September 26, 2014
  • 26.
    25 70% 70%OF BUYERS PURCHASE A MARKETING AUTOMATION SOFTWARE FOR BETTER REPORTING / MARKETING ANALYTICS Gleanster eDynamic, Friday, September 26, 2014
  • 27.
  • 28.
    Customer Lifecycle Management Onboard customers Promote Usage & Adoption Continue to Educate & Train Target for cross sell and upsell Enable Account Management Loyalty and retention
  • 29.
    28 DDrriivveess RReevveennuuee eDynamic, Friday, September 26, 2014
  • 30.
    29 Understand your Buying Cycle eDynamic, Friday, September 26, 2014 Segment your audience Map the Messages Implement the Platforms Target the buying lifecycle
  • 31.
    30 Best-in-Class Content: Use the website to convert the unknown to the known Focus on copy Adopt a problem-solution approach to copy Speak directly to the reader Concentrate on decision points Re-think Lead Gen forms/CTAs Un-gate some copy as a preview Add visual cues Focus the reader on your goals eDynamic, Friday, September 26, 2014
  • 32.
    31 Best-in-Class Content: Develop Thought Leadership Target content for specific audiences Repurpose existing material Add graphic elements Use tools and calendars to streamline production Promote on multiple channels (COPE) Focus on distribution Understand this is an iterative process; you get what you put in eDynamic, Friday, September 26, 2014
  • 33.
    32 Best-in-Class Content: Focus the reader on your goals eDynamic, Friday, September 26, 2014
  • 34.
    33 Best-in-Class Content: Structure content chunks, not blobs Content “blob” Content “blob” Unstructured Page (& print) specific Inflexible, monolithic Hard-coded & historically entrenched Action-averse eDynamic, Friday, September 26, 2014 Structured Platform & channel agnostic Nimble, componentized Optimized & future friendly Action-oriented
  • 35.
    34 Best-in-Class Content: COPE (Create once, publish everywhere) eDynamic, Friday, September 26, 2014
  • 36.
    35 Exceptional CustomerExperience Organizations need a variety of strategies and tactics to drive revenue eDynamic, Friday, September 26, 2014 Exceptional customer experience
  • 37.
    36 Why CustomerExperience Matters to Revenue Generation eDynamic, Friday, September 26, 2014 36 • 2X customer retention - Aberdeen Group • 89% retention for companies with strongest omni-channel strategies -Aberdeen Group • By 2020 customer experience > price & product - Customers 2020 Report Source: Watermark Consulting
  • 38.
    94% of customershave discontinued communication with a company because of irrelevant messages. Blue Research
  • 39.
    38 Customer experiencematters eDynamic, Friday, September 26, 2014 Source: Oracle
  • 40.
    39 Understand yourcustomer eDynamic, Friday, September 26, 2014
  • 41.
    40 CUSTOMER JOURNEYMAP eDynamic, Friday, September 26, 2014
  • 42.
    41 Target thebuying lifecycle Understand your Buying Cycle eDynamic, Friday, September 26, 2014 Segment your audience Map the Messages Implement the Platforms
  • 43.
    Relevant, personalized communicationacross all channels drives revenue 87%OF TOP-PERFORMING MARKETERS SAY TARGETING CAMPAIGNS TO AUDIENCE SEGMENTS IS THE LARGEST VALUE DRIVER, WITH 78% LISTING SEGMENTATION AS THE #1 MARKETING-AUTOMATION CAPABILITY THEY CAN’T LIVE WITHOUT. Cross channel, multi device Gleanster Personalized to a customer journey
  • 44.
    43 Revenue Analytics Measurement driven approach eDynamic, Friday, September 26, 2014
  • 45.
    77% Marketers indicated improvement in revenue by gathering customer intelligence. Forrester Customer Intelligence Survey
  • 46.
    45 Use analyticsto perform financially better and execute decisions faster Research: http://www.bain.com/publications/articles/big_data_the_organizational_challenge.aspx eDynamic, Friday, September 26, 2014
  • 47.
    Challenges to calculatingmarketing ROI • Closing the loop - getting ROI reporting • Reporting across the entire funnel • Understanding how marketing influences pipeline and closed deals • Lack of integration • Lack of a clear path on which reports demonstrate "success". This may be due to lack of focus on defining metrics
  • 48.
    6 Steps toMarketing ROI 1. Define the insights needed 2. Establish metrics to measure ROI 3. Map the data Sources 4. Understand your customer journey and Revenue Attribution Model 5. Understand the cost metrics 6. Establish reporting & insights
  • 49.
    Integrate data, providesingle view of customer and customize reporting to track revenue attributed to right channel and improve customer experience DEFINE INSIGHTS NEEDED: What information do you need to know to answer the question? Which campaigns drove the most qualified leads? Which campaigns delivered the highest return? Which campaign type drives the most engagement? DEFINE METRICS: Which metrics or data points help you required insight? Tool MQLs by campaign Total SALs by campaign Cost per lead by channel Total revenue by campaign type ROI by campaign Website visits by campaign Form conversion by campaign Click-to-open rate by campaign Customer MAP DATA SOURCES Where can the metrics and data points be found? Check if External CRM Marketing Automation CRM Marketing Automation Agency and vendor Internal financial systems Marketing Automation Marketing Automation Web Analytics
  • 50.
    Define that Metricsthat really matter
  • 51.
    Gather the datasources to calculate your defined metrics
  • 52.
    51 Key measuresand alignment eDynamic, Friday, September 26, 2014 Define a Common Definition of a Lead
  • 53.
    Attribution model isthe rule, or set of rules, that determines how credit for conversions is assigned to a channel during customer journey 1. Last Interaction attribution model, the last touchpoint would receive 100% of credit for the sale. 2. First Interaction attribution model, the first touchpoint would receive 100% of credit for the sale. 3. Linear attribution model, each touchpoint in the conversion path would share equal credit (25% each) for the sale. 4. Time Decay attribution model, the touchpoints closest in time to the sale get most of the credit.
  • 54.
    53 Technology drivesrevenue eDynamic, Friday, September 26, 2014 Integrated digital technology
  • 55.
    54 The RevenueEngine Elements How Prepared Are You ? eDynamic, Friday, September 26, 2014 Technologies impact on revenue Key Marketing Revenue Engine Components include a holistic integration of the following;
  • 56.
    55 Customer ExperiencePlatform Orchestrate individual experiences across every channel CMS Marketing eDynamic, Friday, September 26, 2014 Automation Analytics Actionable Customer Profile Insight Optimize CRM Identify ideal customer attributes, behaviors and preferences Analyze performance and tie back to revenue goals Optimize cross channel experiences with data and insight
  • 57.
    The Trifecta forRicher Engagement Unifying three technology platforms delivers an customer experience based on a common context
  • 58.
    57 Align revenuestrategy with technology eDynamic, Friday, September 26, 2014
  • 59.
    The demand funnelneeds to be supported by technology at each stage
  • 60.
    59 Connect withus www.edynamic.net contact@edynamic.net 1-877-339-6264 eDynamic, Friday, September 26, 2014 twitter.com/edynamic youtube.com/1999dynamic facebook.com/edynamic.net

Editor's Notes

  • #3 The buyer has changed. The buyer is more informed The new buyer has many options The buyer has Little attention. There is so much information available and being sent to buyers, that attention is scarce. Design: Image of a buyer with many options? Three icons – One a buyer who is more informed second journey is dynamic and third buyer has little atention. Who has many options one that has very little attention. Sample images above.
  • #4 The buyer has changed. The buyer is more informed The new buyer has many options The buyer has Little attention. There is so much information available and being sent to buyers, that attention is scarce. Design: Image of a buyer with many options? Three icons – One a buyer who is more informed second journey is dynamic and third buyer has little atention. Who has many options one that has very little attention. Sample images above.
  • #5 The buyer has changed. The buyer is more informed The new buyer has many options The buyer has Little attention. There is so much information available and being sent to buyers, that attention is scarce. Design: Image of a buyer with many options? Three icons – One a buyer who is more informed second journey is dynamic and third buyer has little atention. Who has many options one that has very little attention. Sample images above.
  • #6 The buyer has changed. The buyer is more informed The new buyer has many options The buyer has Little attention. There is so much information available and being sent to buyers, that attention is scarce. Design: Image of a buyer with many options? Three icons – One a buyer who is more informed second journey is dynamic and third buyer has little atention. Who has many options one that has very little attention. Sample images above.
  • #7 However CX in most organizations is broken Marketers cant coordinate across channels. They are unable to measure experience as data, content and technology is siloed. Technology is broken.
  • #8 Design -
  • #9 The buyer has changed. The buyer is more informed The new buyer has many options The buyer has Little attention. There is so much information available and being sent to buyers, that attention is scarce. Design: Image of a buyer with many options? Three icons – One a buyer who is more informed second journey is dynamic and third buyer has little atention. Who has many options one that has very little attention. Sample images above.
  • #10 The buyer has changed. The buyer is more informed The new buyer has many options The buyer has Little attention. There is so much information available and being sent to buyers, that attention is scarce. Design: Image of a buyer with many options? Three icons – One a buyer who is more informed second journey is dynamic and third buyer has little atention. Who has many options one that has very little attention. Sample images above.
  • #11 The buyer has changed. The buyer is more informed The new buyer has many options The buyer has Little attention. There is so much information available and being sent to buyers, that attention is scarce. Design: Image of a buyer with many options? Three icons – One a buyer who is more informed second journey is dynamic and third buyer has little atention. Who has many options one that has very little attention. Sample images above.
  • #13 The buyer has changed. The buyer is more informed The new buyer has many options The buyer has Little attention. There is so much information available and being sent to buyers, that attention is scarce. Design: Image of a buyer with many options? Three icons – One a buyer who is more informed second journey is dynamic and third buyer has little atention. Who has many options one that has very little attention. Sample images above.
  • #15 The buyer has changed. The buyer is more informed The new buyer has many options The buyer has Little attention. There is so much information available and being sent to buyers, that attention is scarce. Design: Image of a buyer with many options? Three icons – One a buyer who is more informed second journey is dynamic and third buyer has little atention. Who has many options one that has very little attention. Sample images above.
  • #16 The buyer has changed. The buyer is more informed The new buyer has many options The buyer has Little attention. There is so much information available and being sent to buyers, that attention is scarce. Design: Image of a buyer with many options? Three icons – One a buyer who is more informed second journey is dynamic and third buyer has little atention. Who has many options one that has very little attention. Sample images above.
  • #18 The buyer has changed. The buyer is more informed The new buyer has many options The buyer has Little attention. There is so much information available and being sent to buyers, that attention is scarce. Design: Image of a buyer with many options? Three icons – One a buyer who is more informed second journey is dynamic and third buyer has little atention. Who has many options one that has very little attention. Sample images above.
  • #20 Let’s you know what your site can do (and tell you how much money you are leaving on the table) – Your site may be working ok – how do you know? The only place you can measurably change your revenue/move the demand curve in a concrete way, using the assets you already have.
  • #24 The buyer has changed. The buyer is more informed The new buyer has many options The buyer has Little attention. There is so much information available and being sent to buyers, that attention is scarce. Design: Image of a buyer with many options? Three icons – One a buyer who is more informed second journey is dynamic and third buyer has little atention. Who has many options one that has very little attention. Sample images above.
  • #29 The buyer has changed. The buyer is more informed The new buyer has many options The buyer has Little attention. There is so much information available and being sent to buyers, that attention is scarce. Design: Image of a buyer with many options? Three icons – One a buyer who is more informed second journey is dynamic and third buyer has little atention. Who has many options one that has very little attention. Sample images above.
  • #31 The buyer has changed. The buyer is more informed The new buyer has many options The buyer has Little attention. There is so much information available and being sent to buyers, that attention is scarce. Design: Image of a buyer with many options? Three icons – One a buyer who is more informed second journey is dynamic and third buyer has little atention. Who has many options one that has very little attention. Sample images above.
  • #32 The buyer has changed. The buyer is more informed The new buyer has many options The buyer has Little attention. There is so much information available and being sent to buyers, that attention is scarce. Design: Image of a buyer with many options? Three icons – One a buyer who is more informed second journey is dynamic and third buyer has little atention. Who has many options one that has very little attention. Sample images above.
  • #33 The buyer has changed. The buyer is more informed The new buyer has many options The buyer has Little attention. There is so much information available and being sent to buyers, that attention is scarce. Design: Image of a buyer with many options? Three icons – One a buyer who is more informed second journey is dynamic and third buyer has little atention. Who has many options one that has very little attention. Sample images above.
  • #34 The buyer has changed. The buyer is more informed The new buyer has many options The buyer has Little attention. There is so much information available and being sent to buyers, that attention is scarce. Design: Image of a buyer with many options? Three icons – One a buyer who is more informed second journey is dynamic and third buyer has little atention. Who has many options one that has very little attention. Sample images above.
  • #35 The buyer has changed. The buyer is more informed The new buyer has many options The buyer has Little attention. There is so much information available and being sent to buyers, that attention is scarce. Design: Image of a buyer with many options? Three icons – One a buyer who is more informed second journey is dynamic and third buyer has little atention. Who has many options one that has very little attention. Sample images above.
  • #36 The buyer has changed. The buyer is more informed The new buyer has many options The buyer has Little attention. There is so much information available and being sent to buyers, that attention is scarce. Design: Image of a buyer with many options? Three icons – One a buyer who is more informed second journey is dynamic and third buyer has little atention. Who has many options one that has very little attention. Sample images above.
  • #37 The buyer has changed. The buyer is more informed The new buyer has many options The buyer has Little attention. There is so much information available and being sent to buyers, that attention is scarce. Design: Image of a buyer with many options? Three icons – One a buyer who is more informed second journey is dynamic and third buyer has little atention. Who has many options one that has very little attention. Sample images above.
  • #38 And customer experience matters: leaders in delivering customer experience show consistently better performance than those that don’t. This makes intuitive sense: treat customers well, and they’ll stay your customers. Here are some facts: Look at the stock performance of Forrester’s Customer Experience Index leaders versus Laggards – which bucket do you want to be in? [CLICK]
  • #43 The buyer has changed. The buyer is more informed The new buyer has many options The buyer has Little attention. There is so much information available and being sent to buyers, that attention is scarce. Design: Image of a buyer with many options? Three icons – One a buyer who is more informed second journey is dynamic and third buyer has little atention. Who has many options one that has very little attention. Sample images above.
  • #44 The buyer has changed. The buyer is more informed The new buyer has many options The buyer has Little attention. There is so much information available and being sent to buyers, that attention is scarce. Design: Image of a buyer with many options? Three icons – One a buyer who is more informed second journey is dynamic and third buyer has little atention. Who has many options one that has very little attention. Sample images above.
  • #45 The buyer has changed. The buyer is more informed The new buyer has many options The buyer has Little attention. There is so much information available and being sent to buyers, that attention is scarce. Design: Image of a buyer with many options? Three icons – One a buyer who is more informed second journey is dynamic and third buyer has little atention. Who has many options one that has very little attention. Sample images above.
  • #55 The buyer has changed. The buyer is more informed The new buyer has many options The buyer has Little attention. There is so much information available and being sent to buyers, that attention is scarce. Design: Image of a buyer with many options? Three icons – One a buyer who is more informed second journey is dynamic and third buyer has little atention. Who has many options one that has very little attention. Sample images above.
  • #57 Edits: Add CRM next to Analytics We provide our clients the ability to orchestrate experiences across every touch-point. In a coordinated manner. We integrate your technology so that you can consistently and relevantly delivery experiences. We create a central profile of the customer that captures data from every touchpoint – website, mobile, social, email, customer portals and offline data such as events. With this rich profile you can engage with customers like never before. We provide analytics insight through reports and dashboarding to ensure that your marketing capaigns deliver performance Finally we provide you tools to optimize experience.
  • #58 The buyer has changed. The buyer is more informed The new buyer has many options The buyer has Little attention. There is so much information available and being sent to buyers, that attention is scarce. Design: Image of a buyer with many options? Three icons – One a buyer who is more informed second journey is dynamic and third buyer has little atention. Who has many options one that has very little attention. Sample images above.
  • #60 The buyer has changed. The buyer is more informed The new buyer has many options The buyer has Little attention. There is so much information available and being sent to buyers, that attention is scarce. Design: Image of a buyer with many options? Three icons – One a buyer who is more informed second journey is dynamic and third buyer has little atention. Who has many options one that has very little attention. Sample images above.