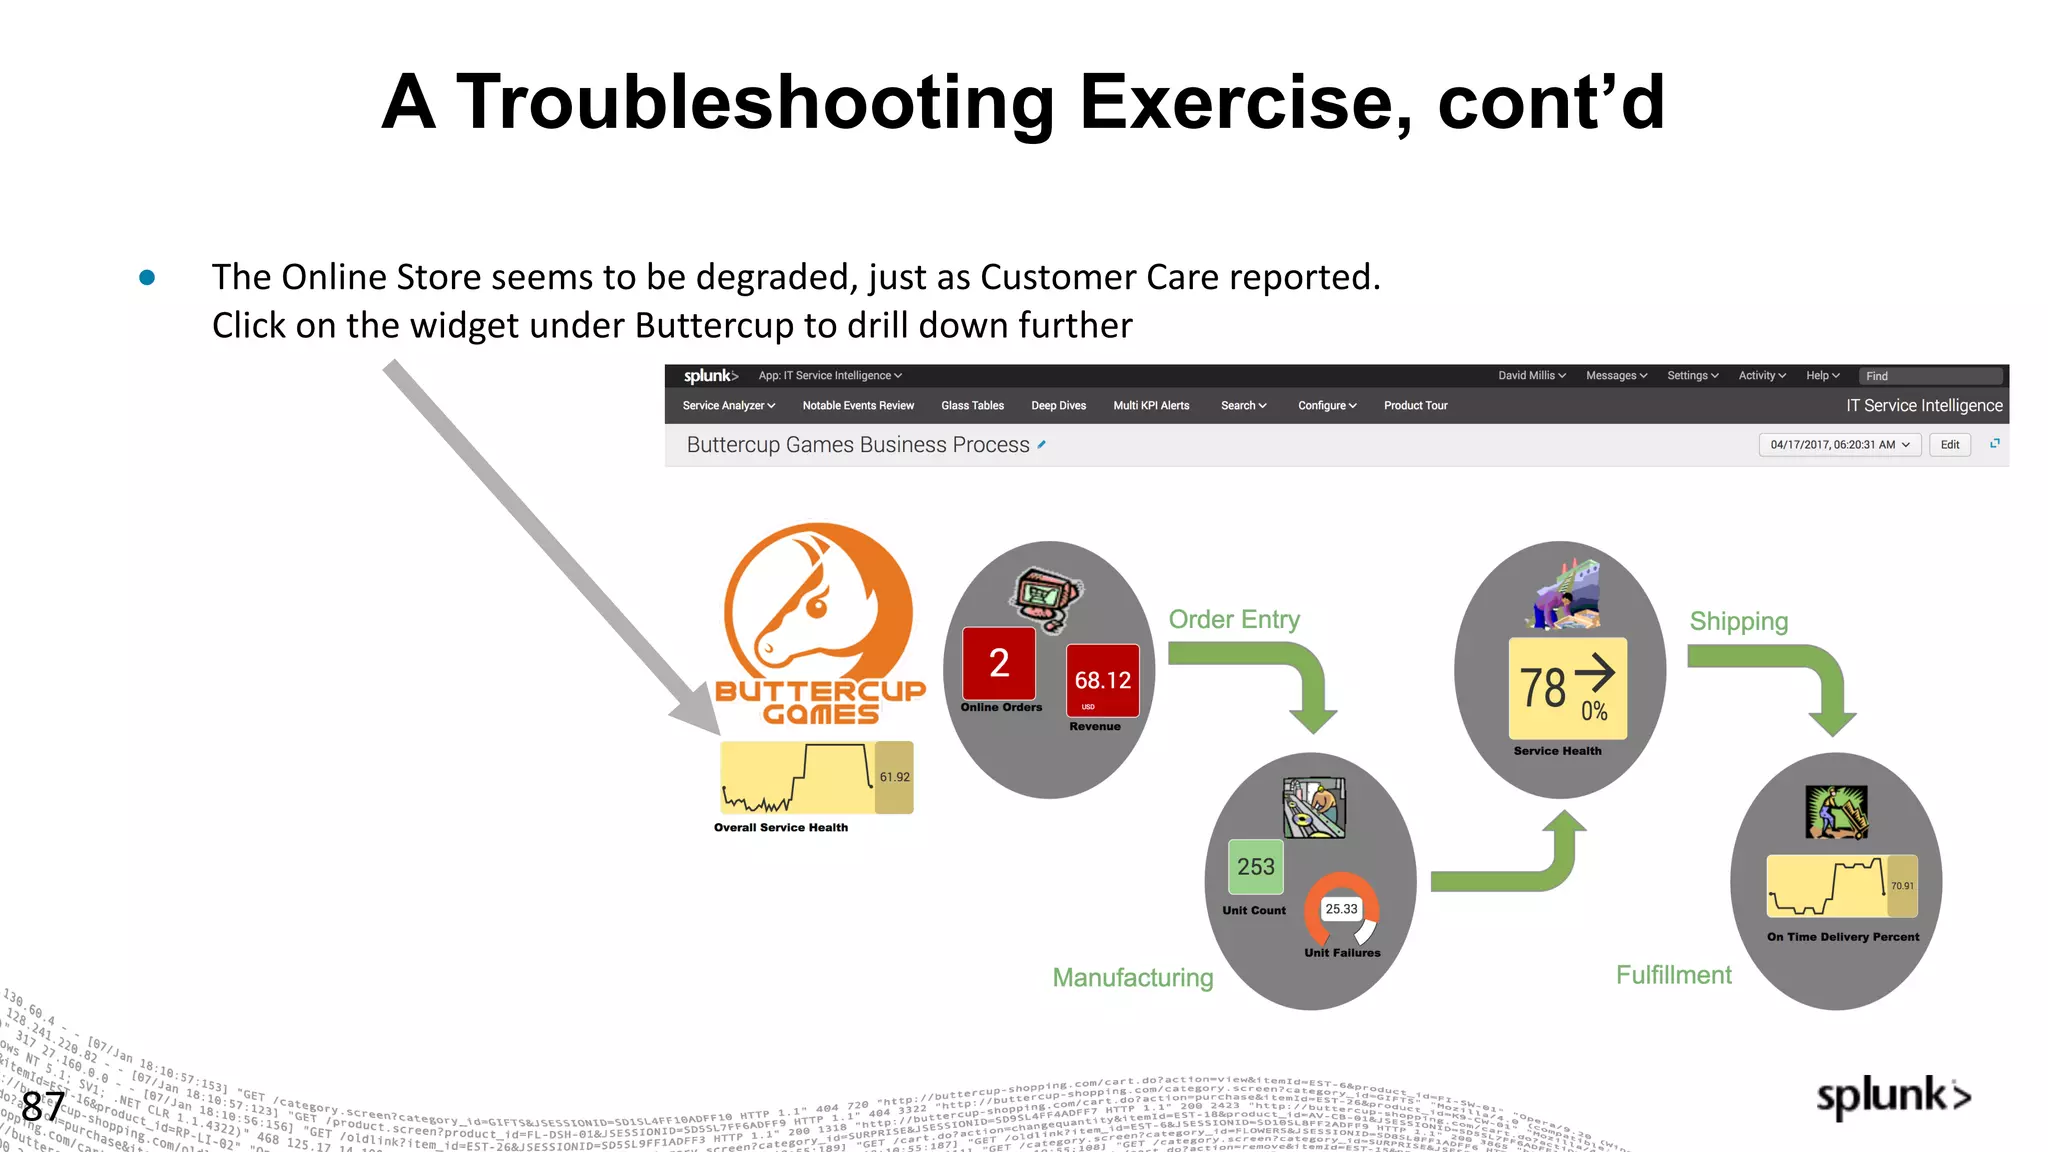
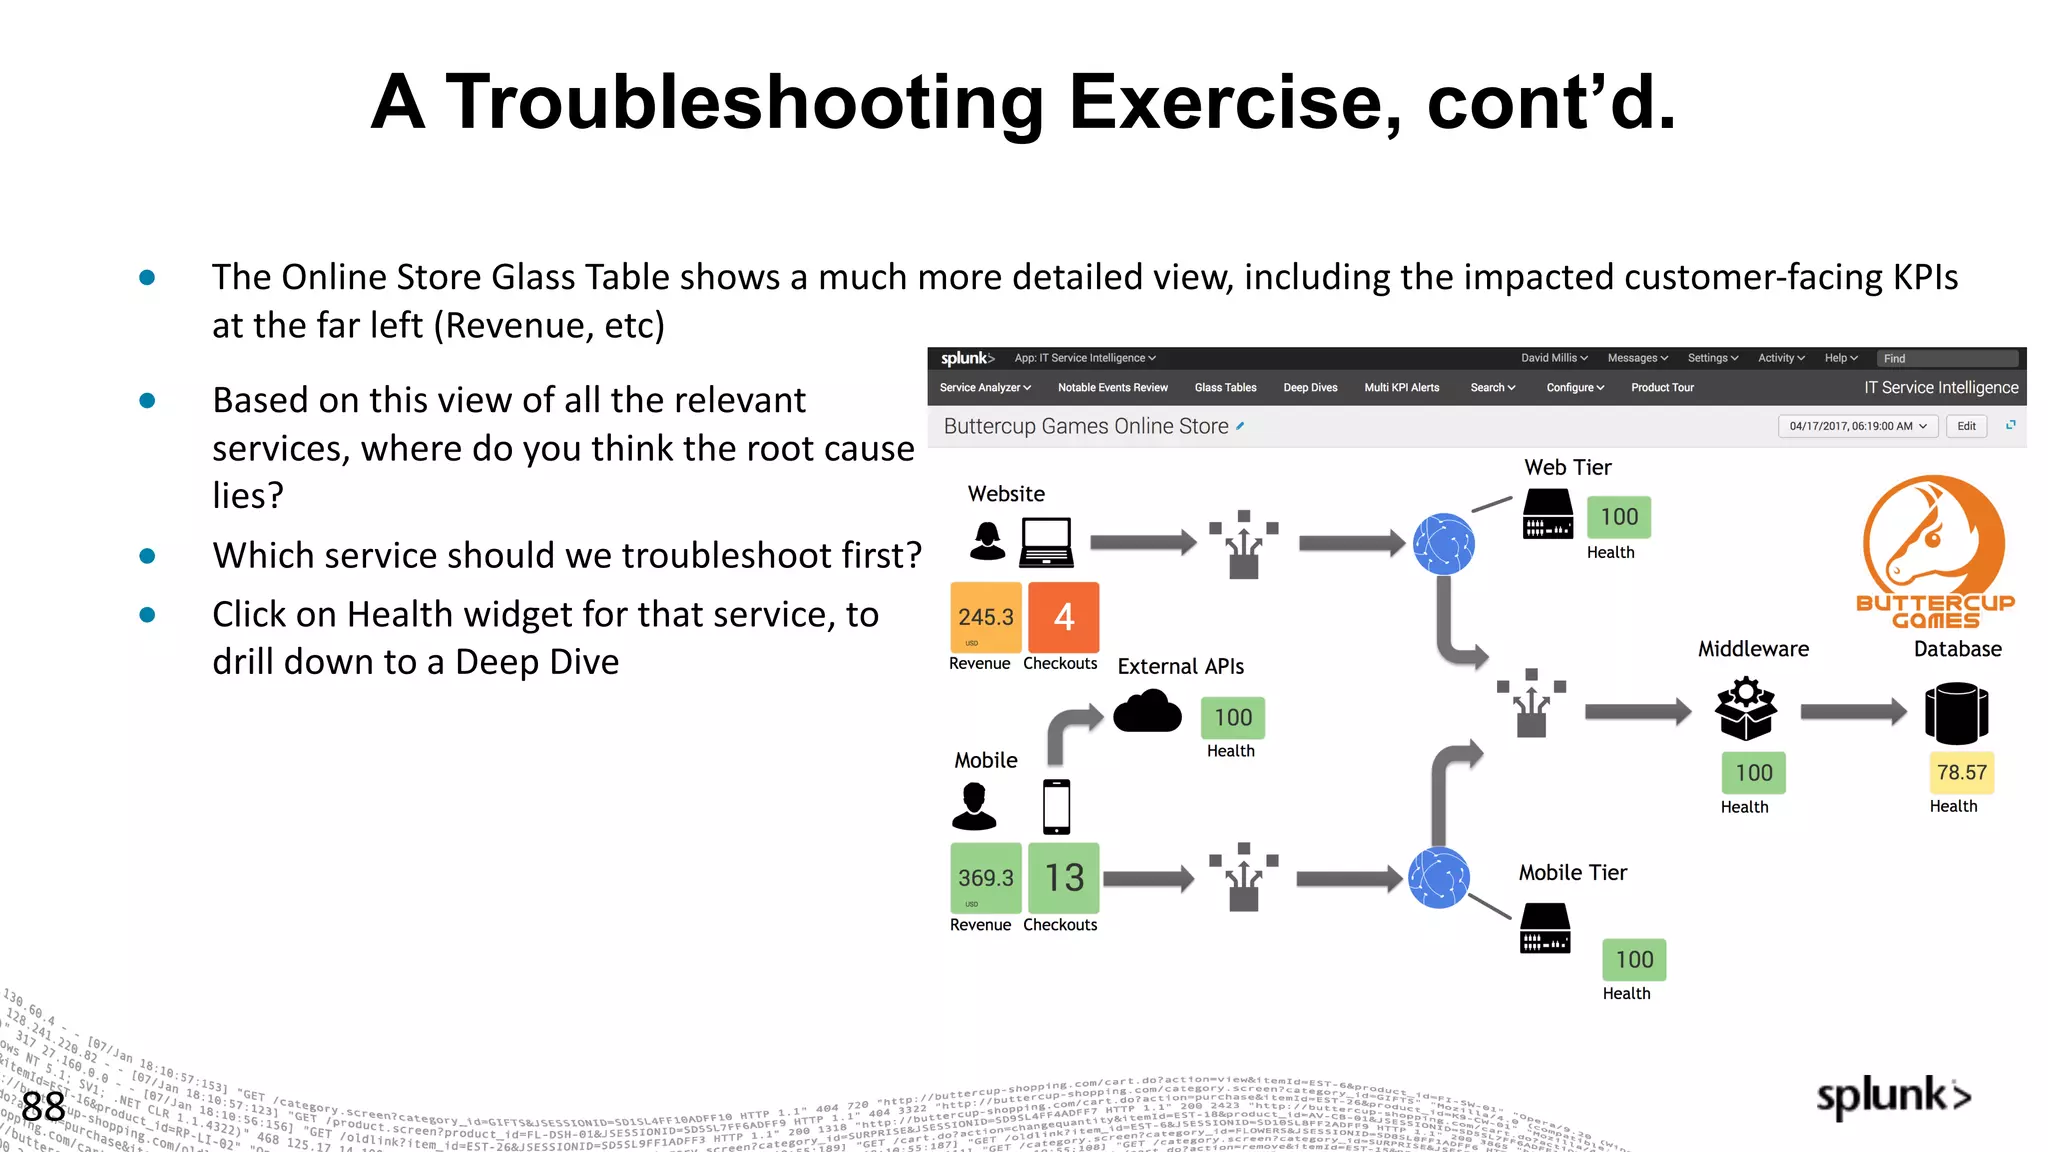
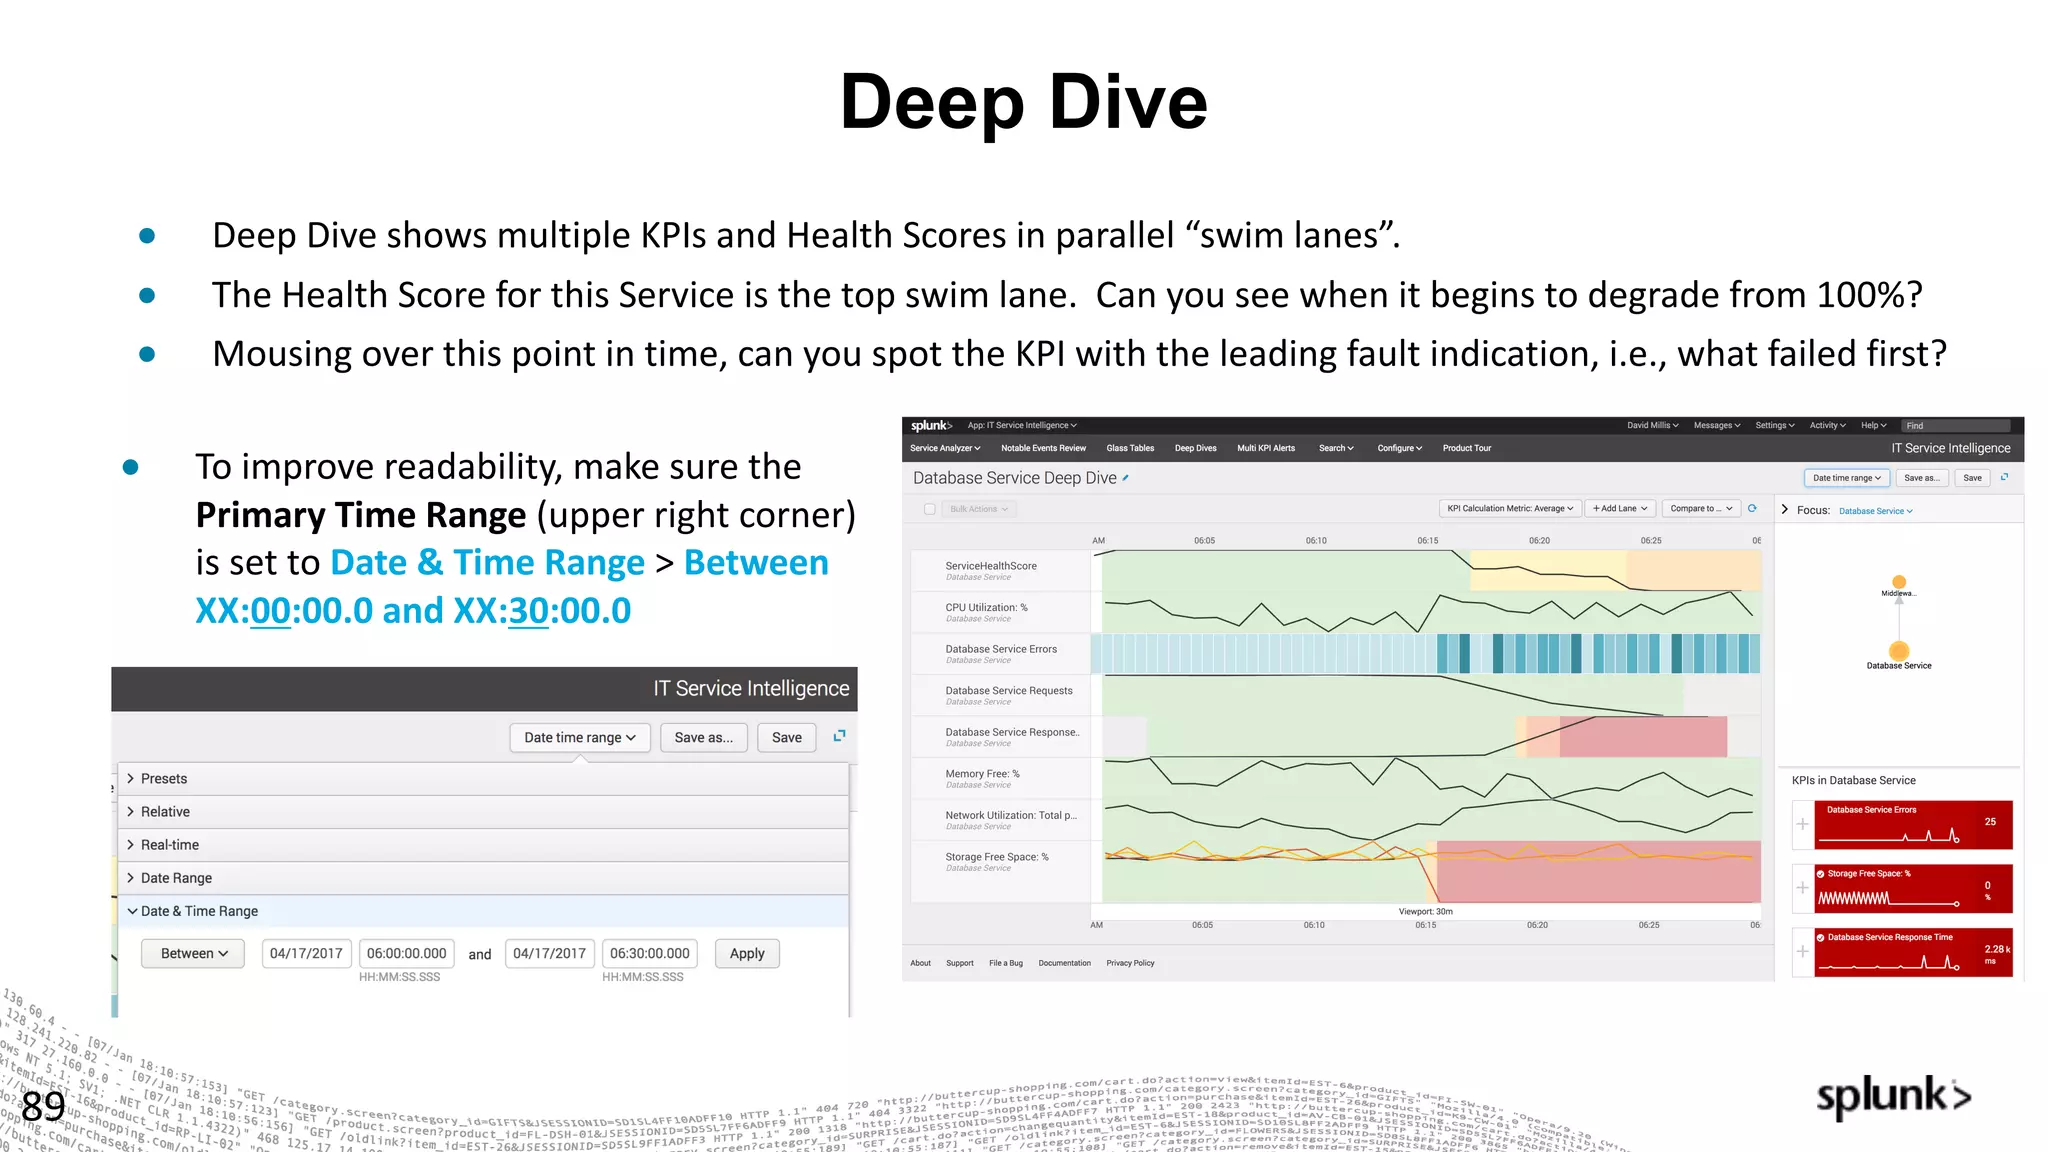
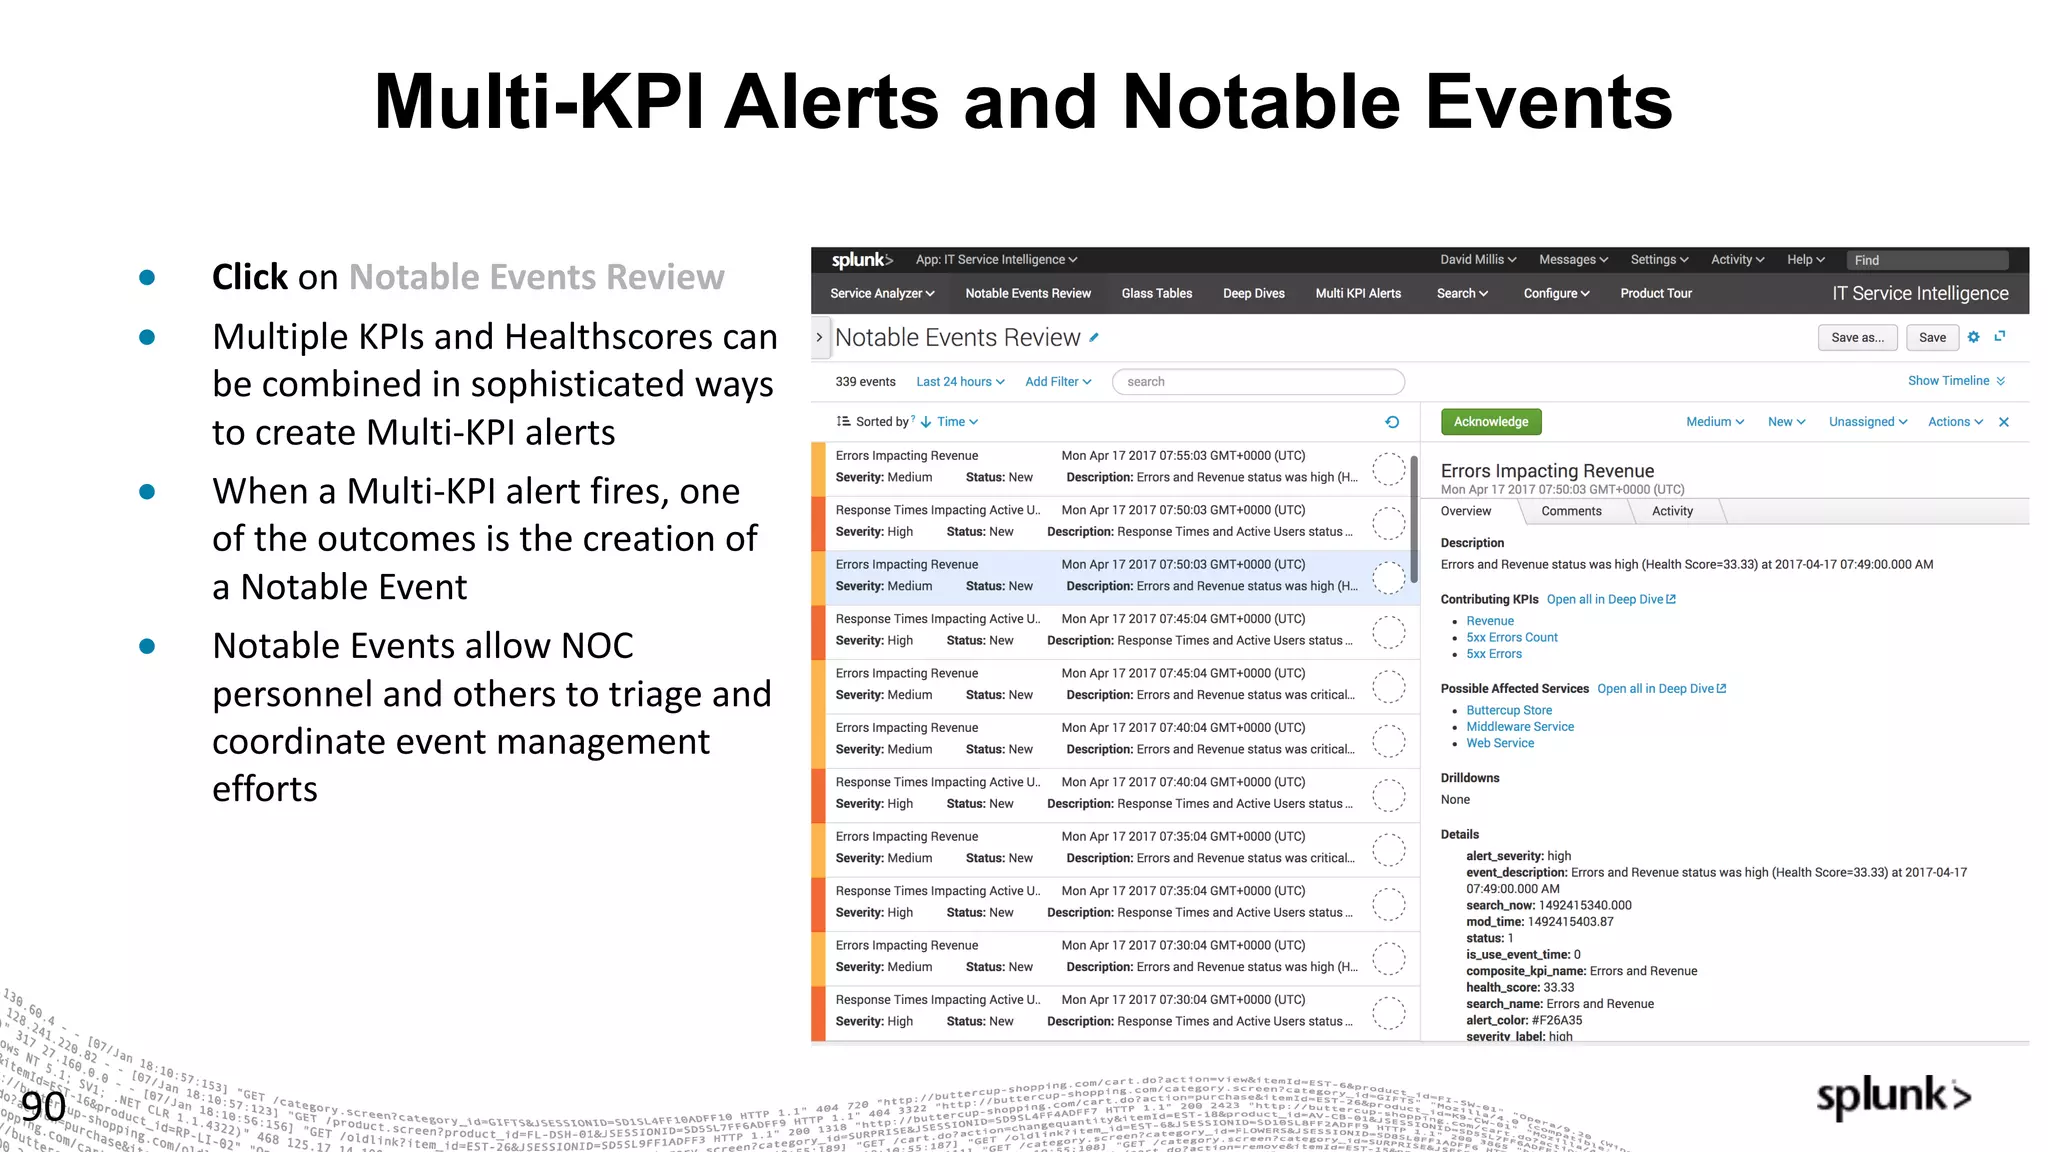
Download as PDF, PPTX

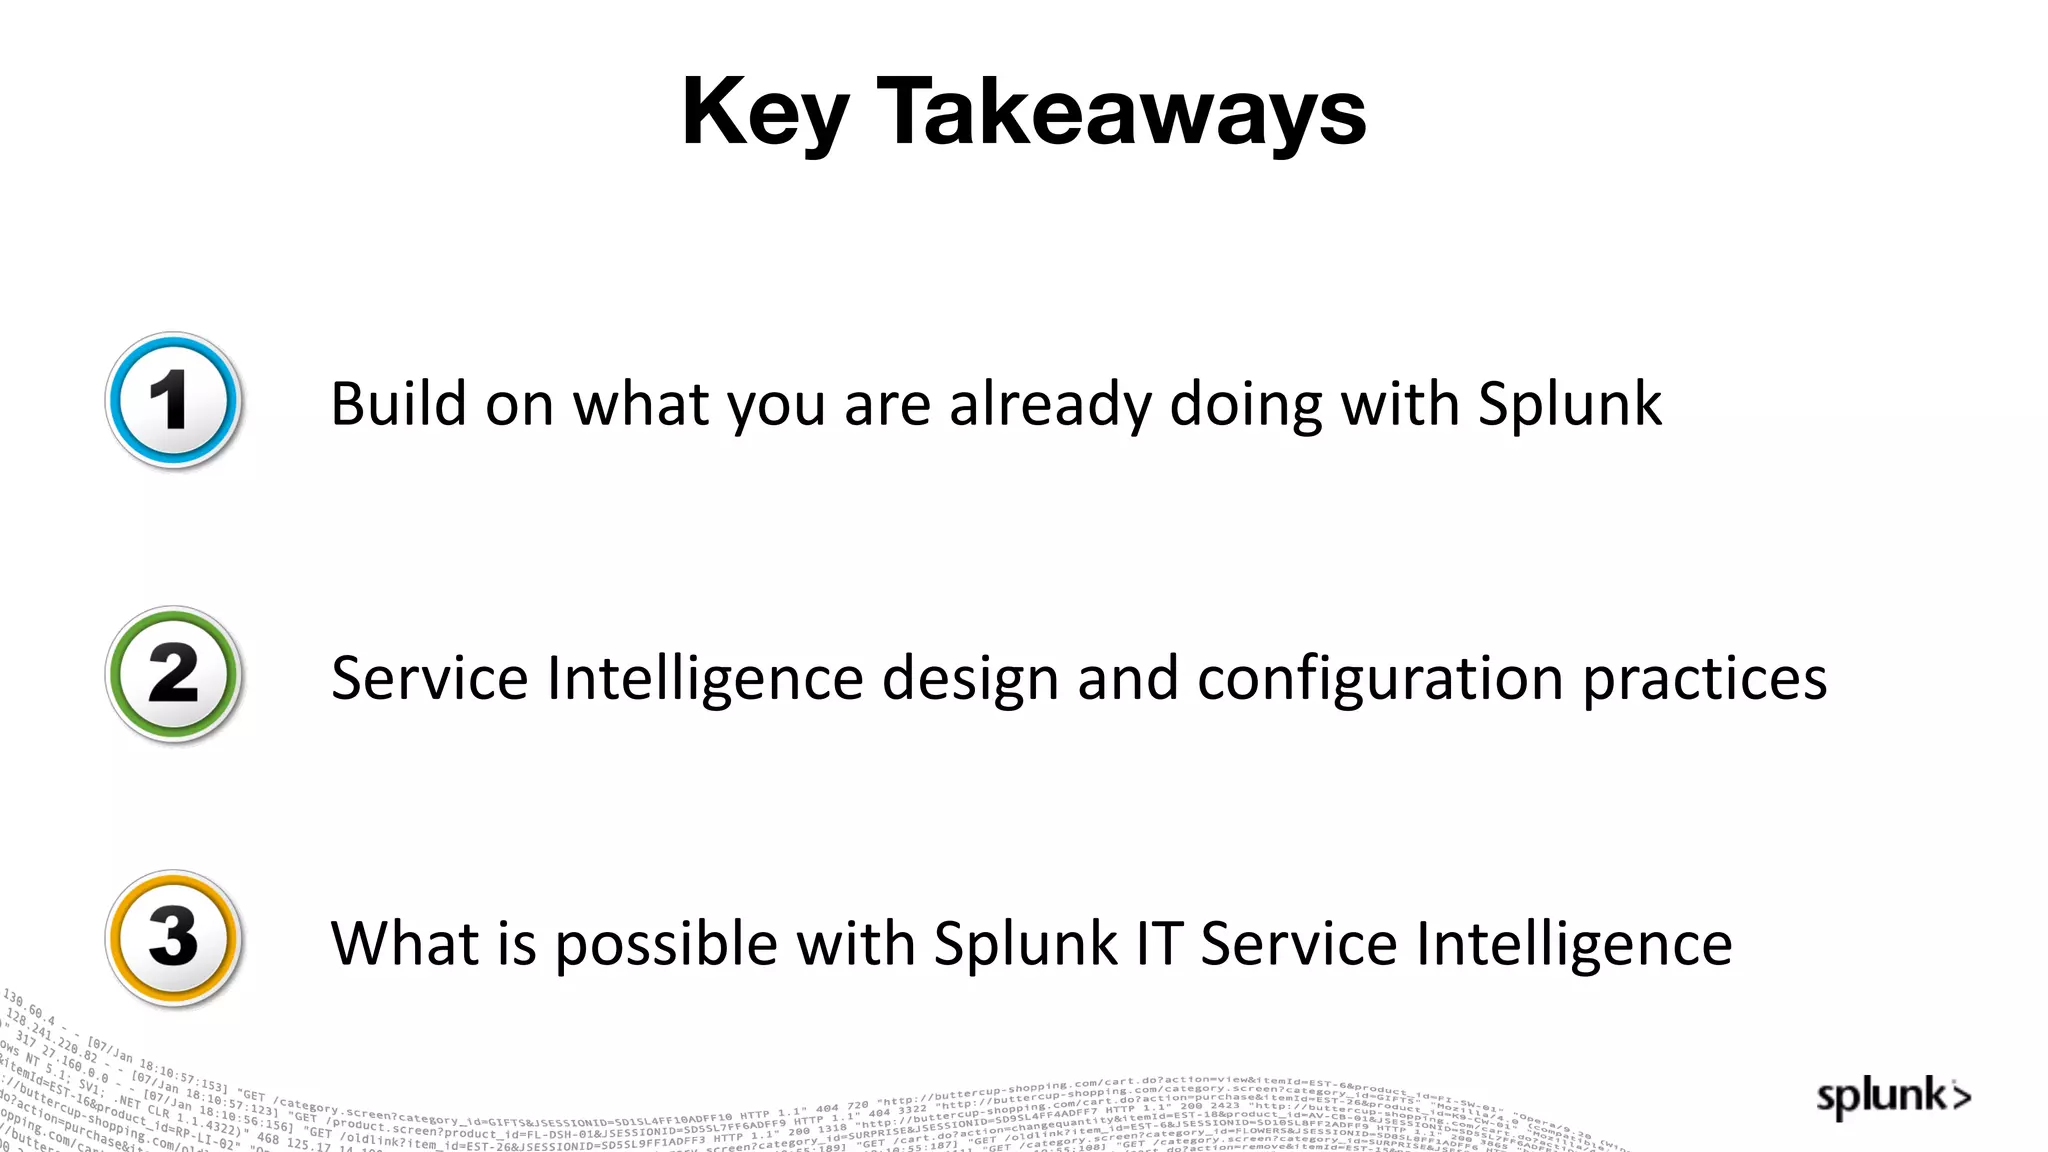

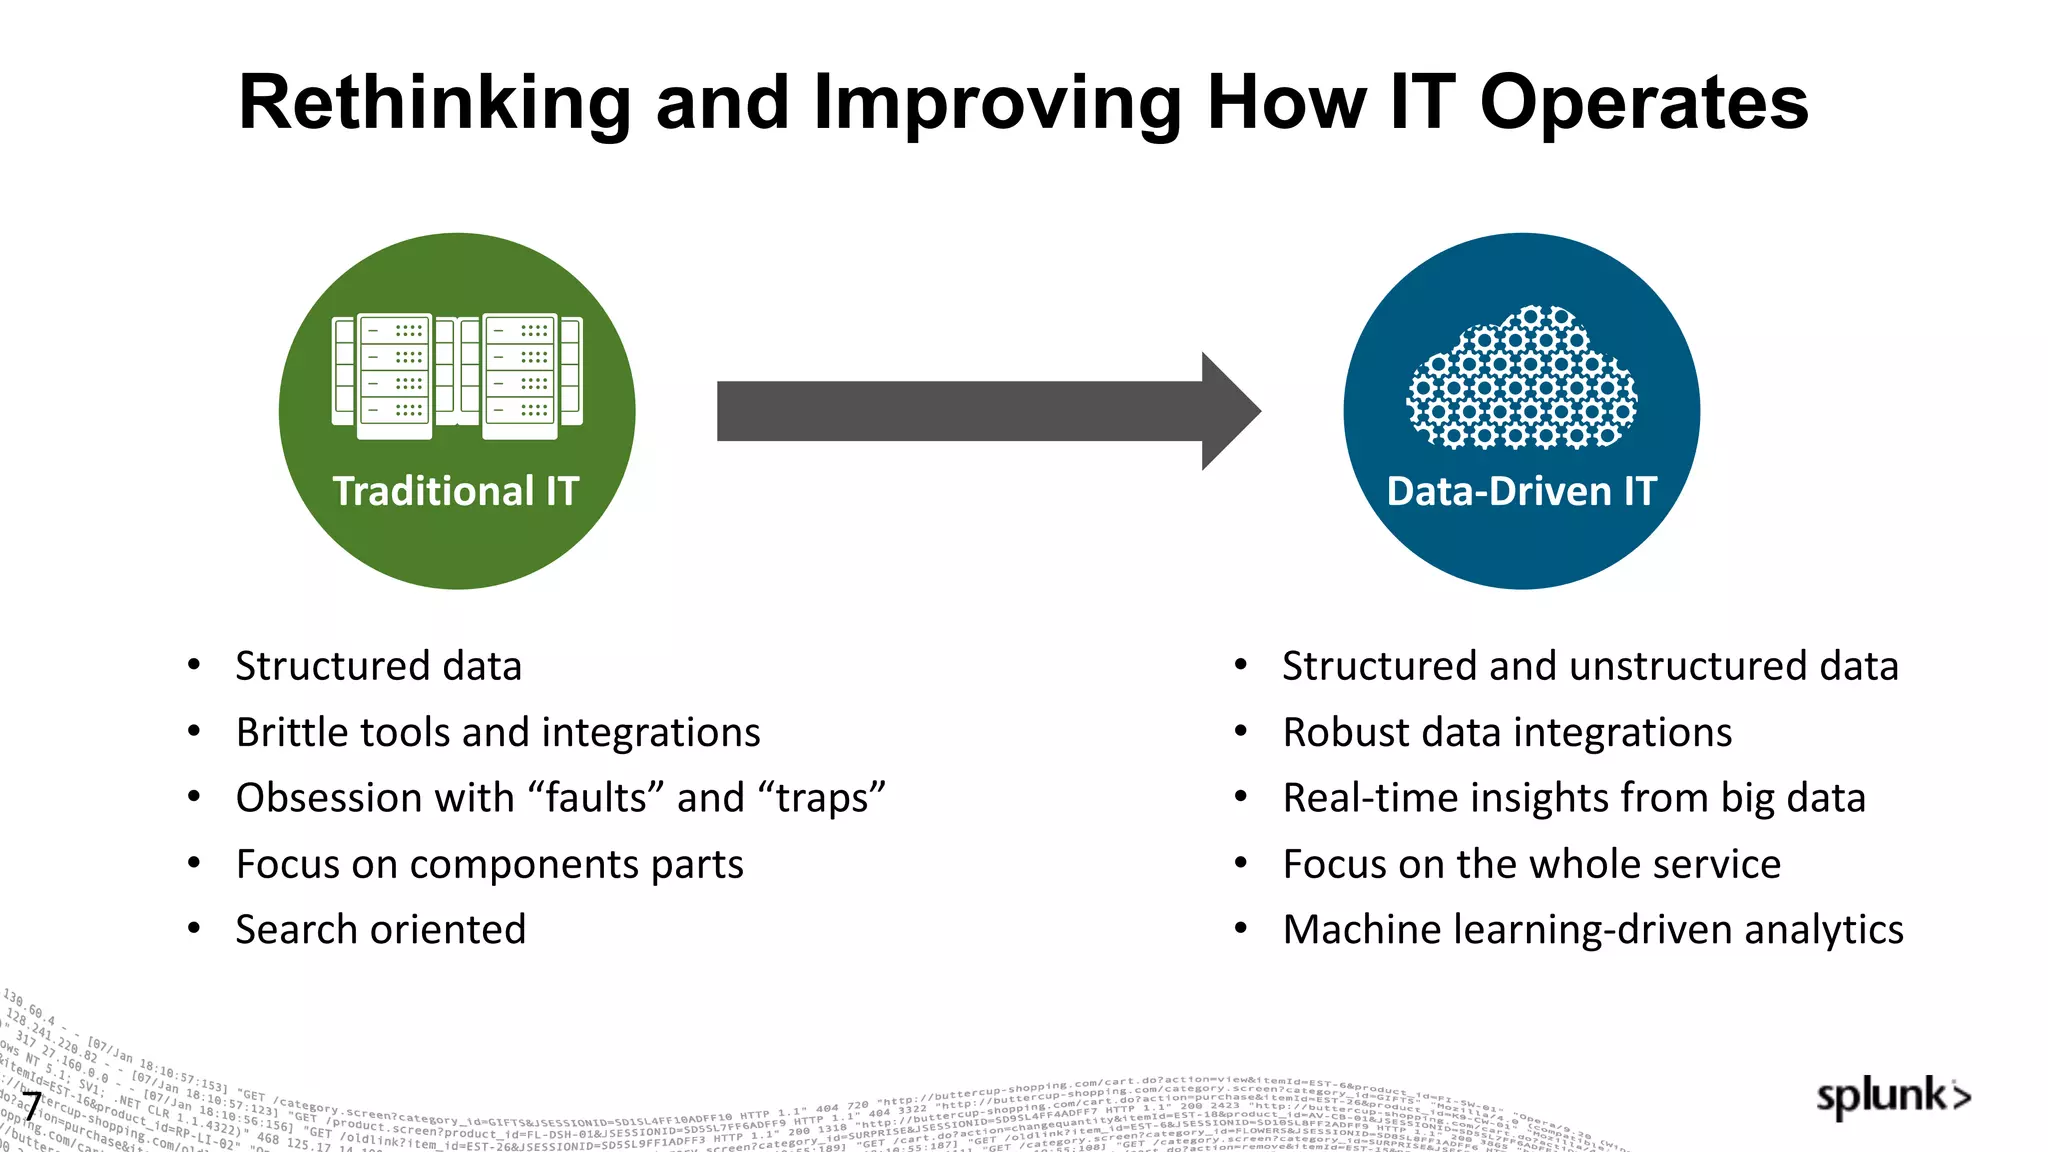
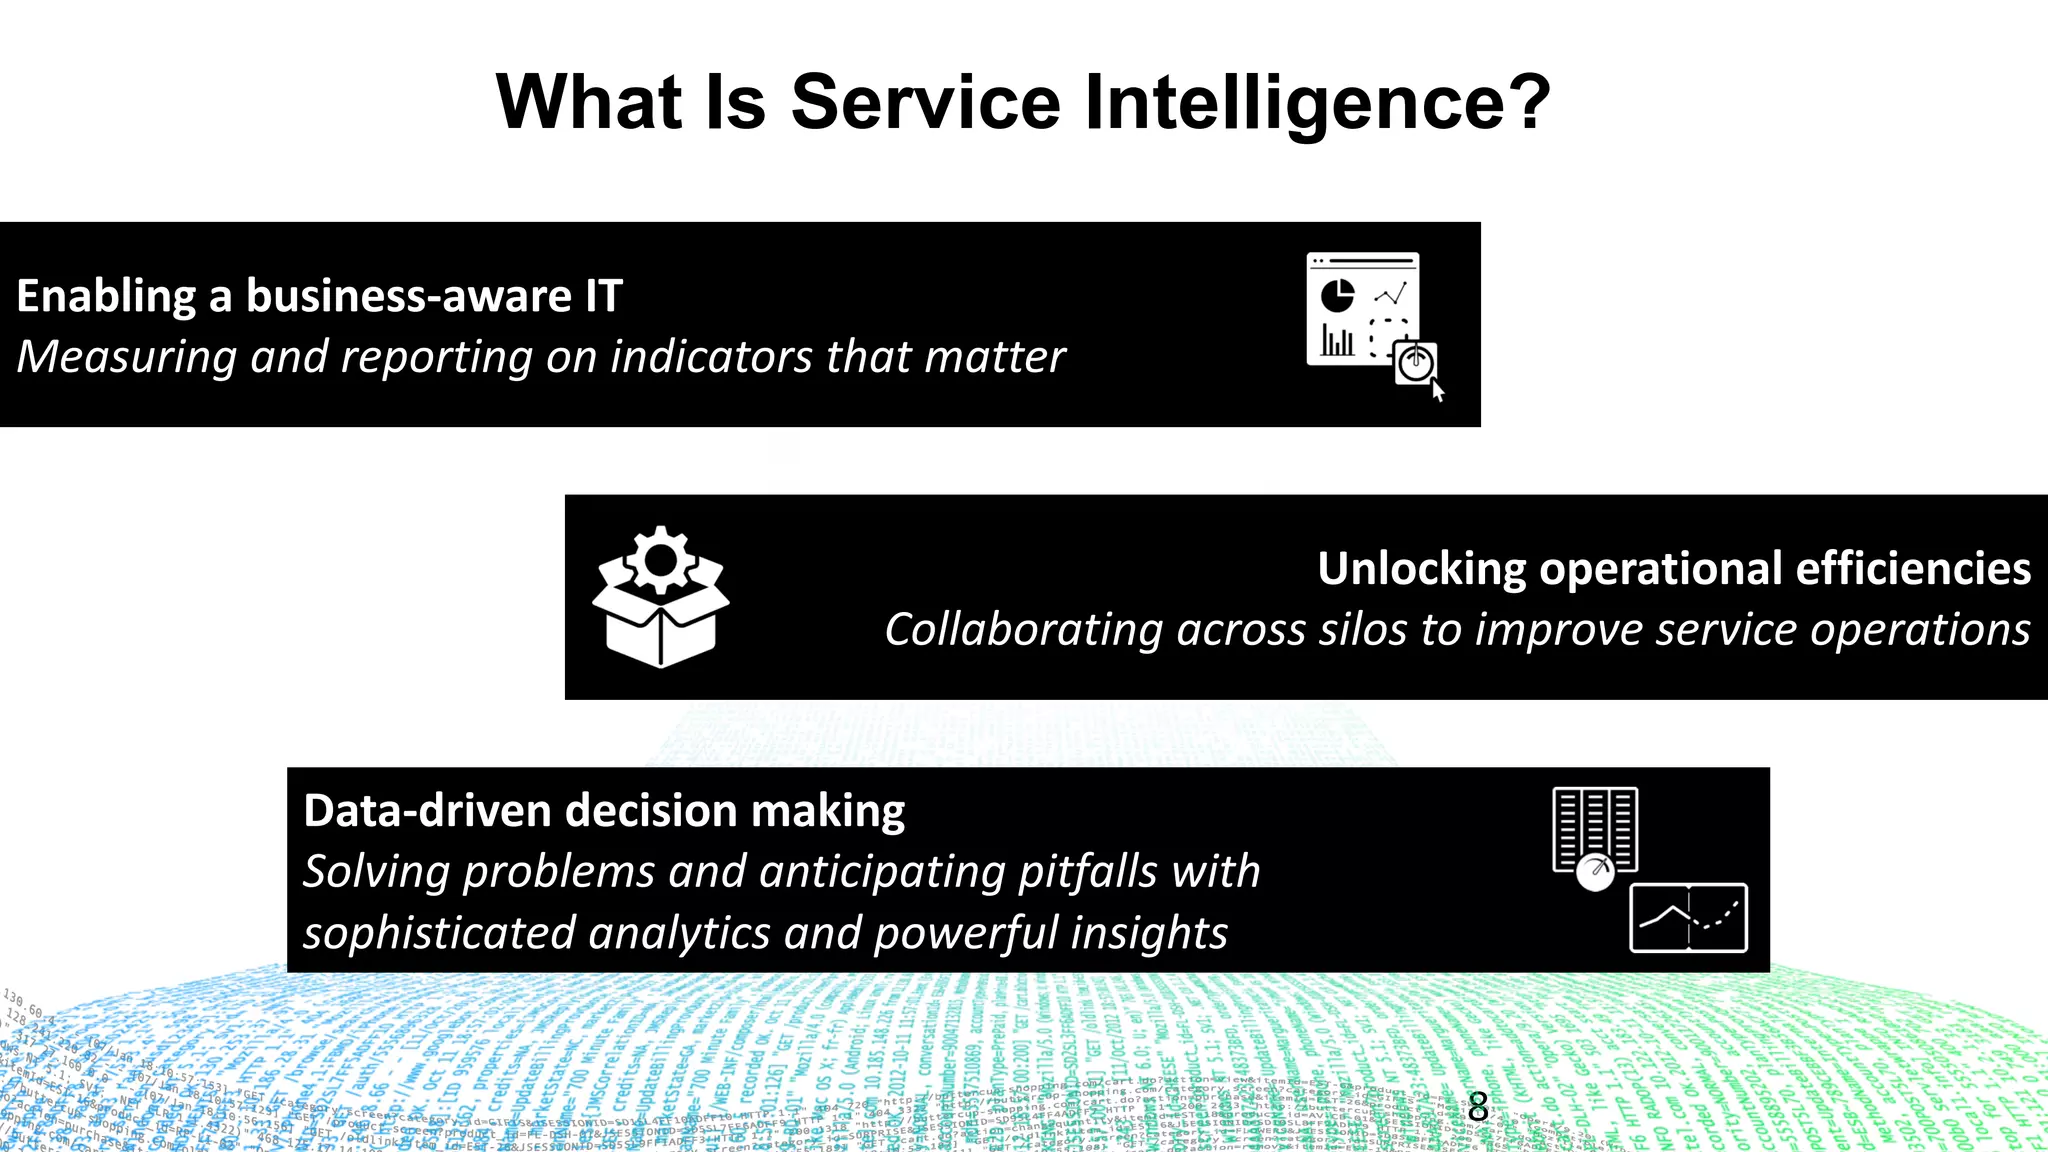

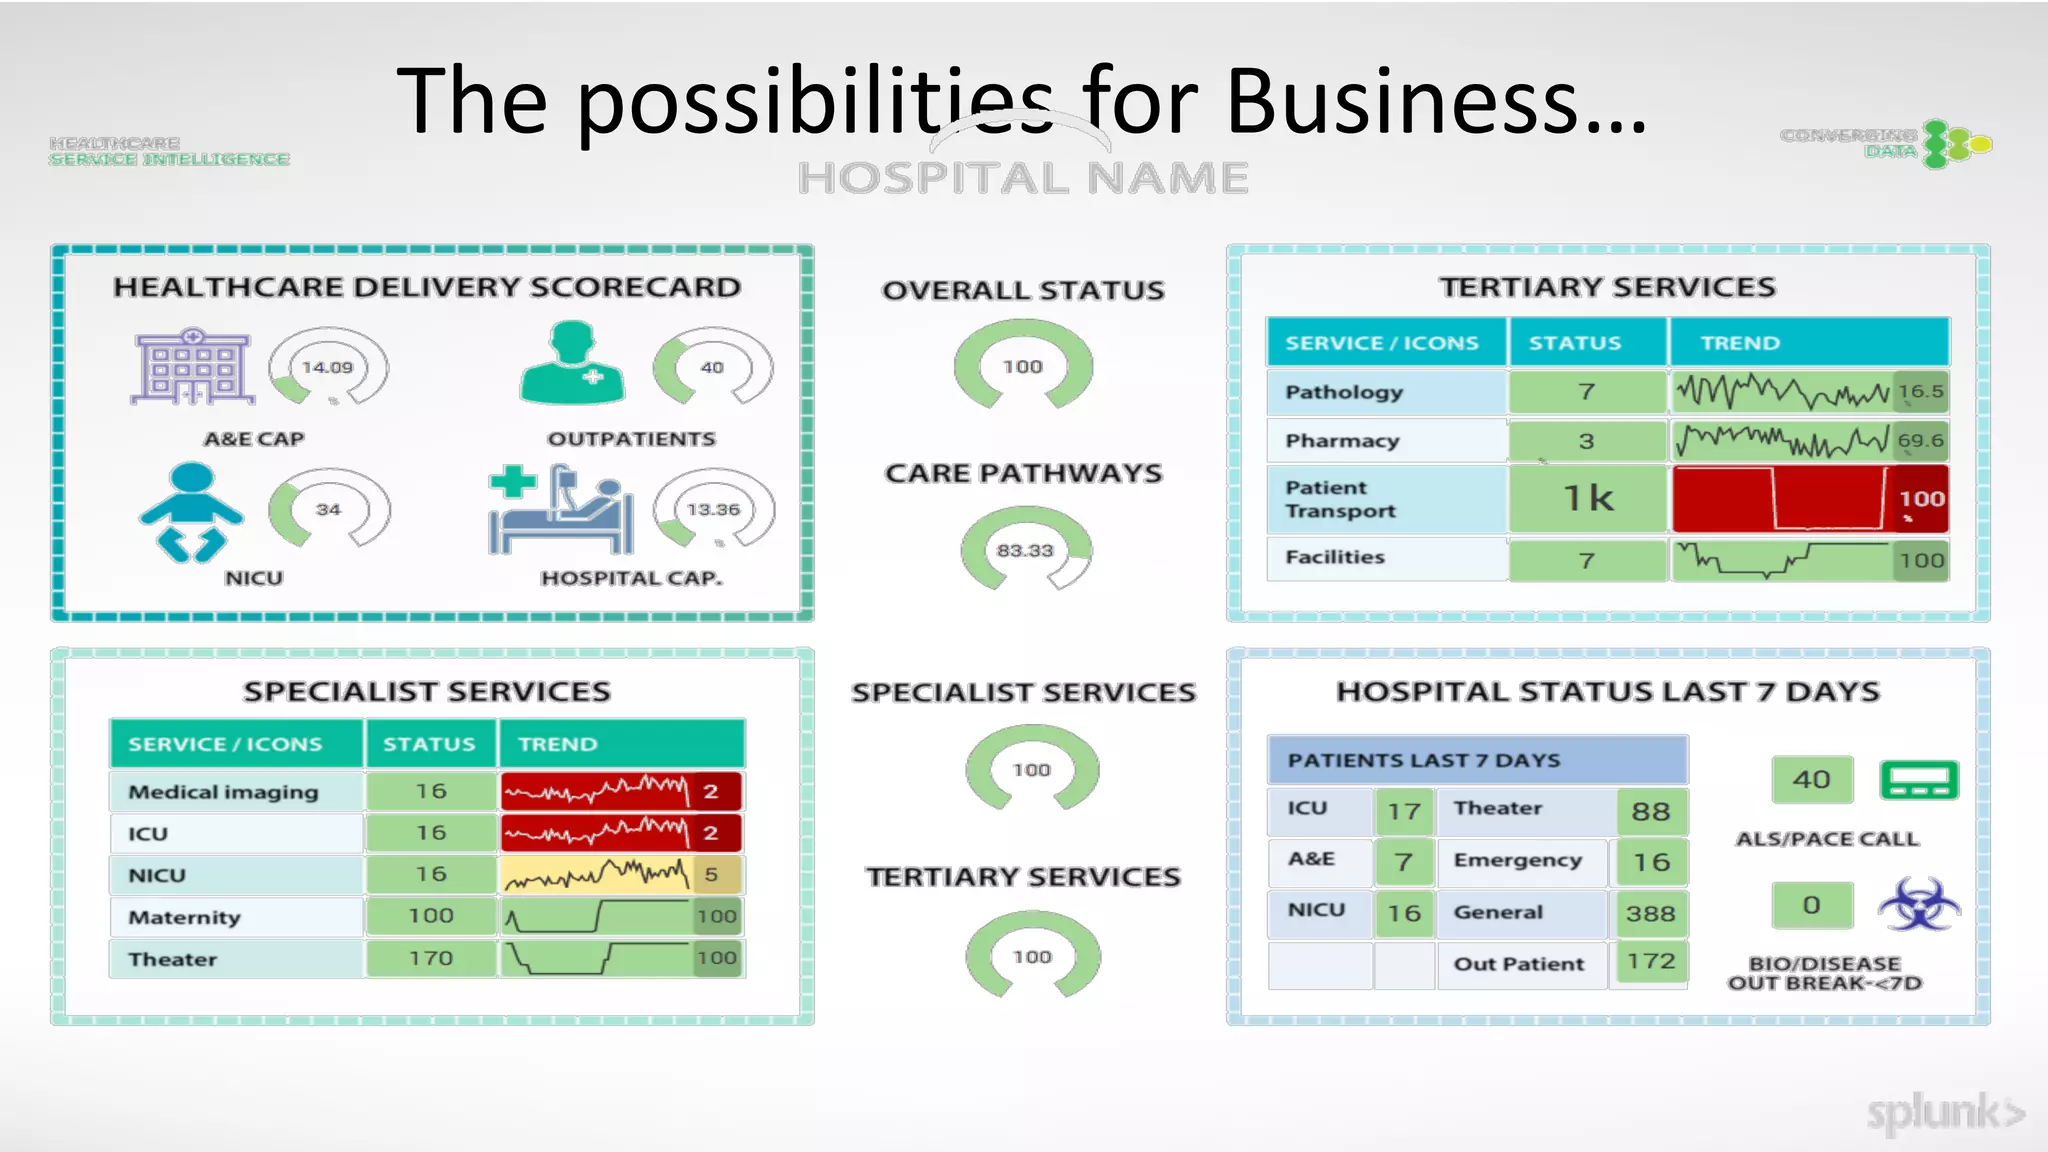
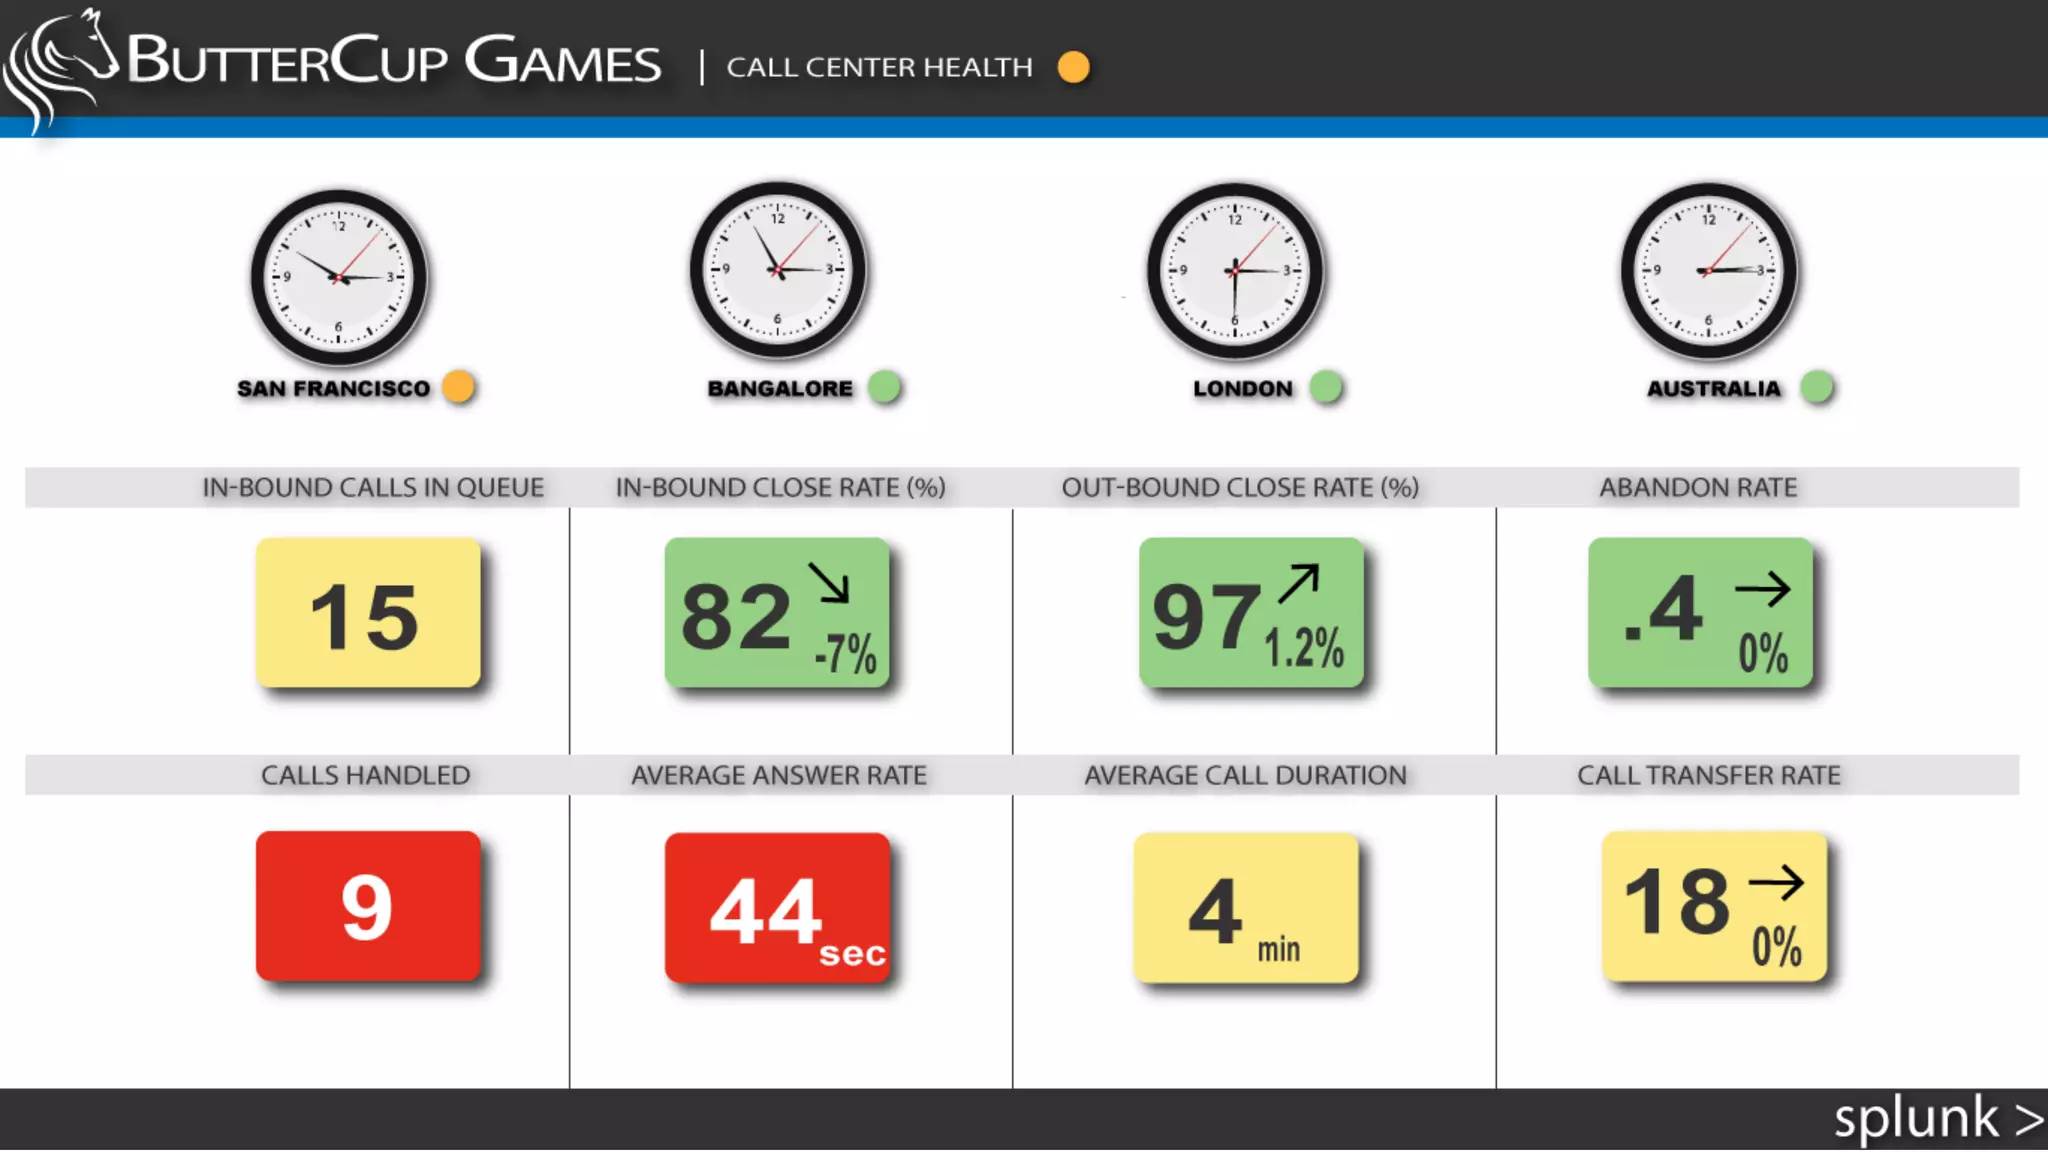
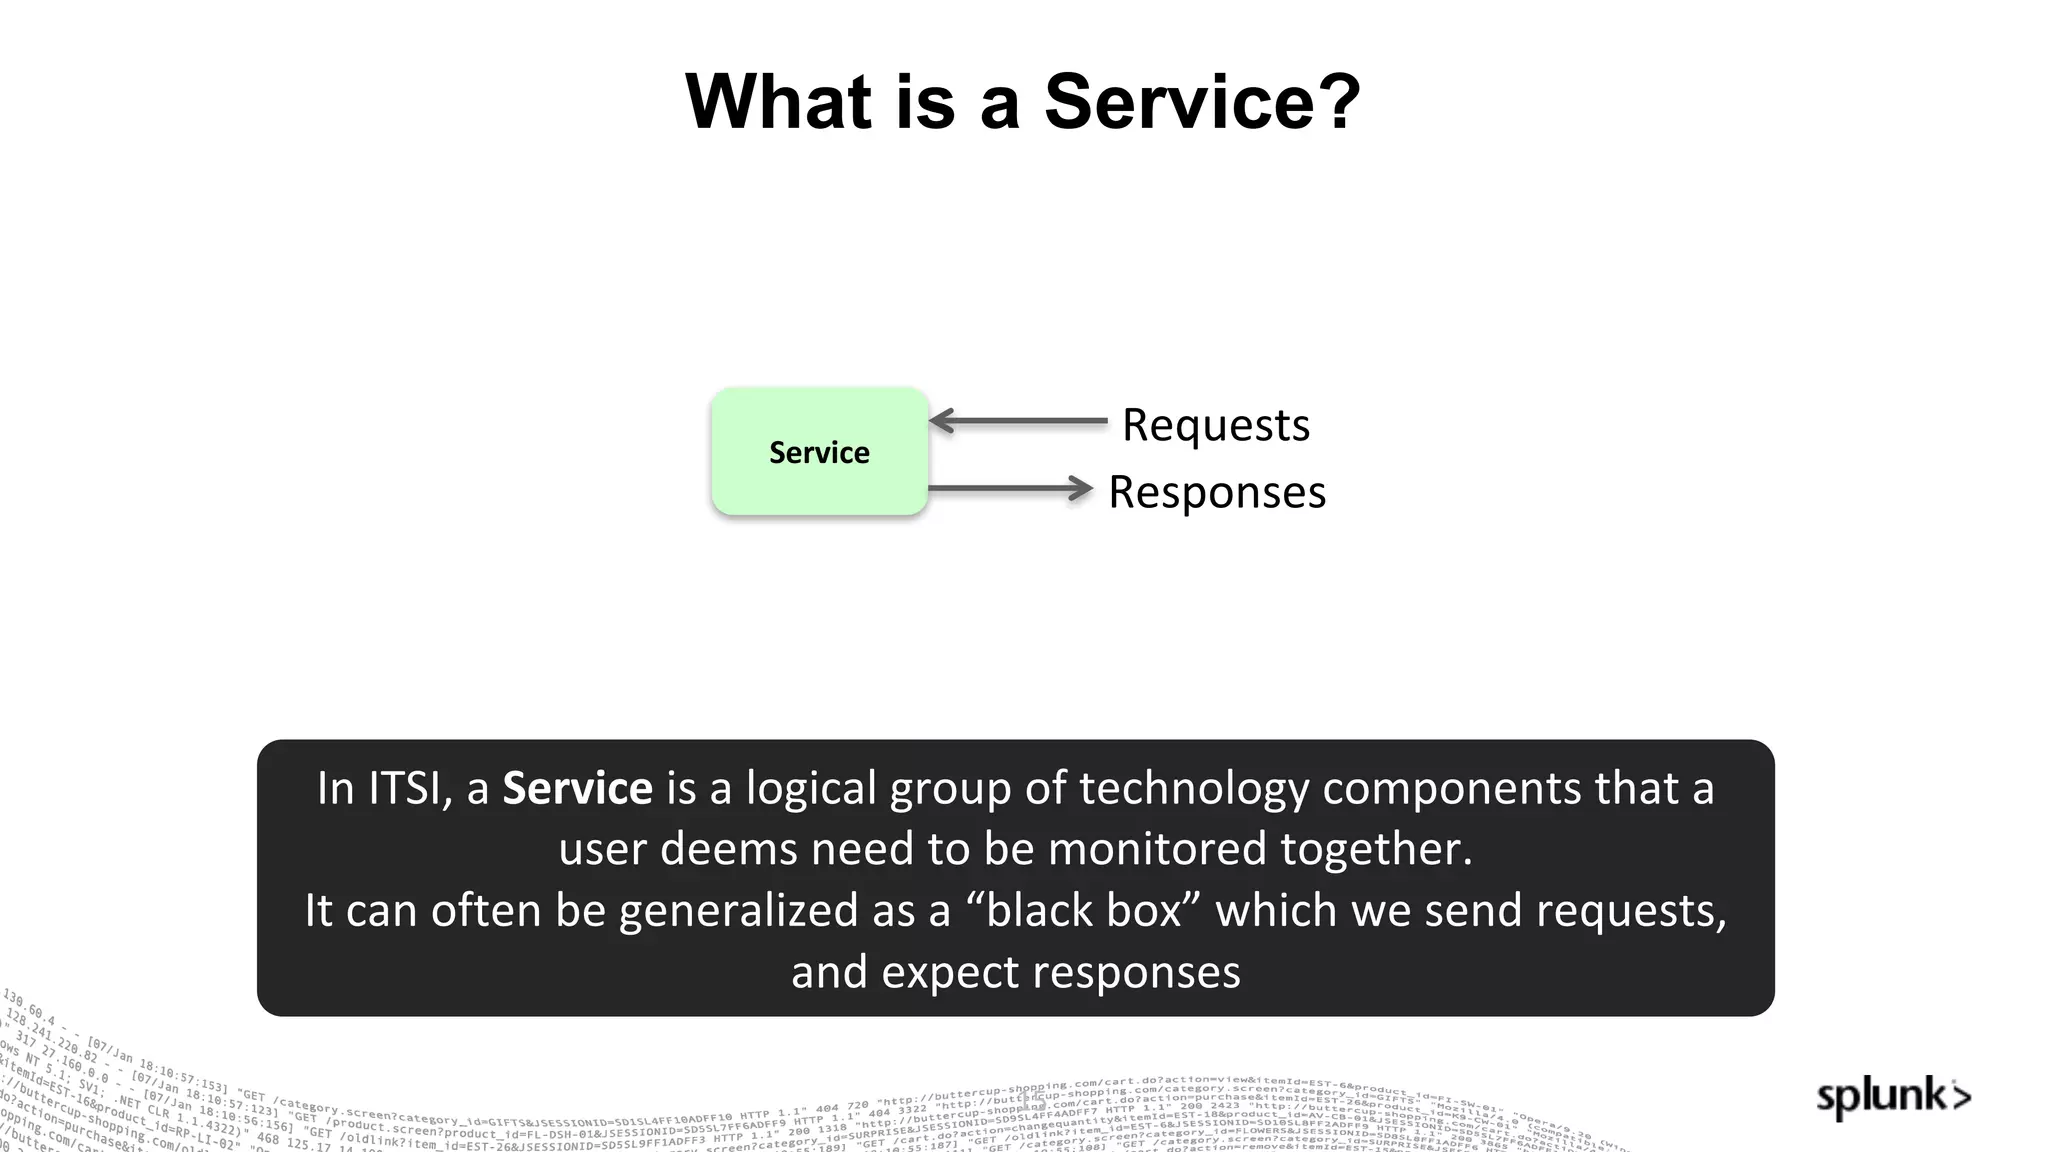
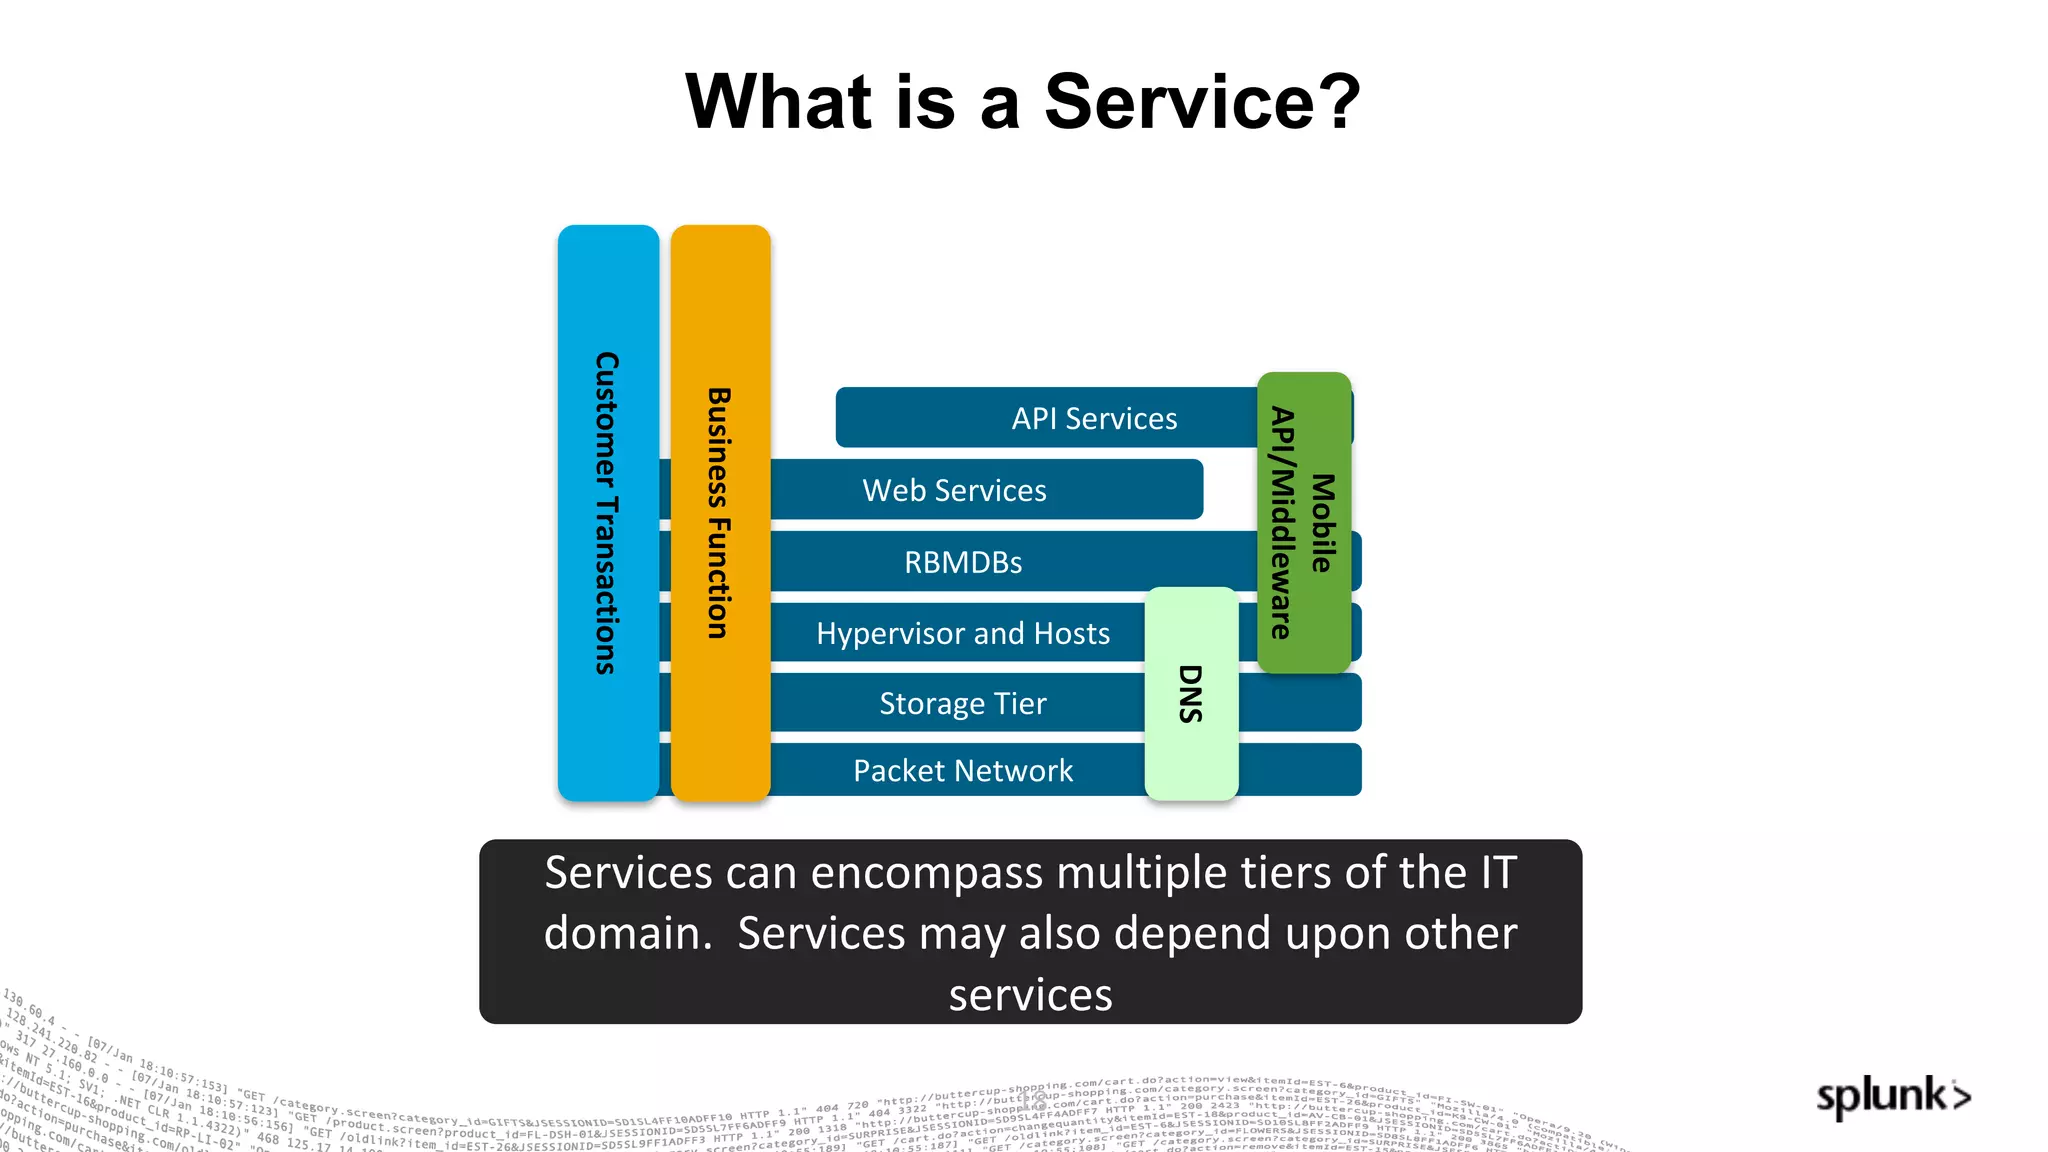
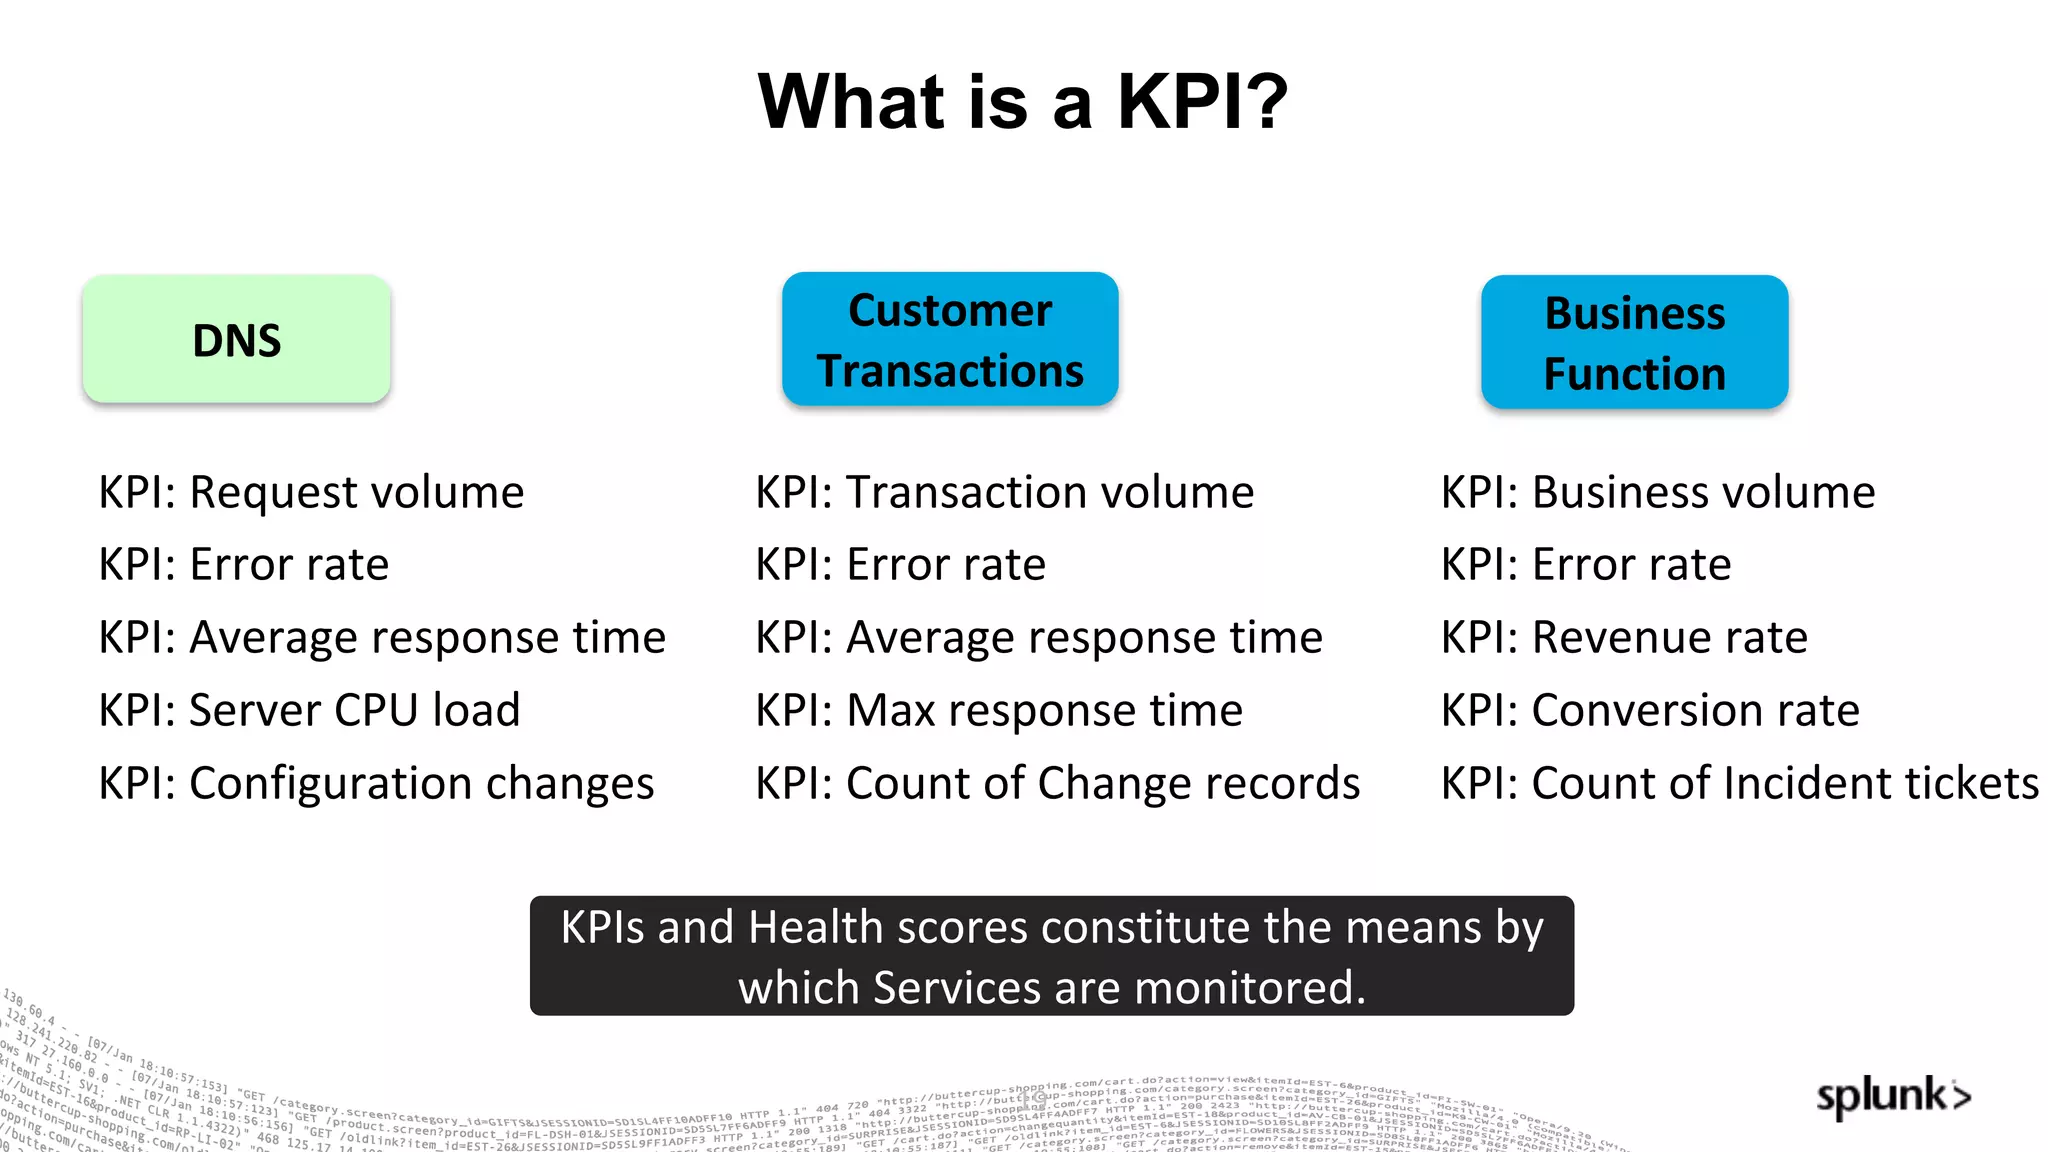


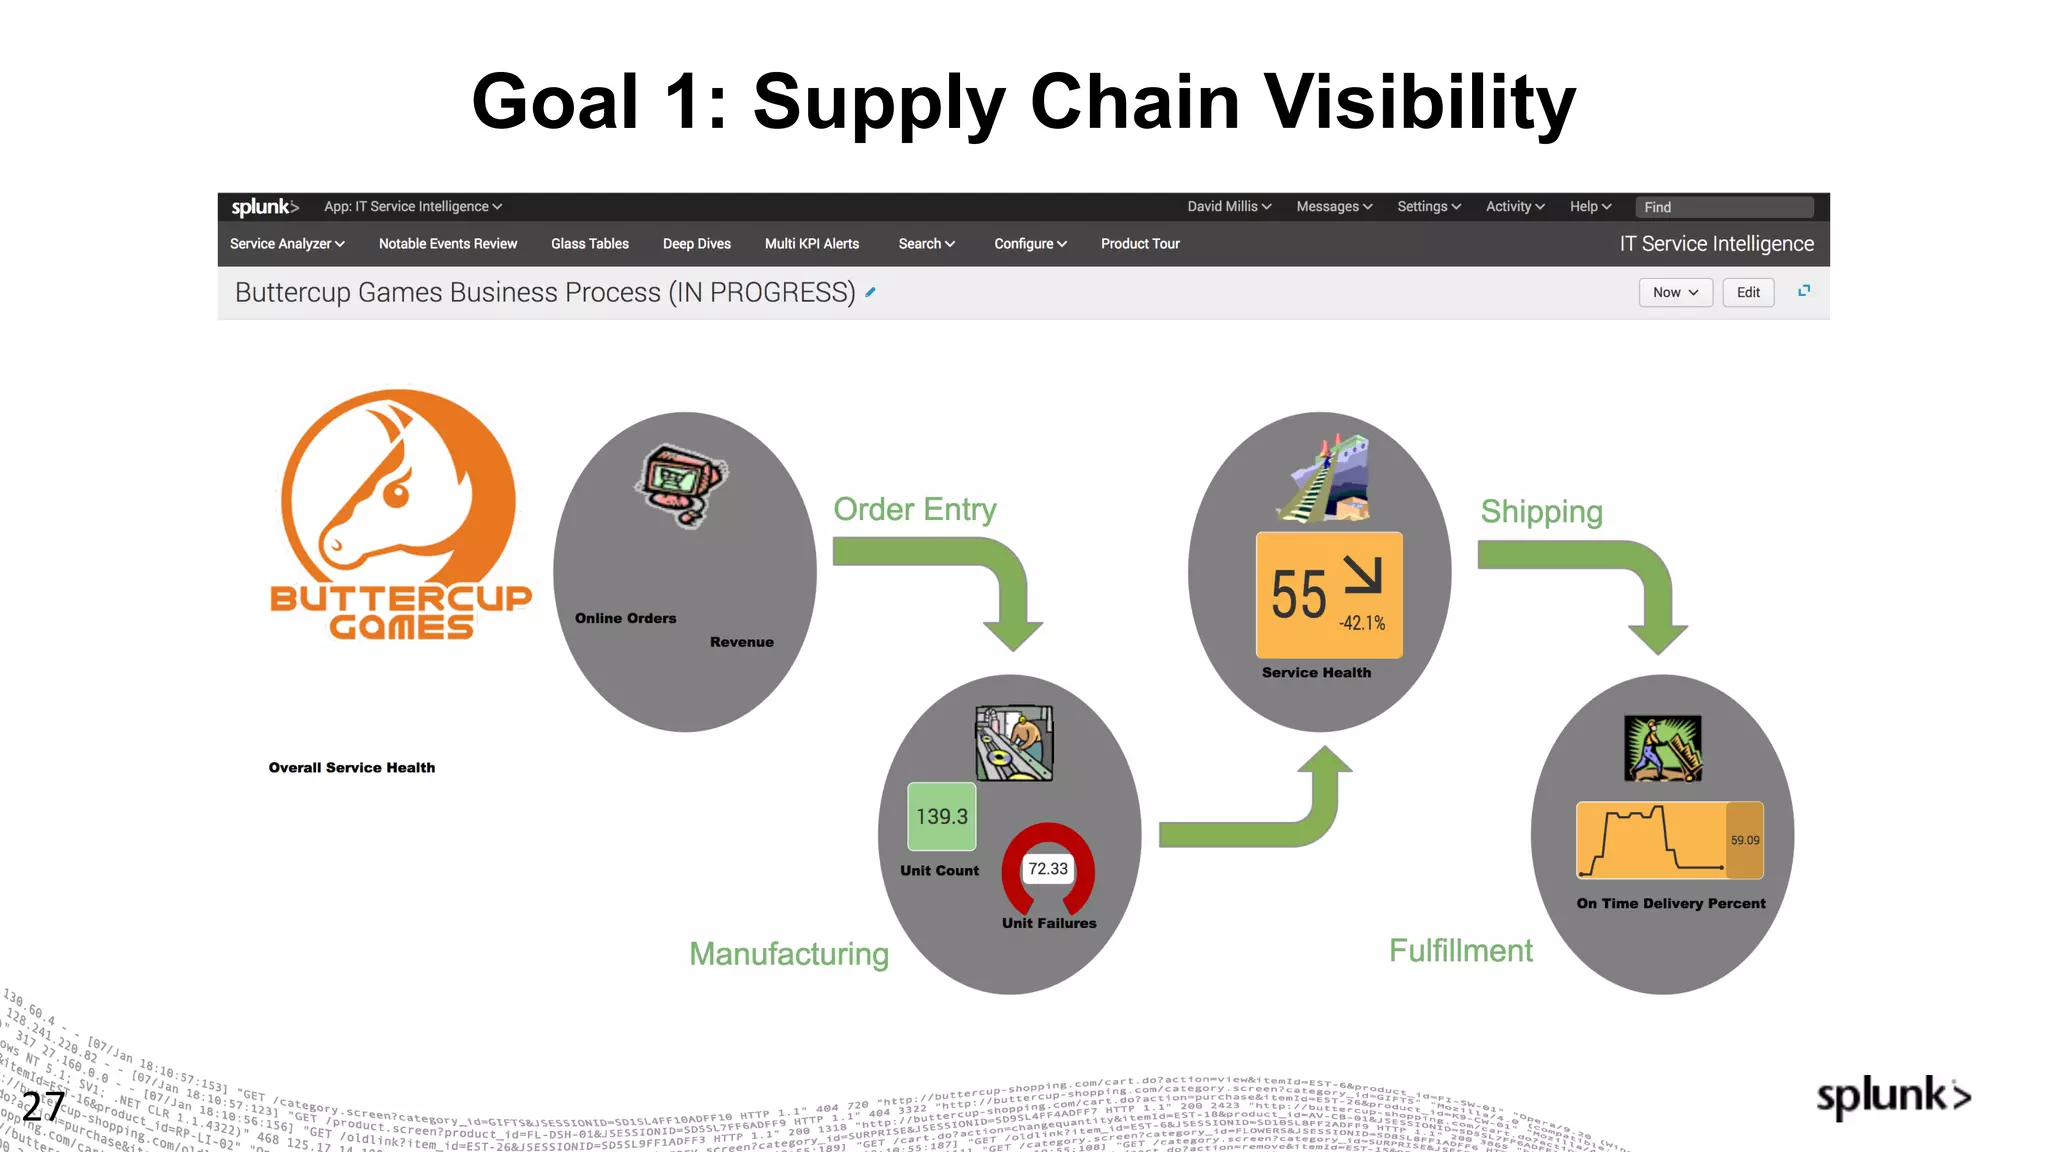
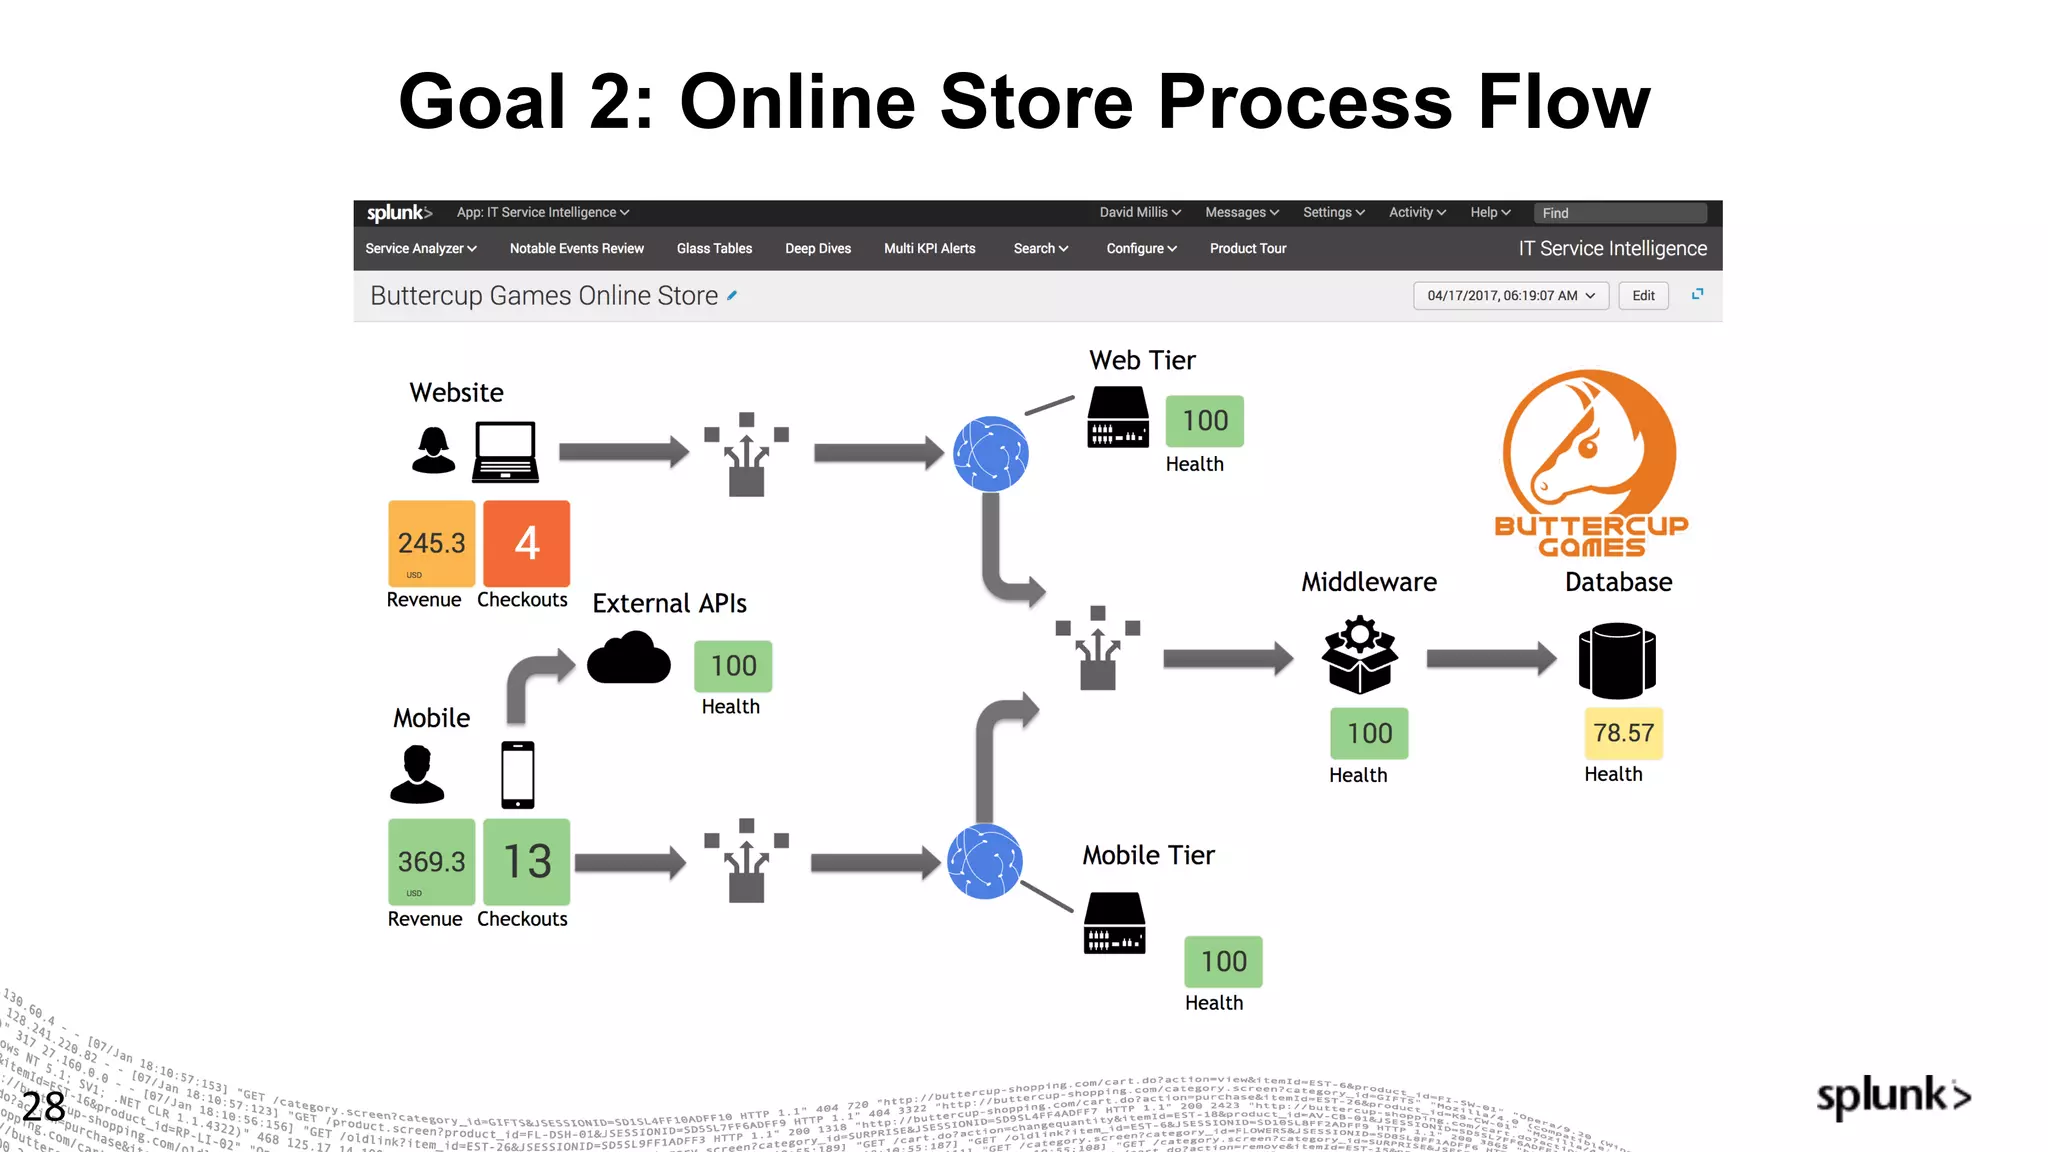
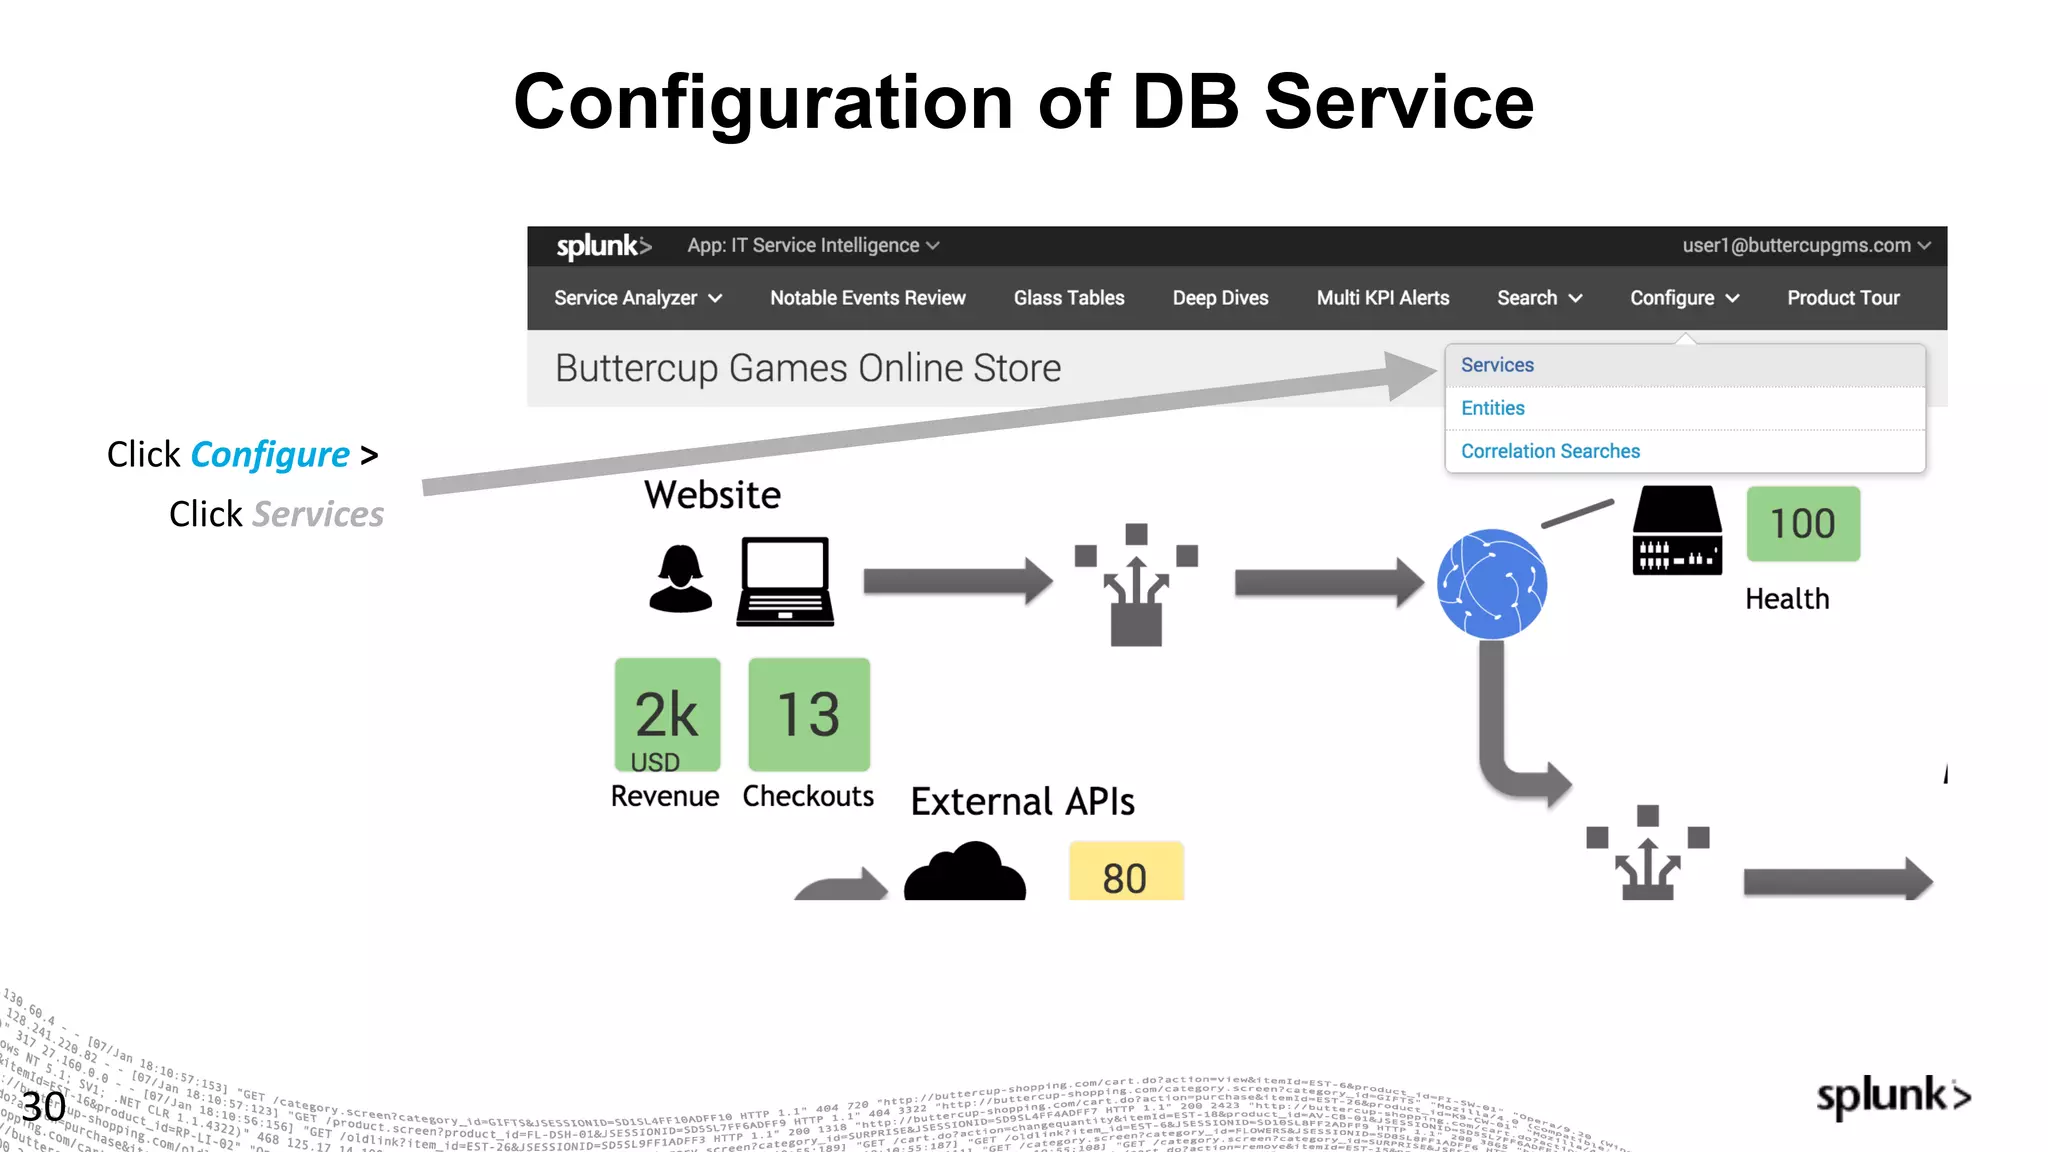
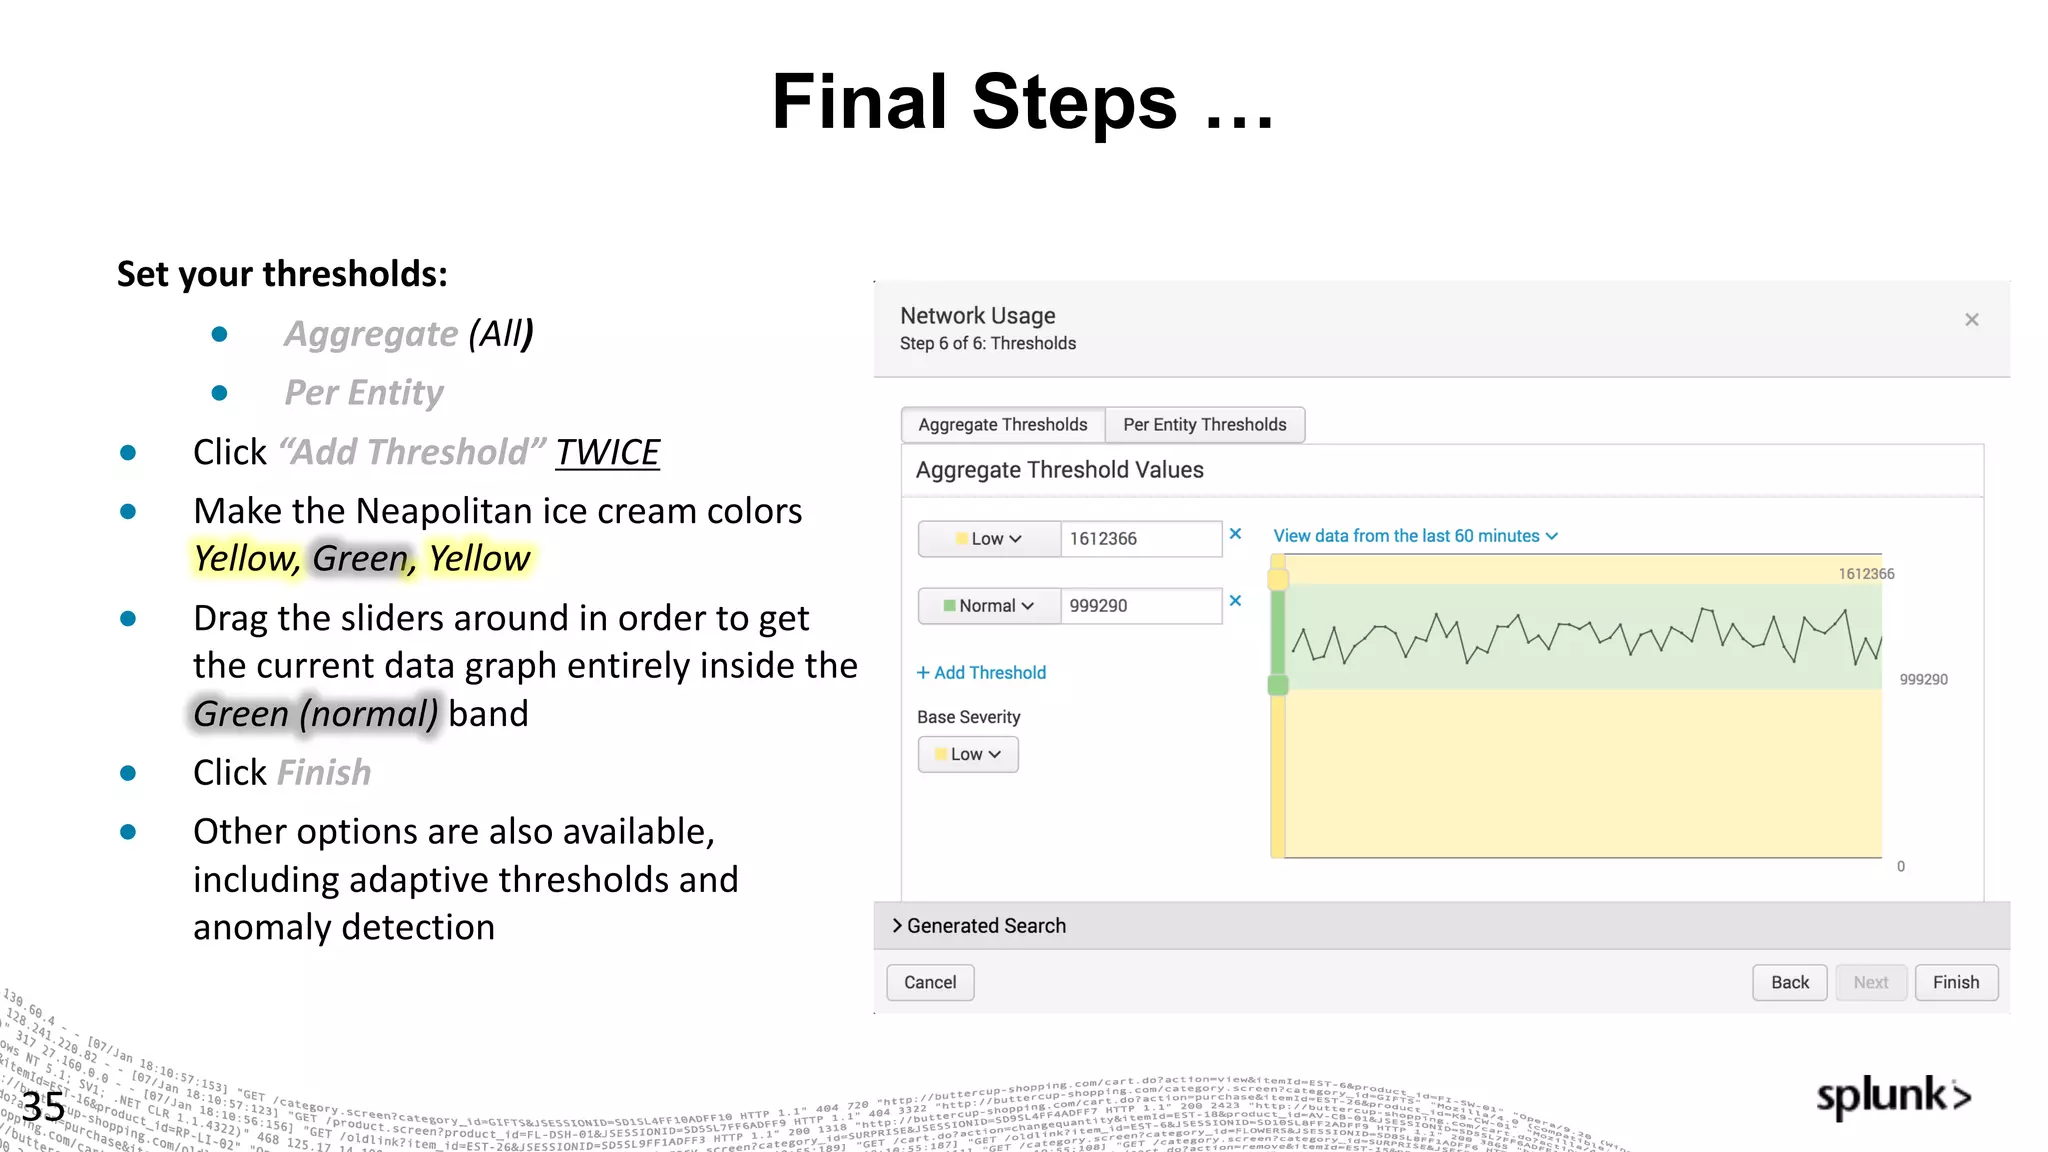
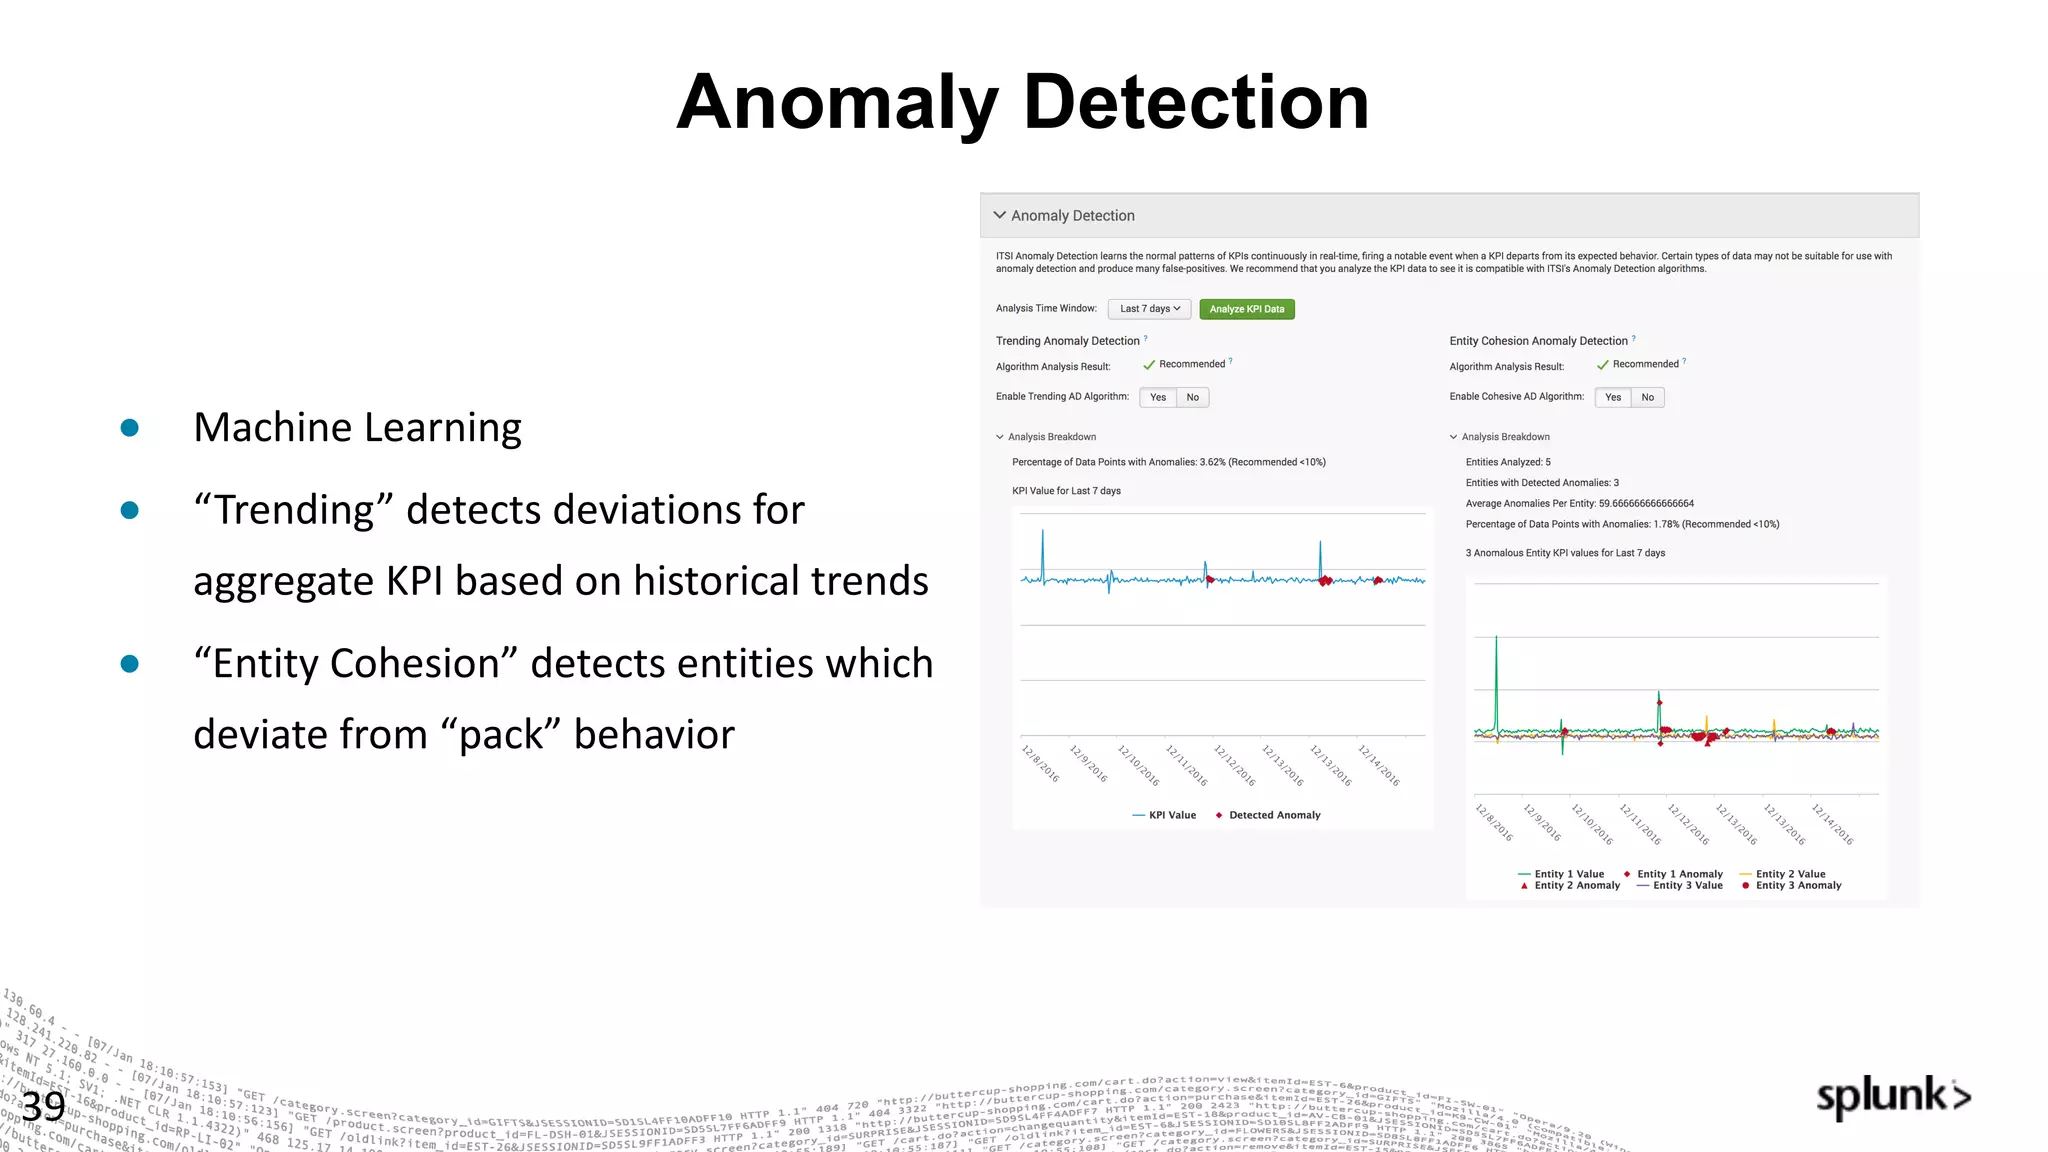
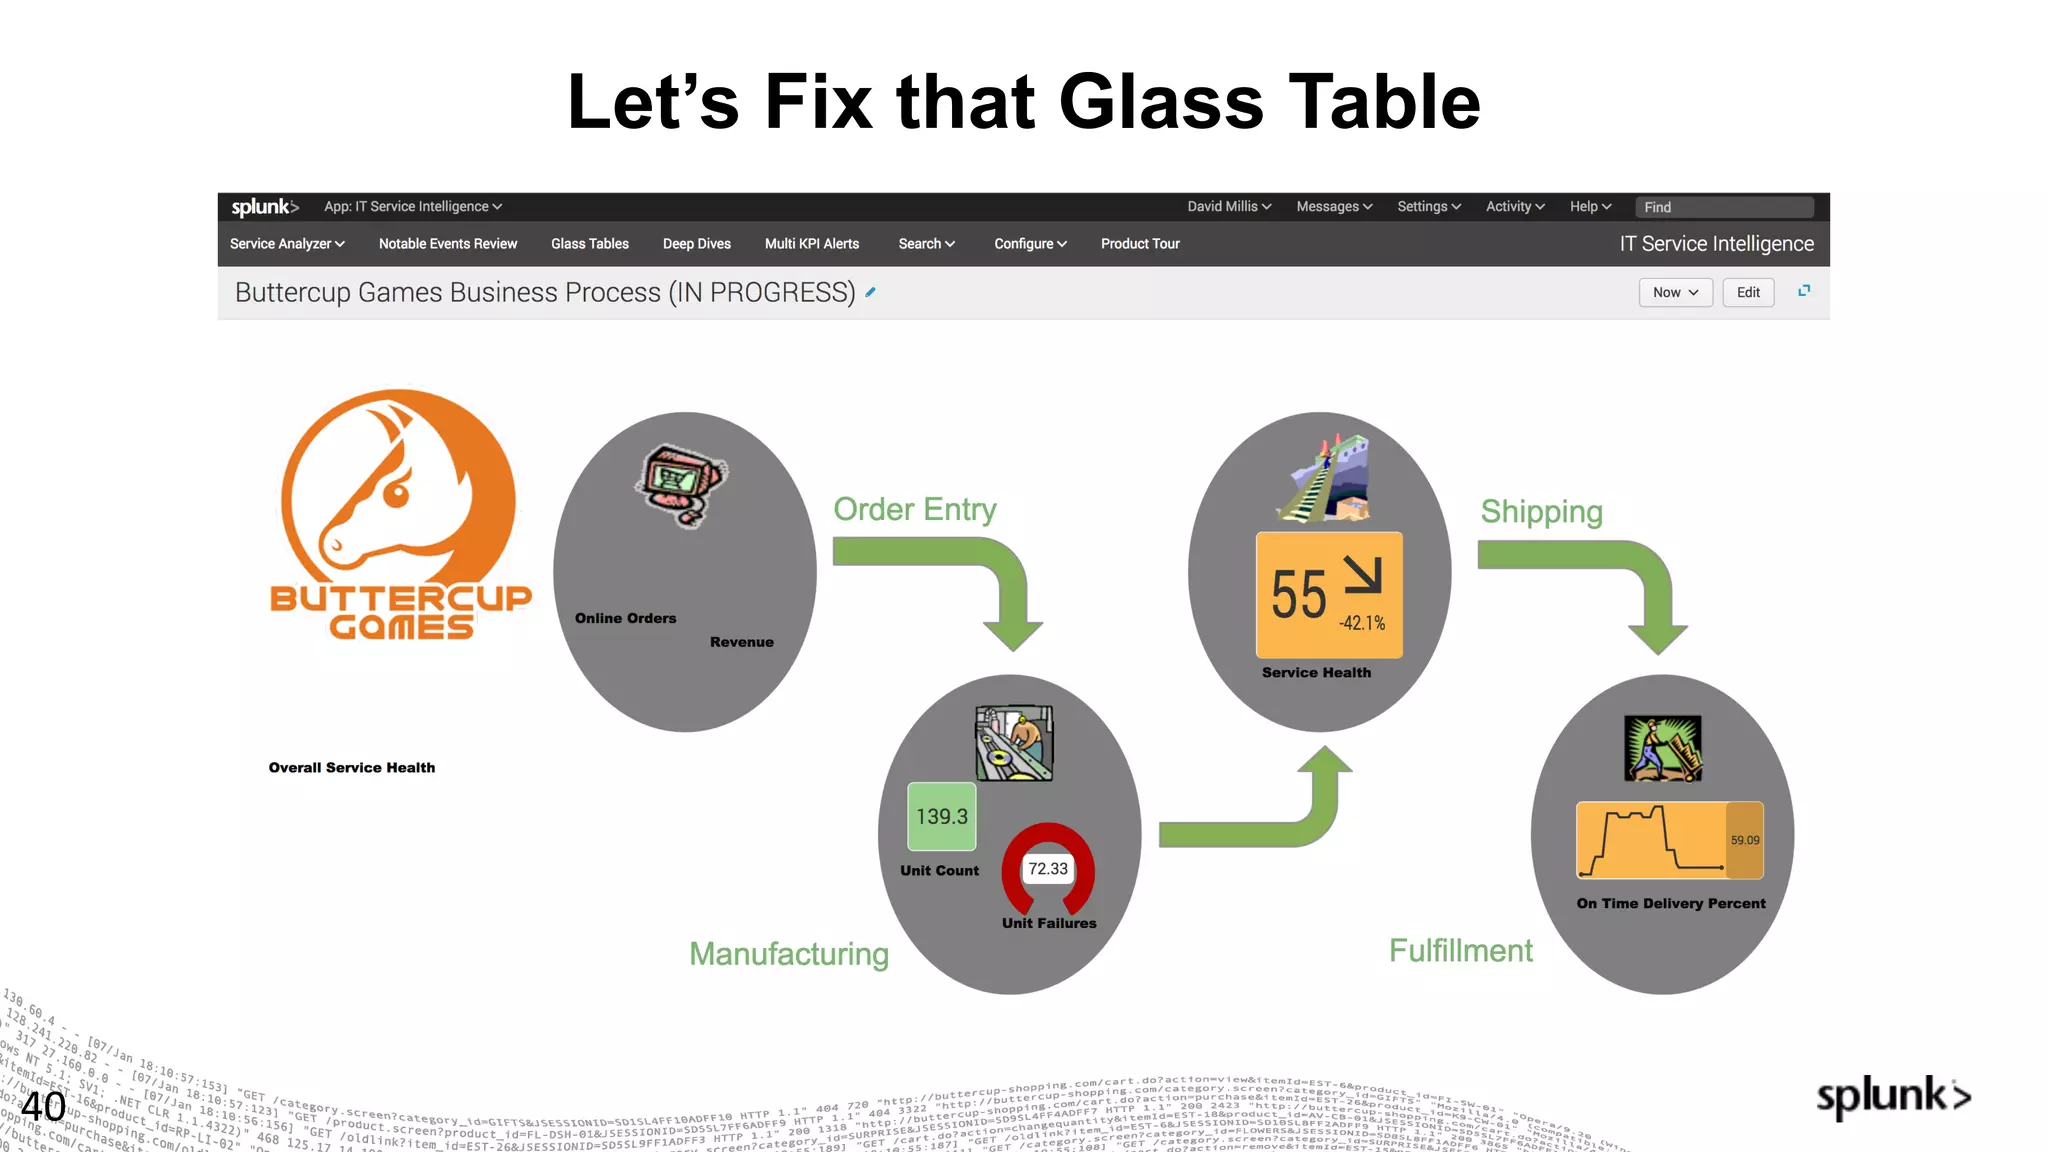
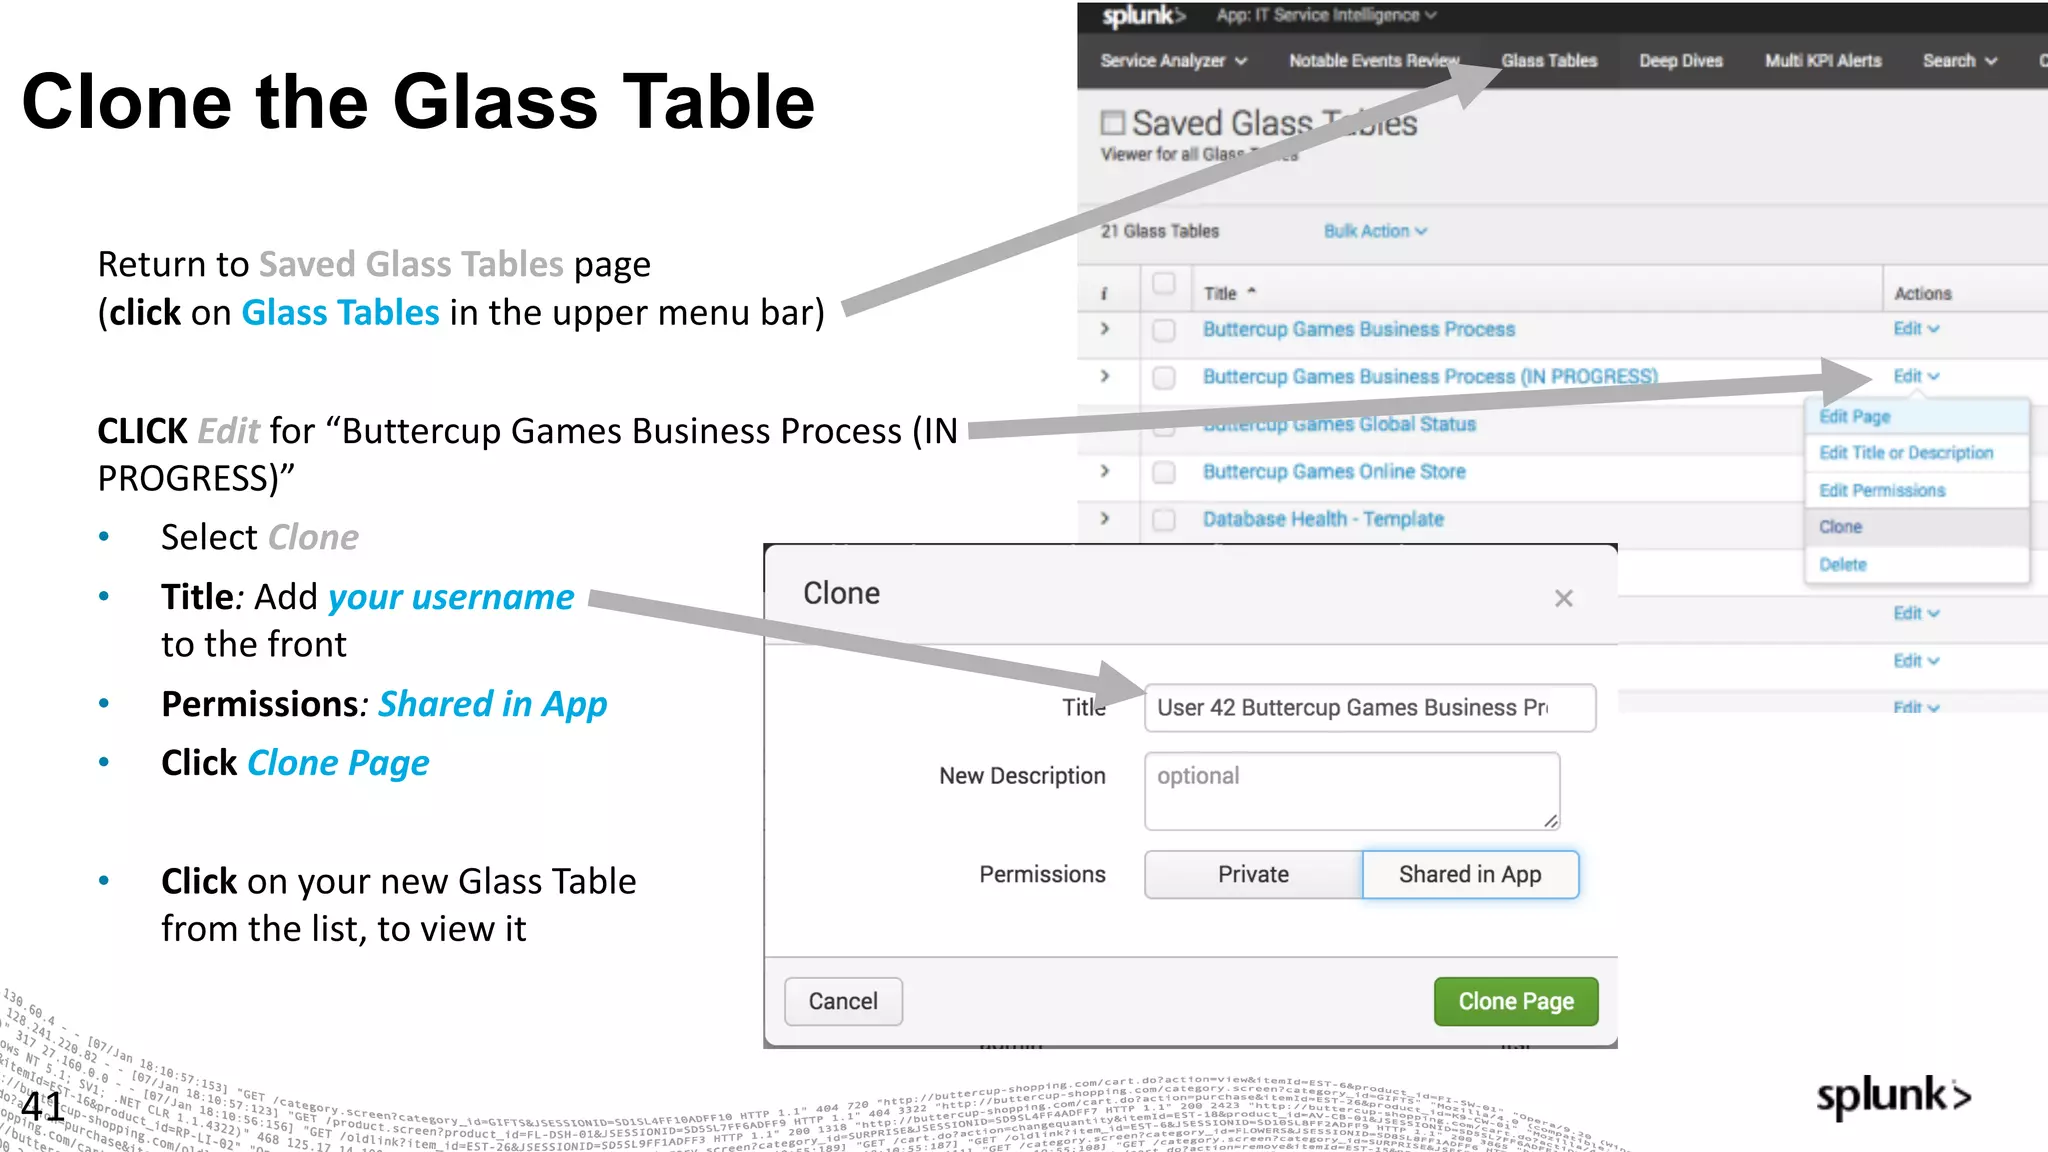
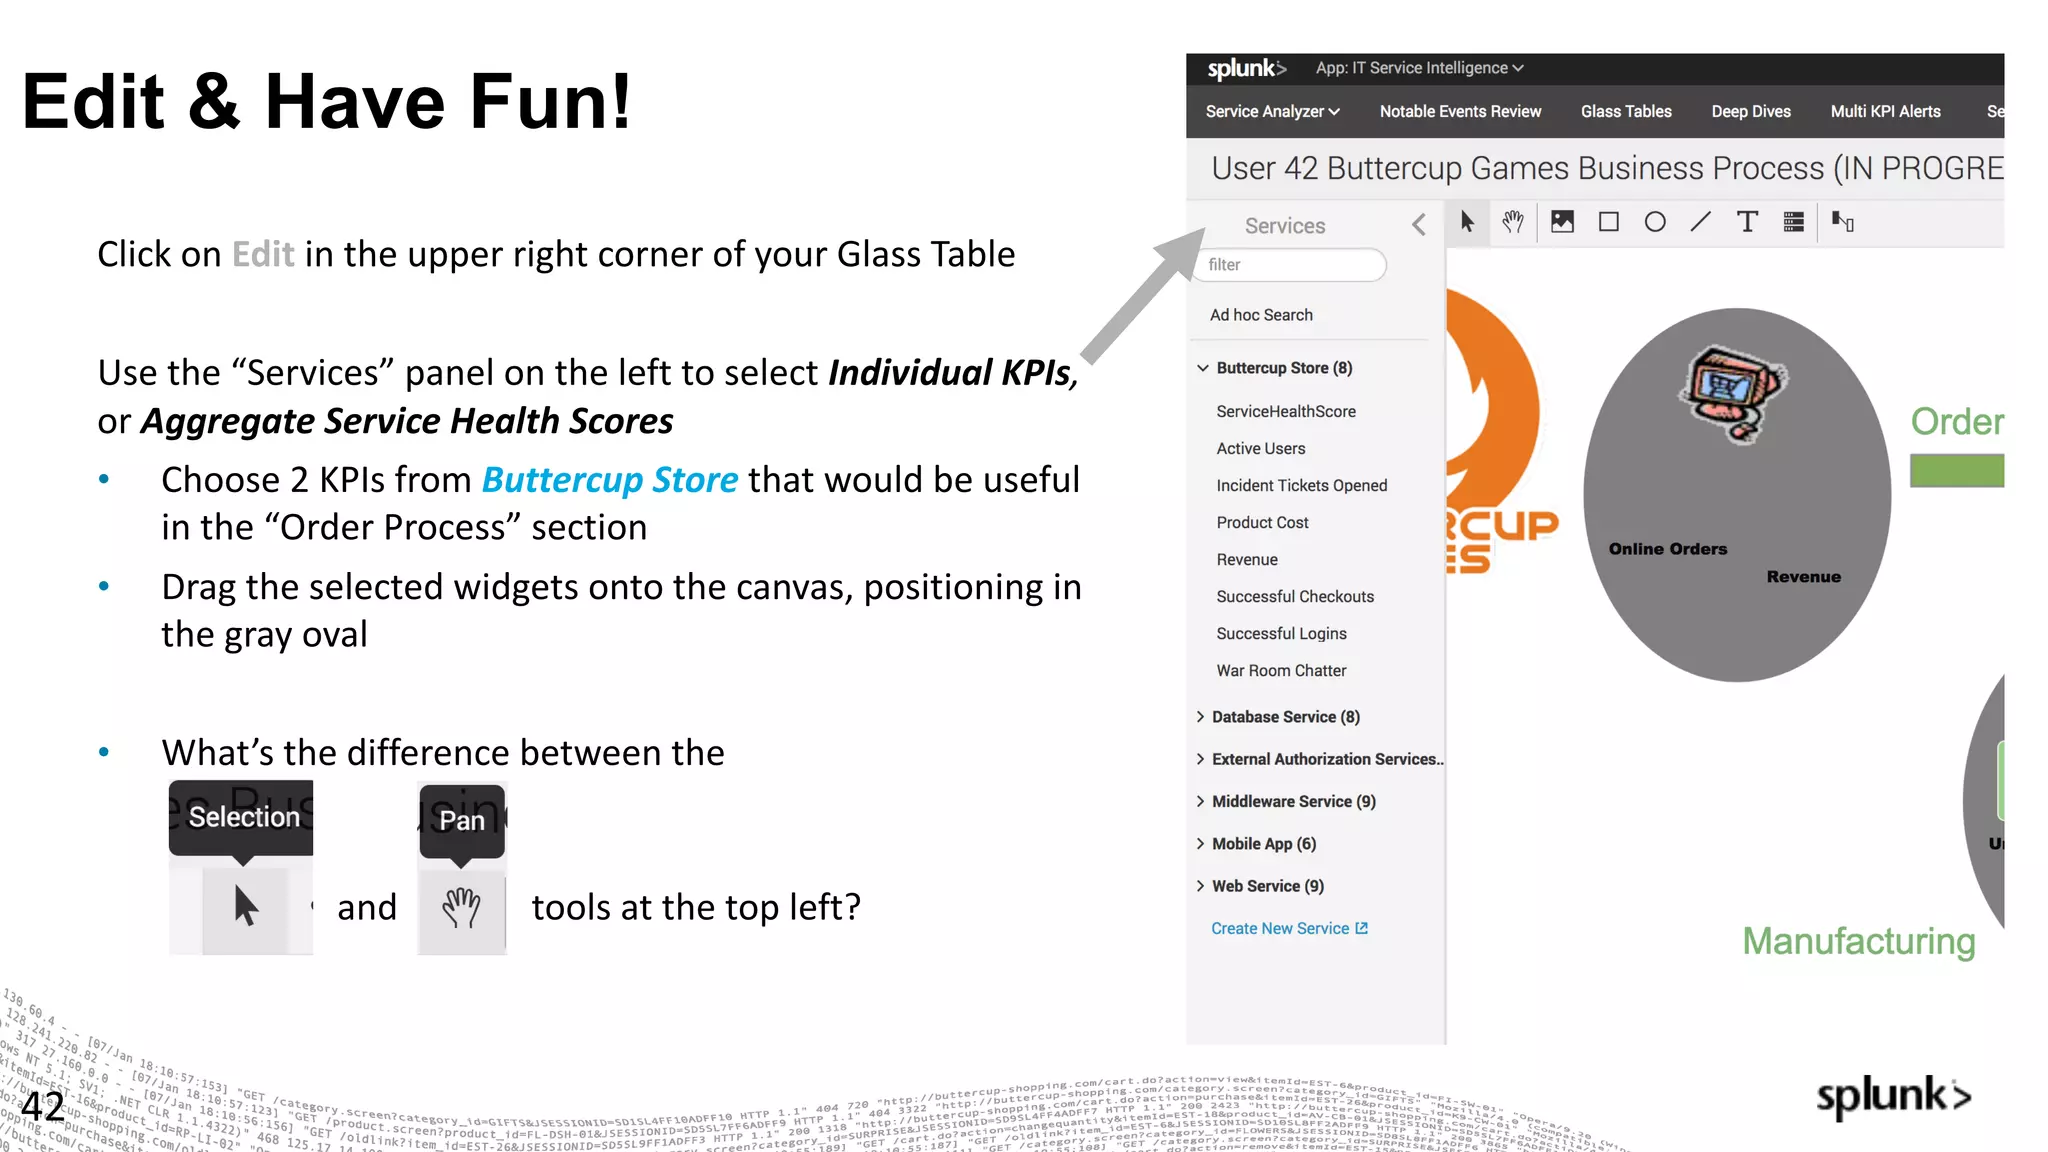

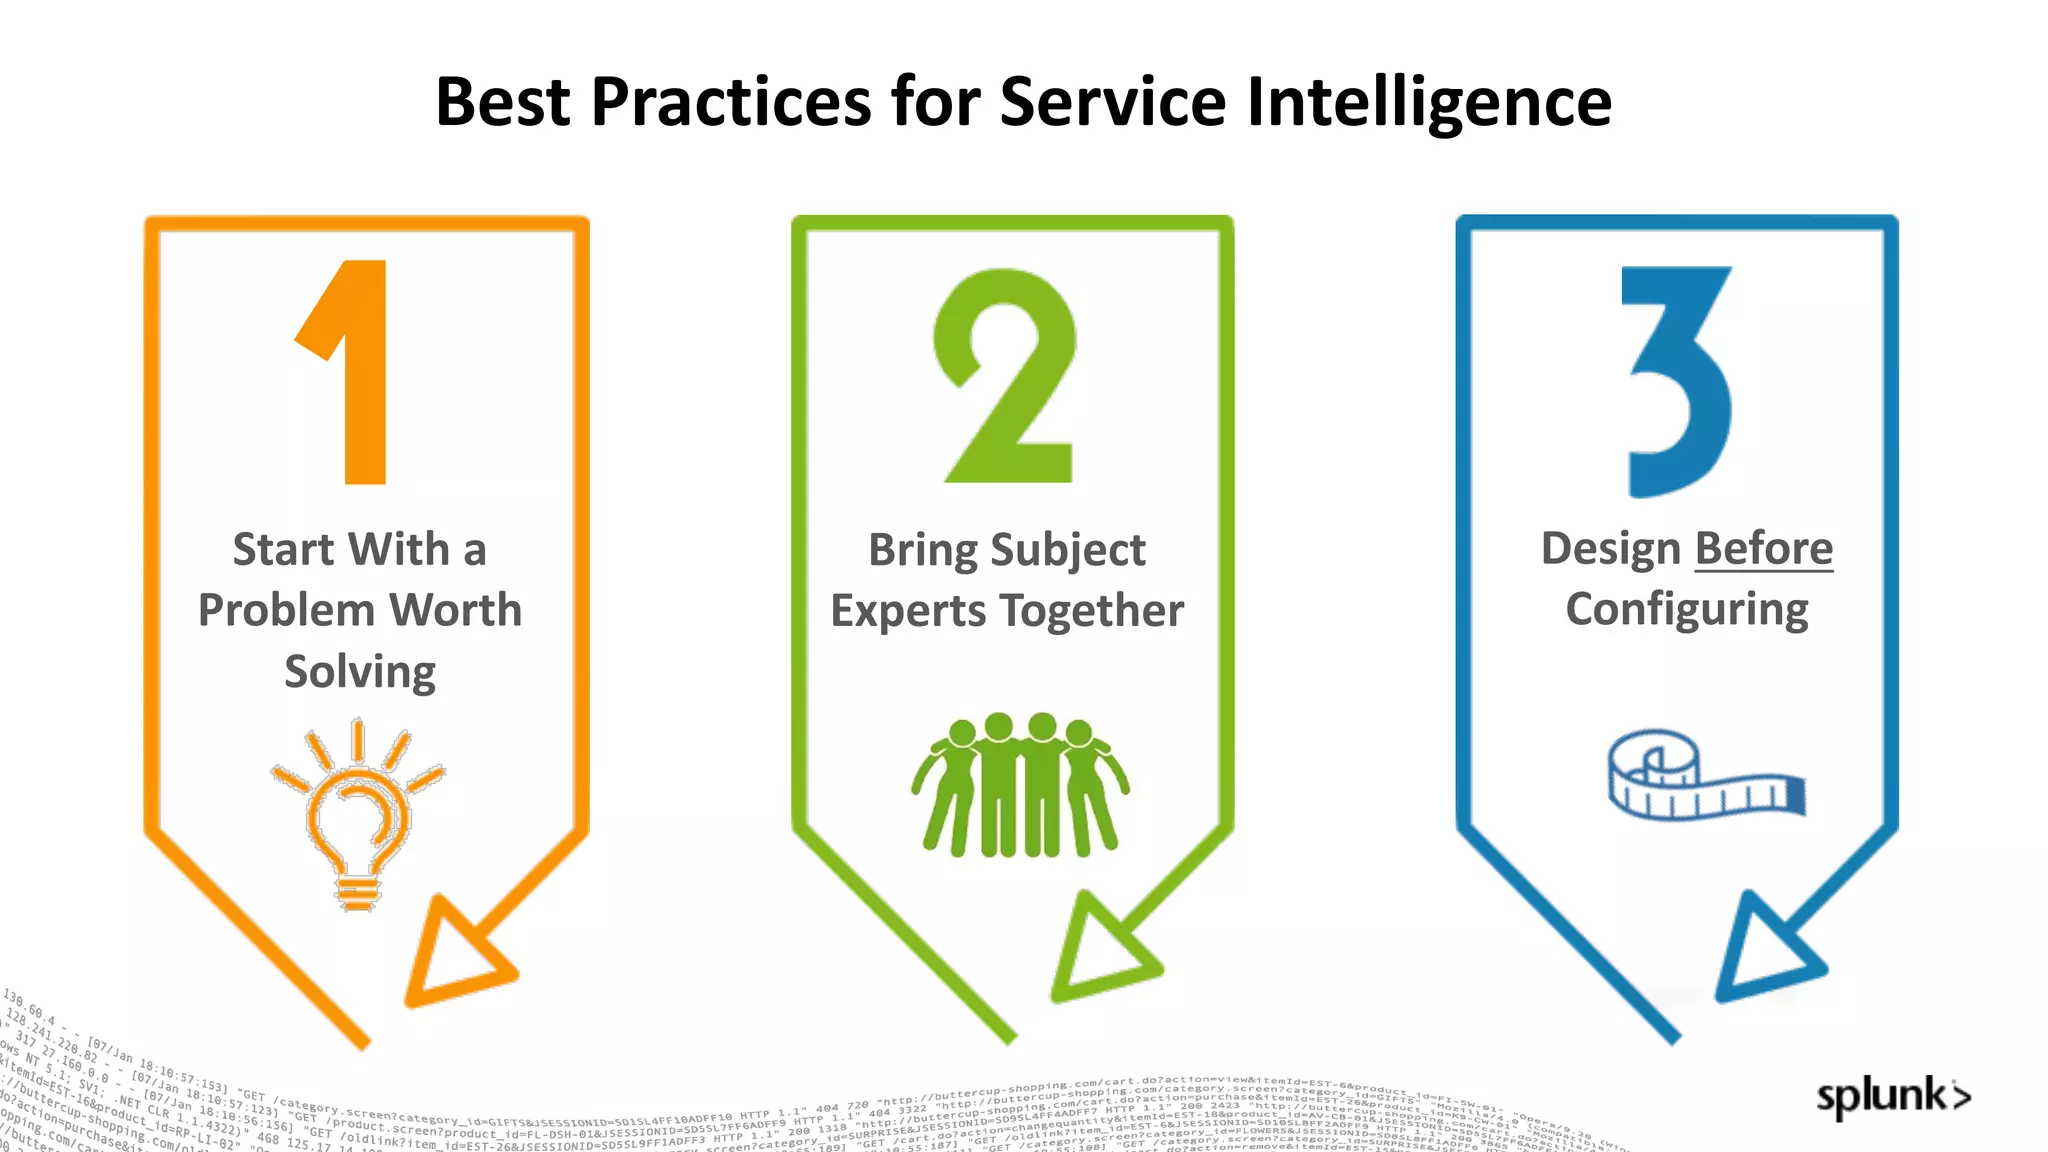
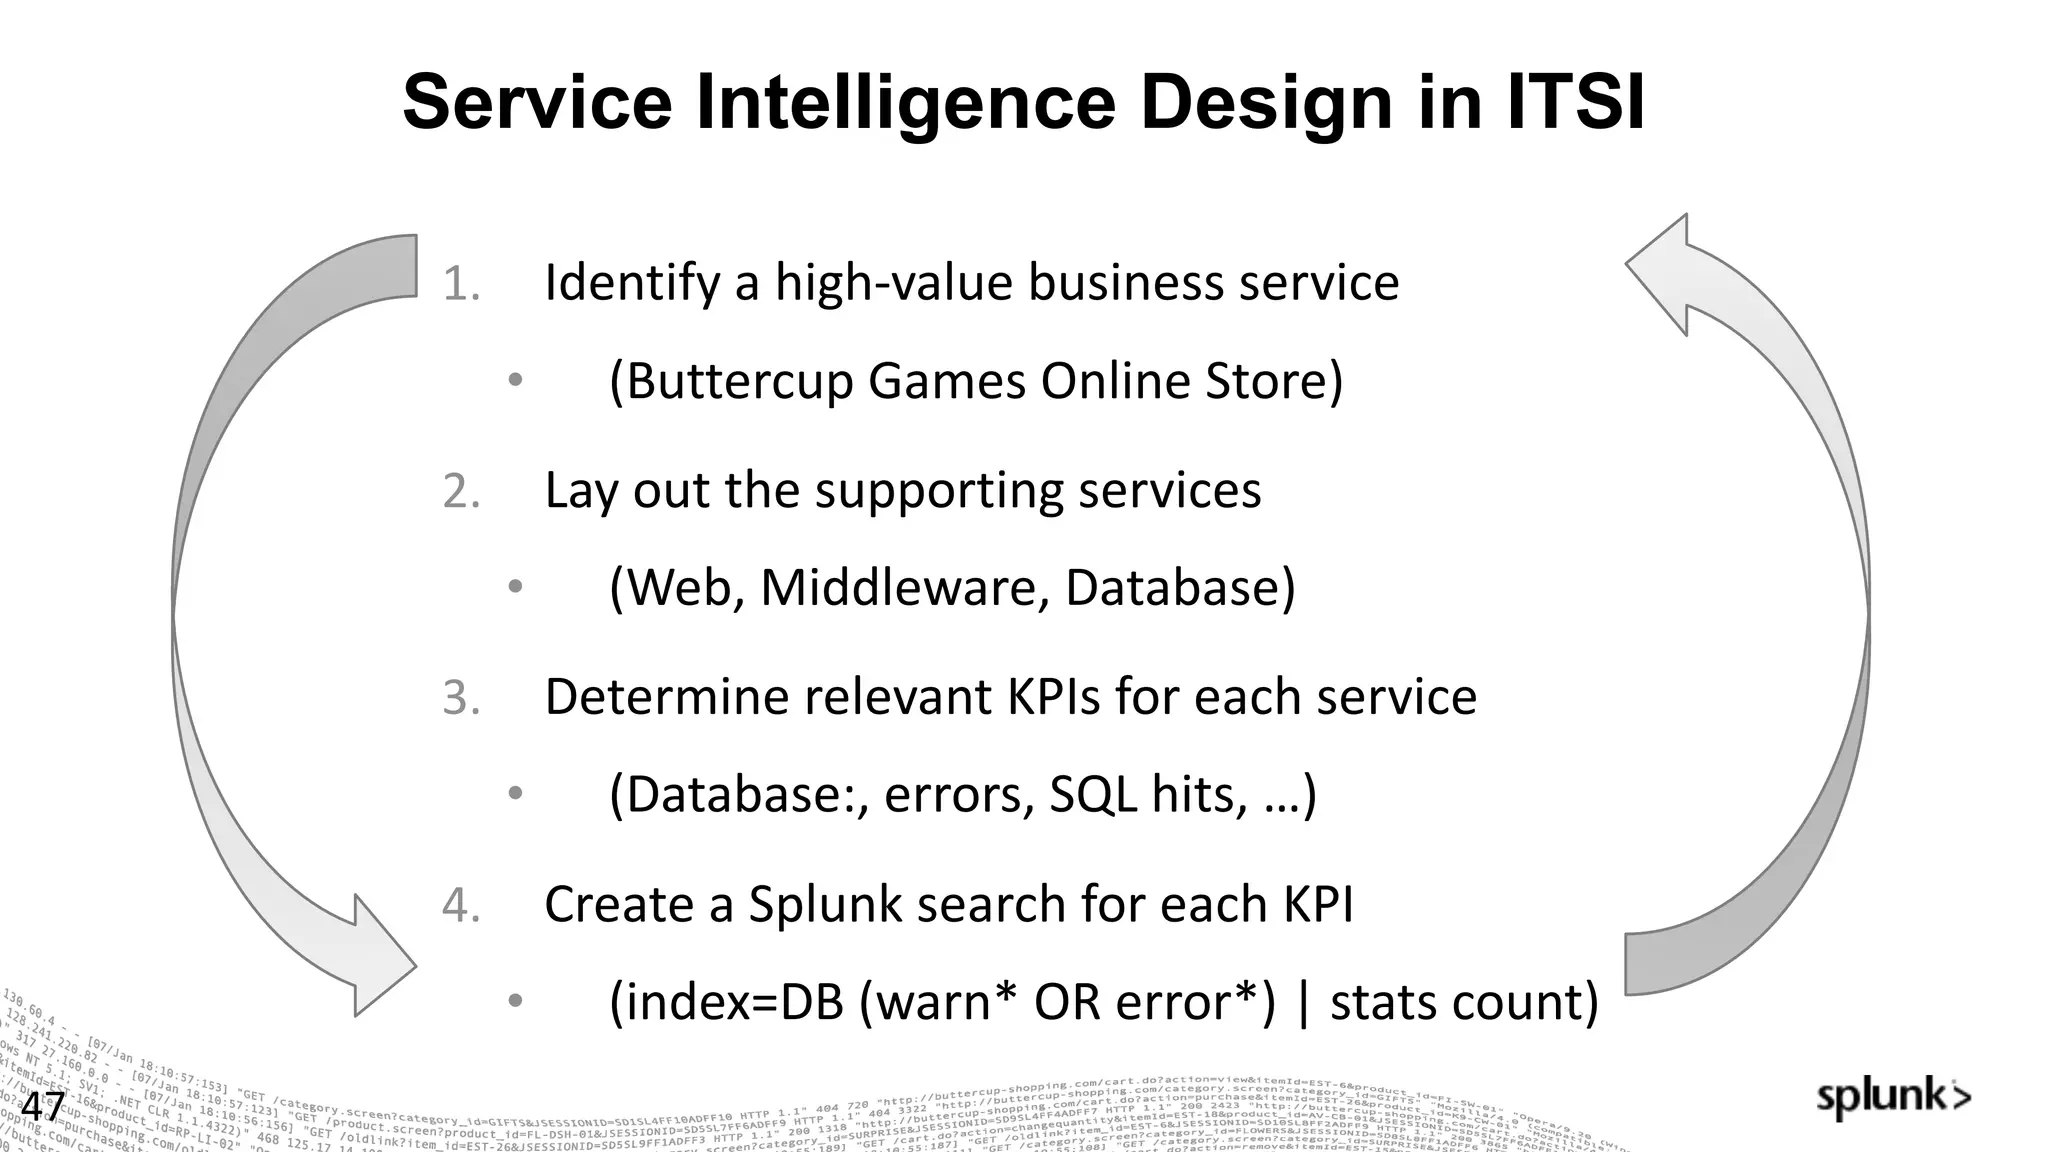

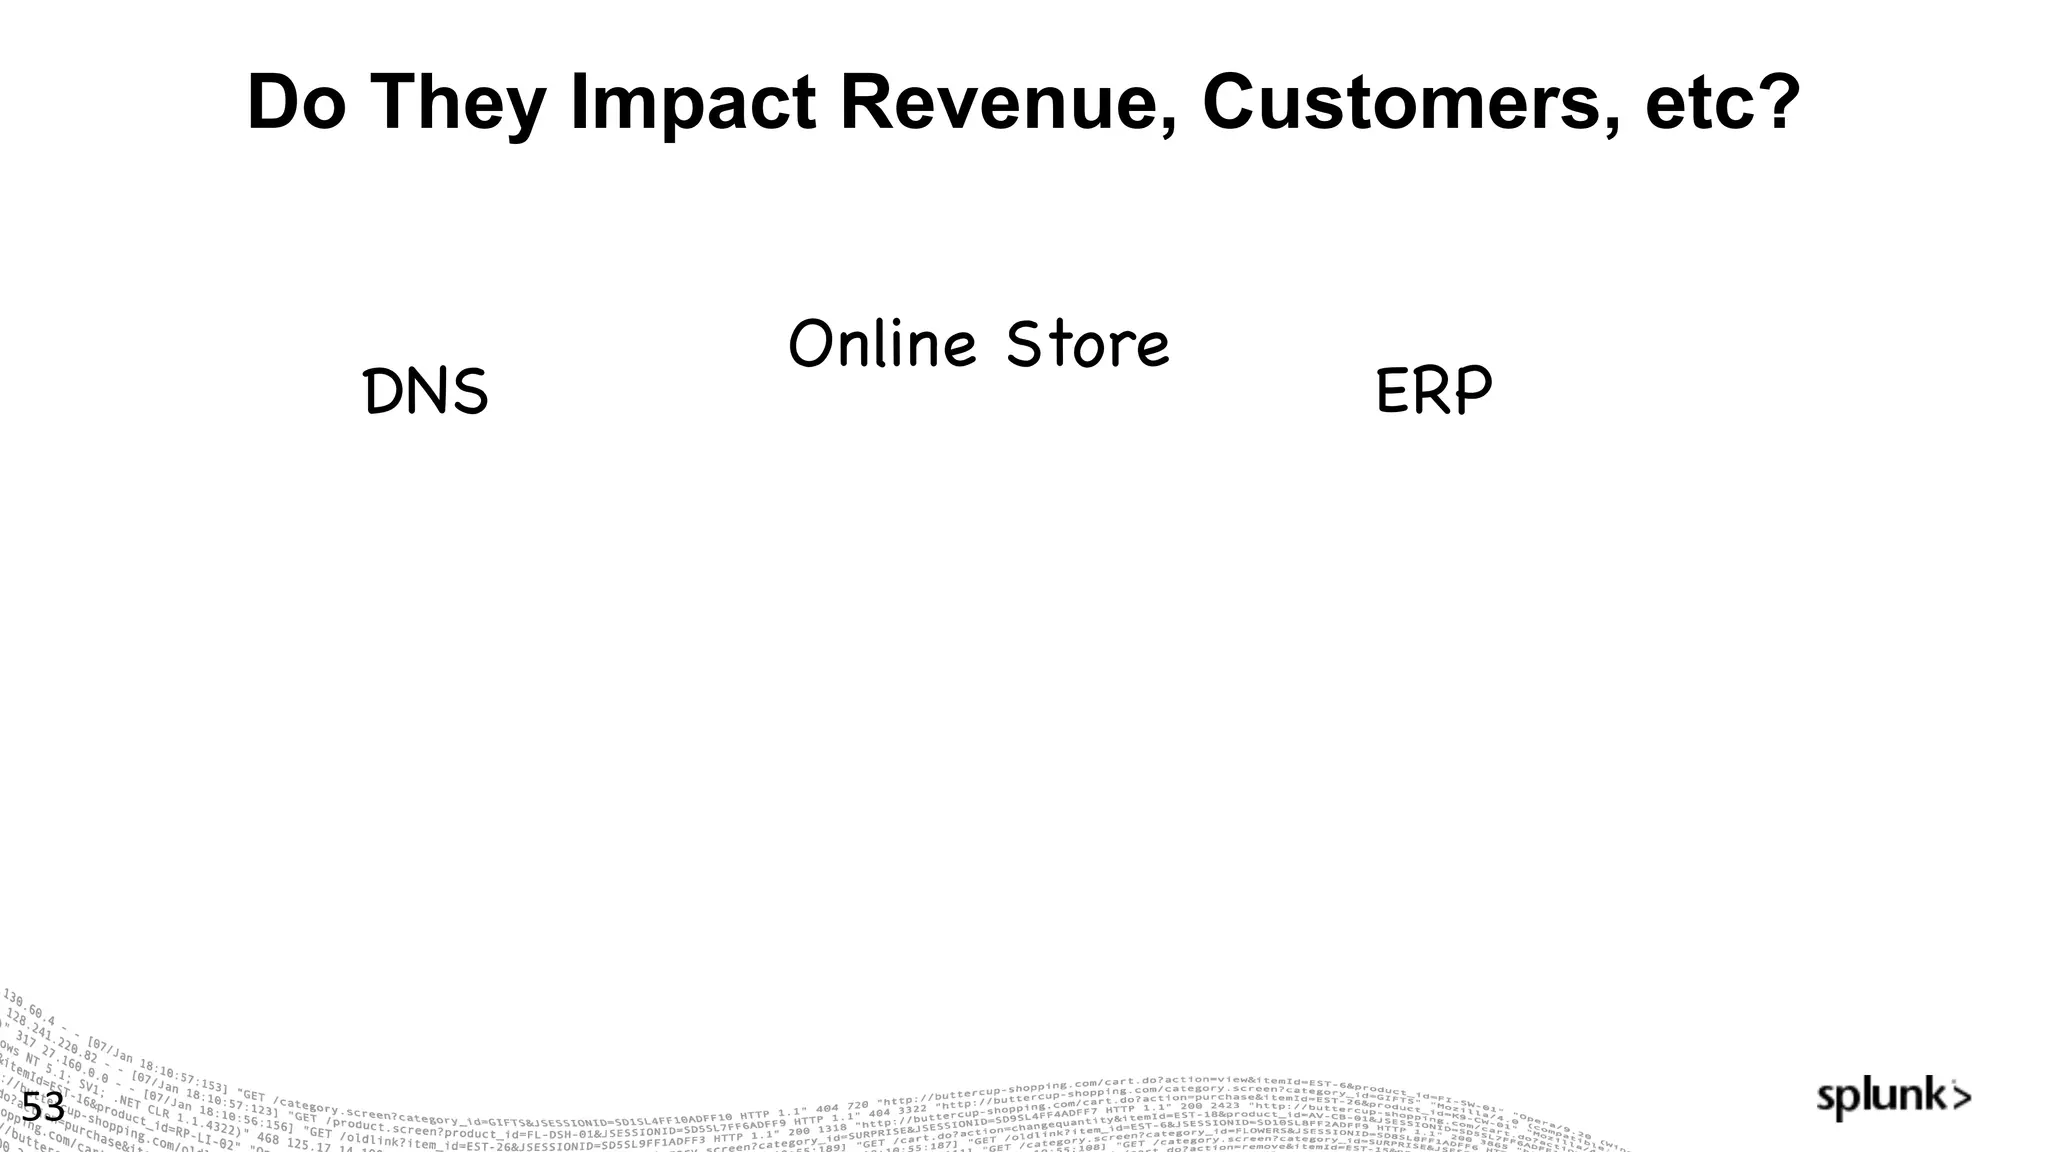
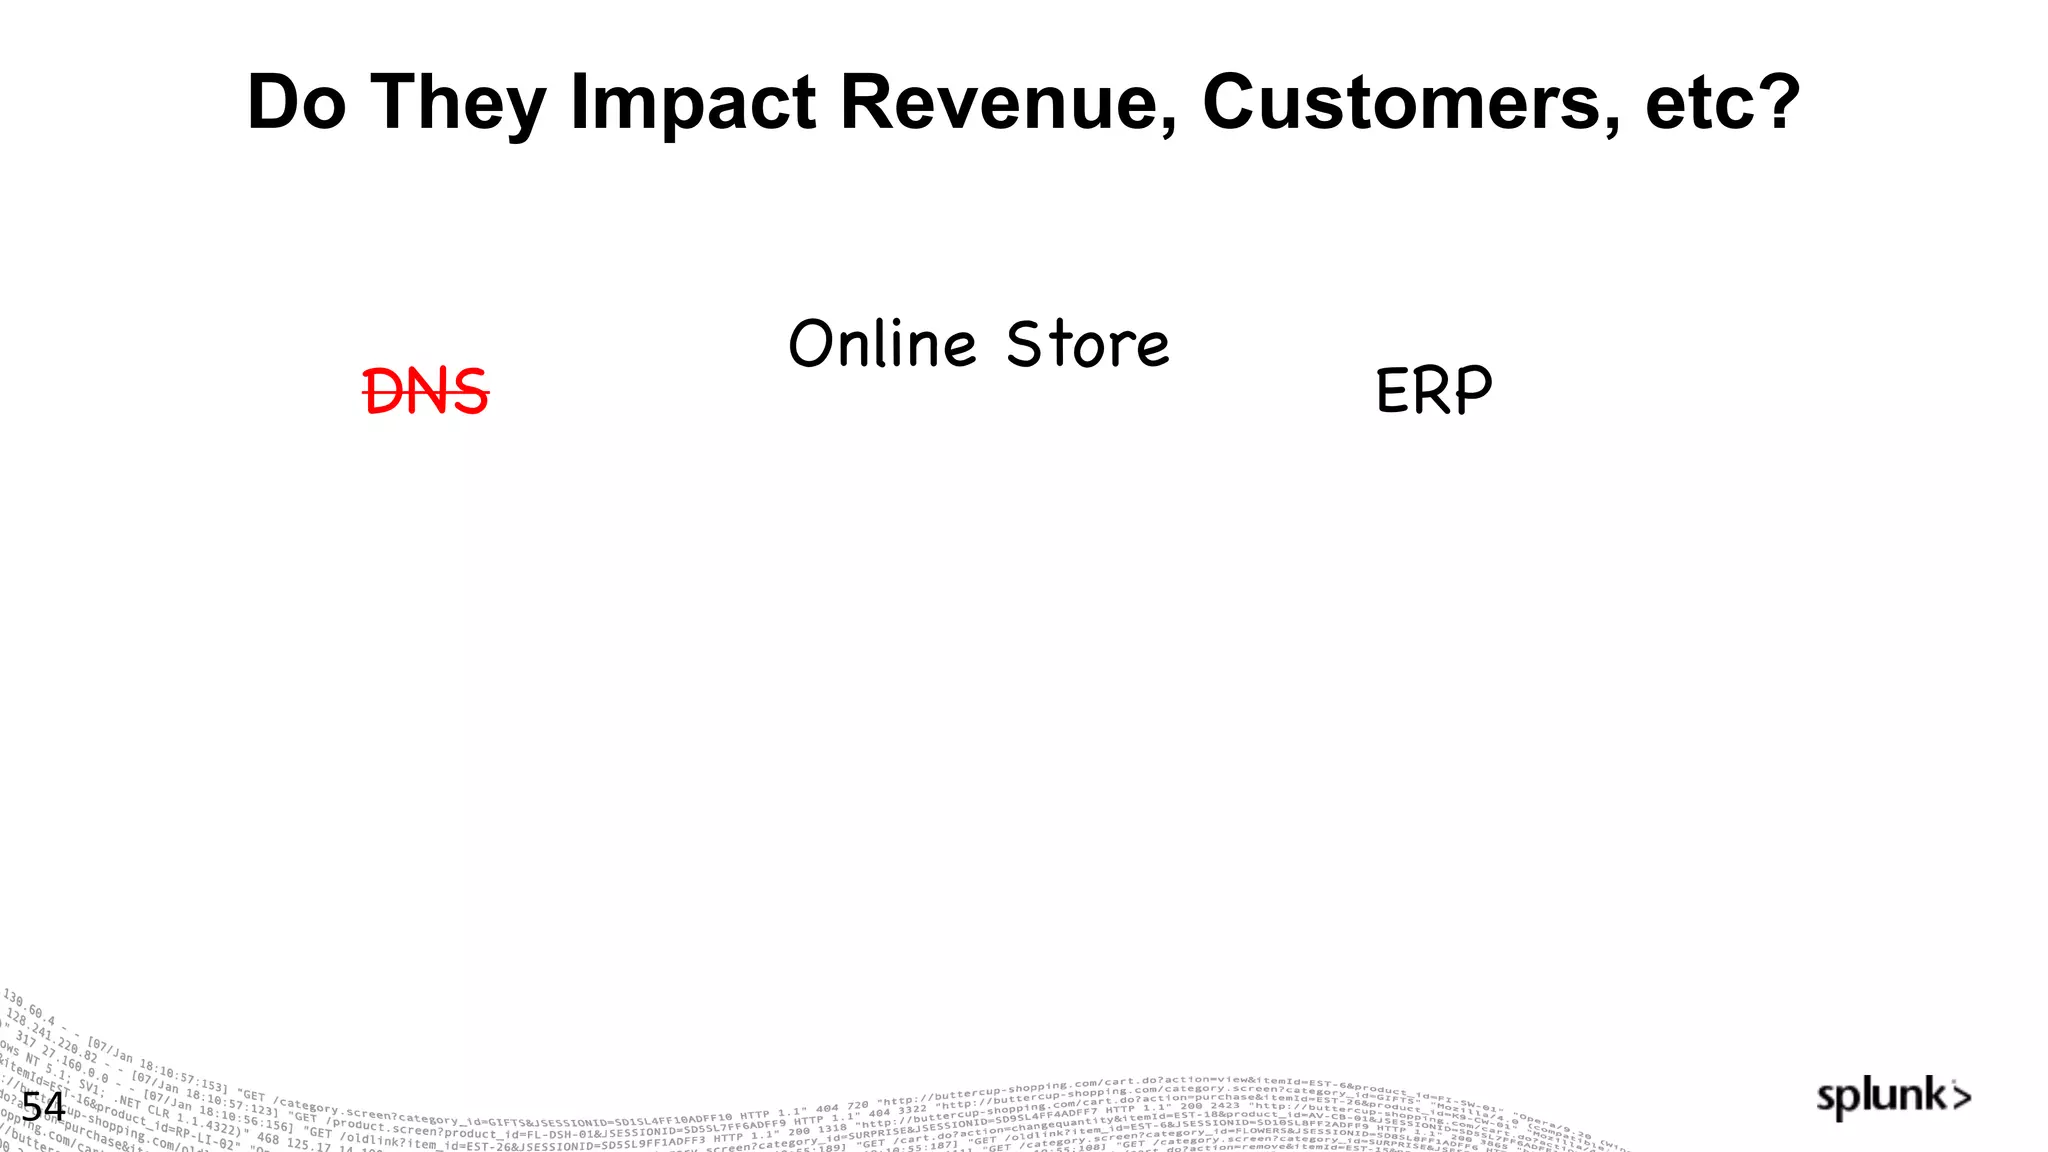
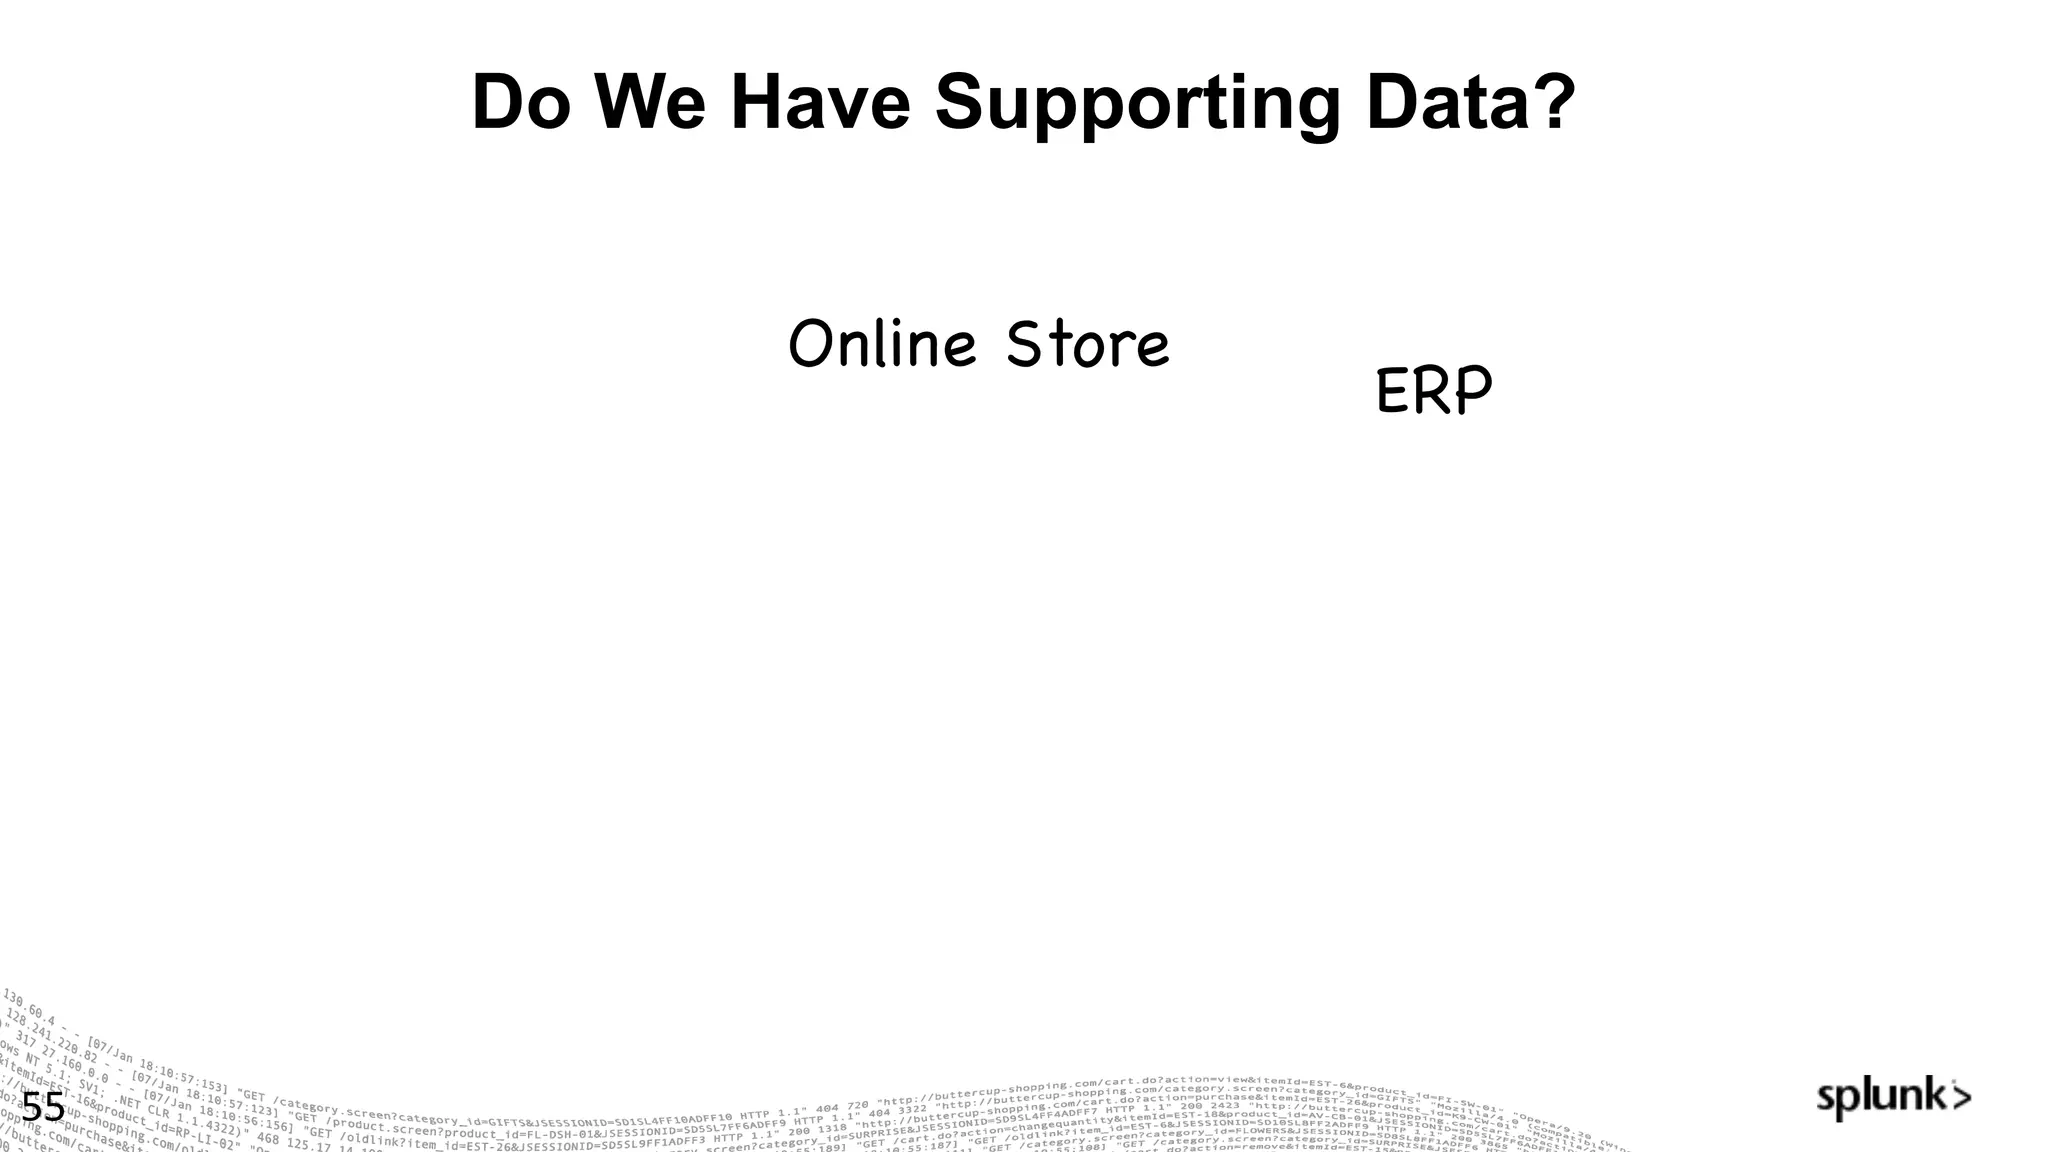
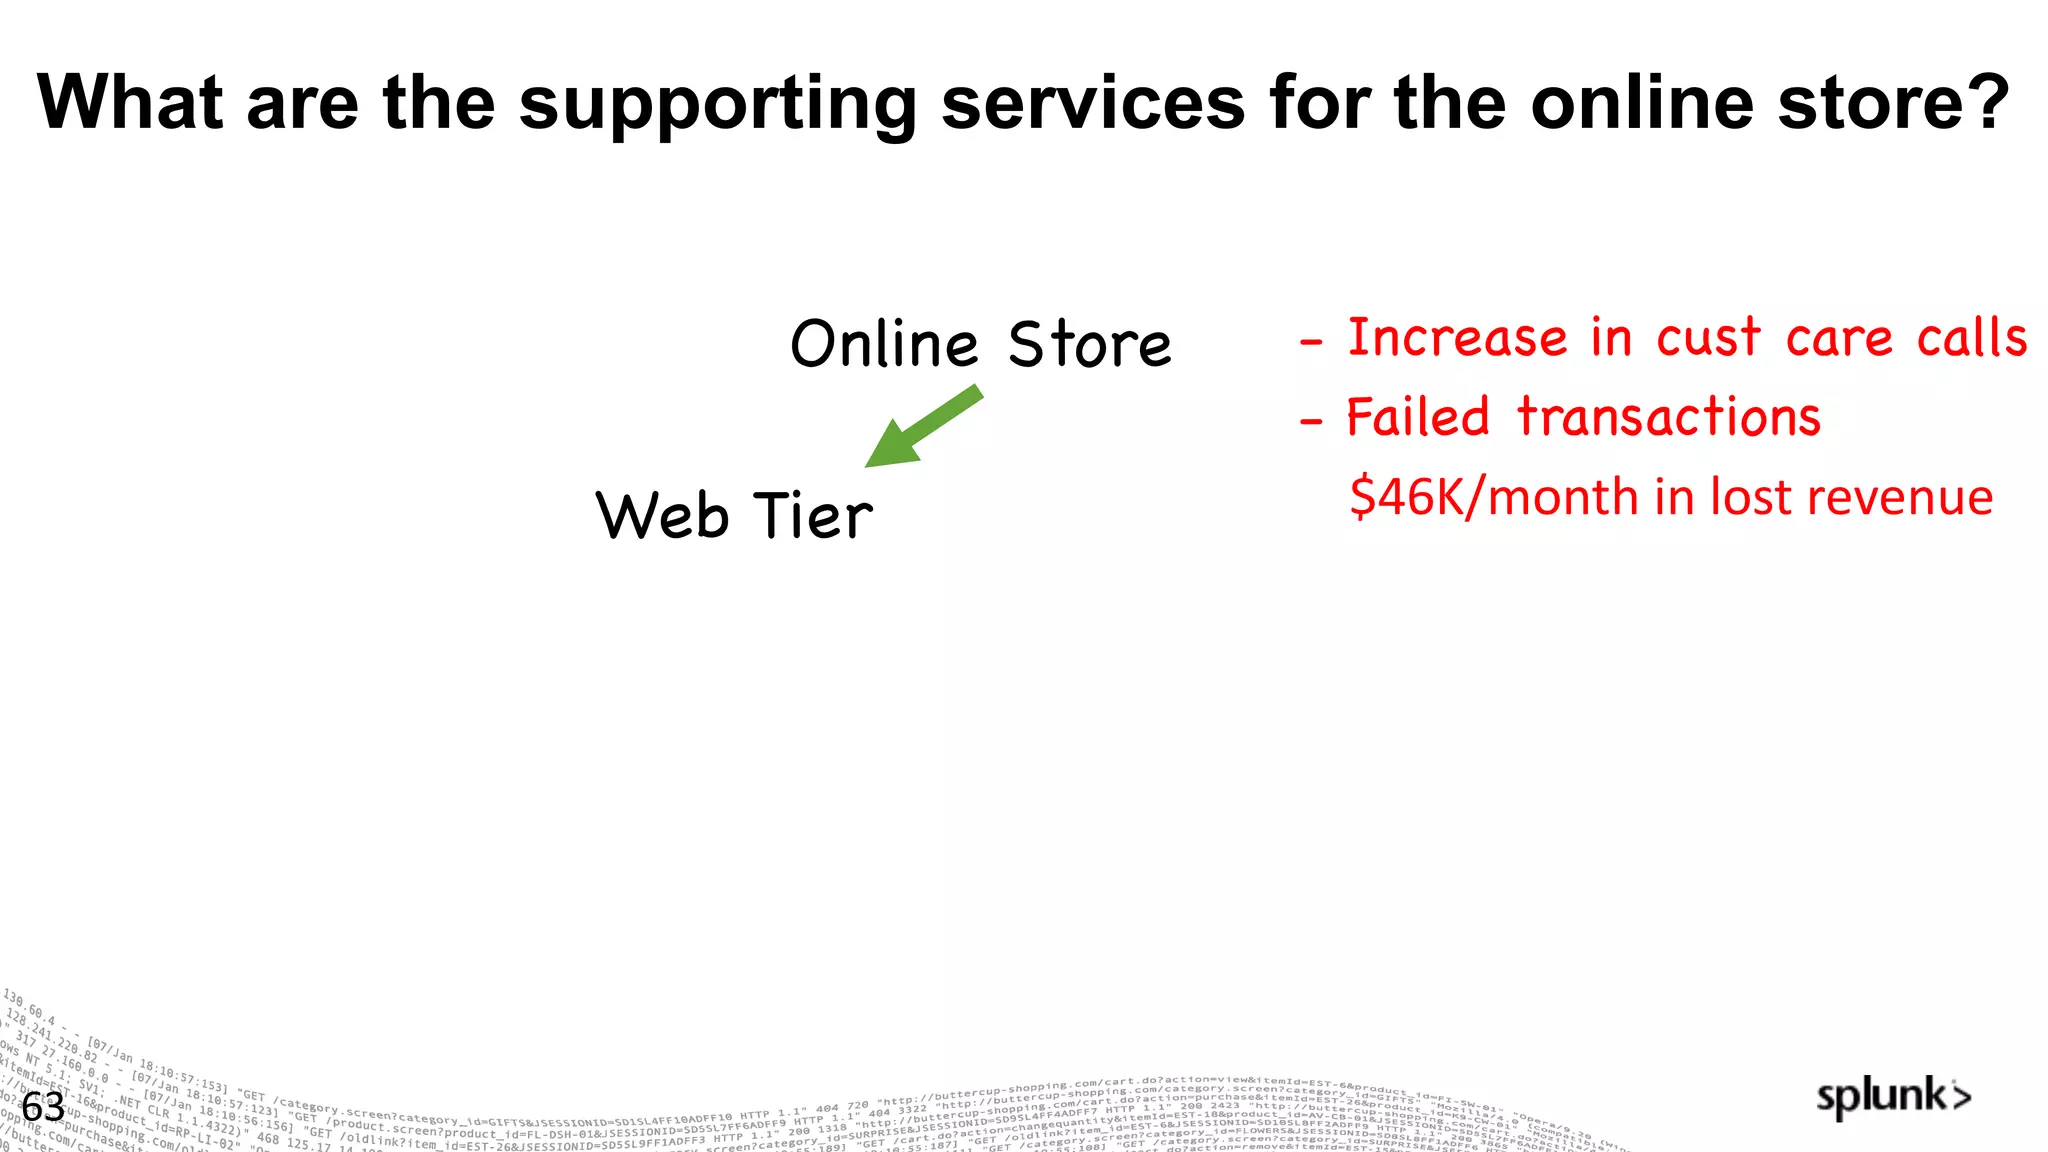
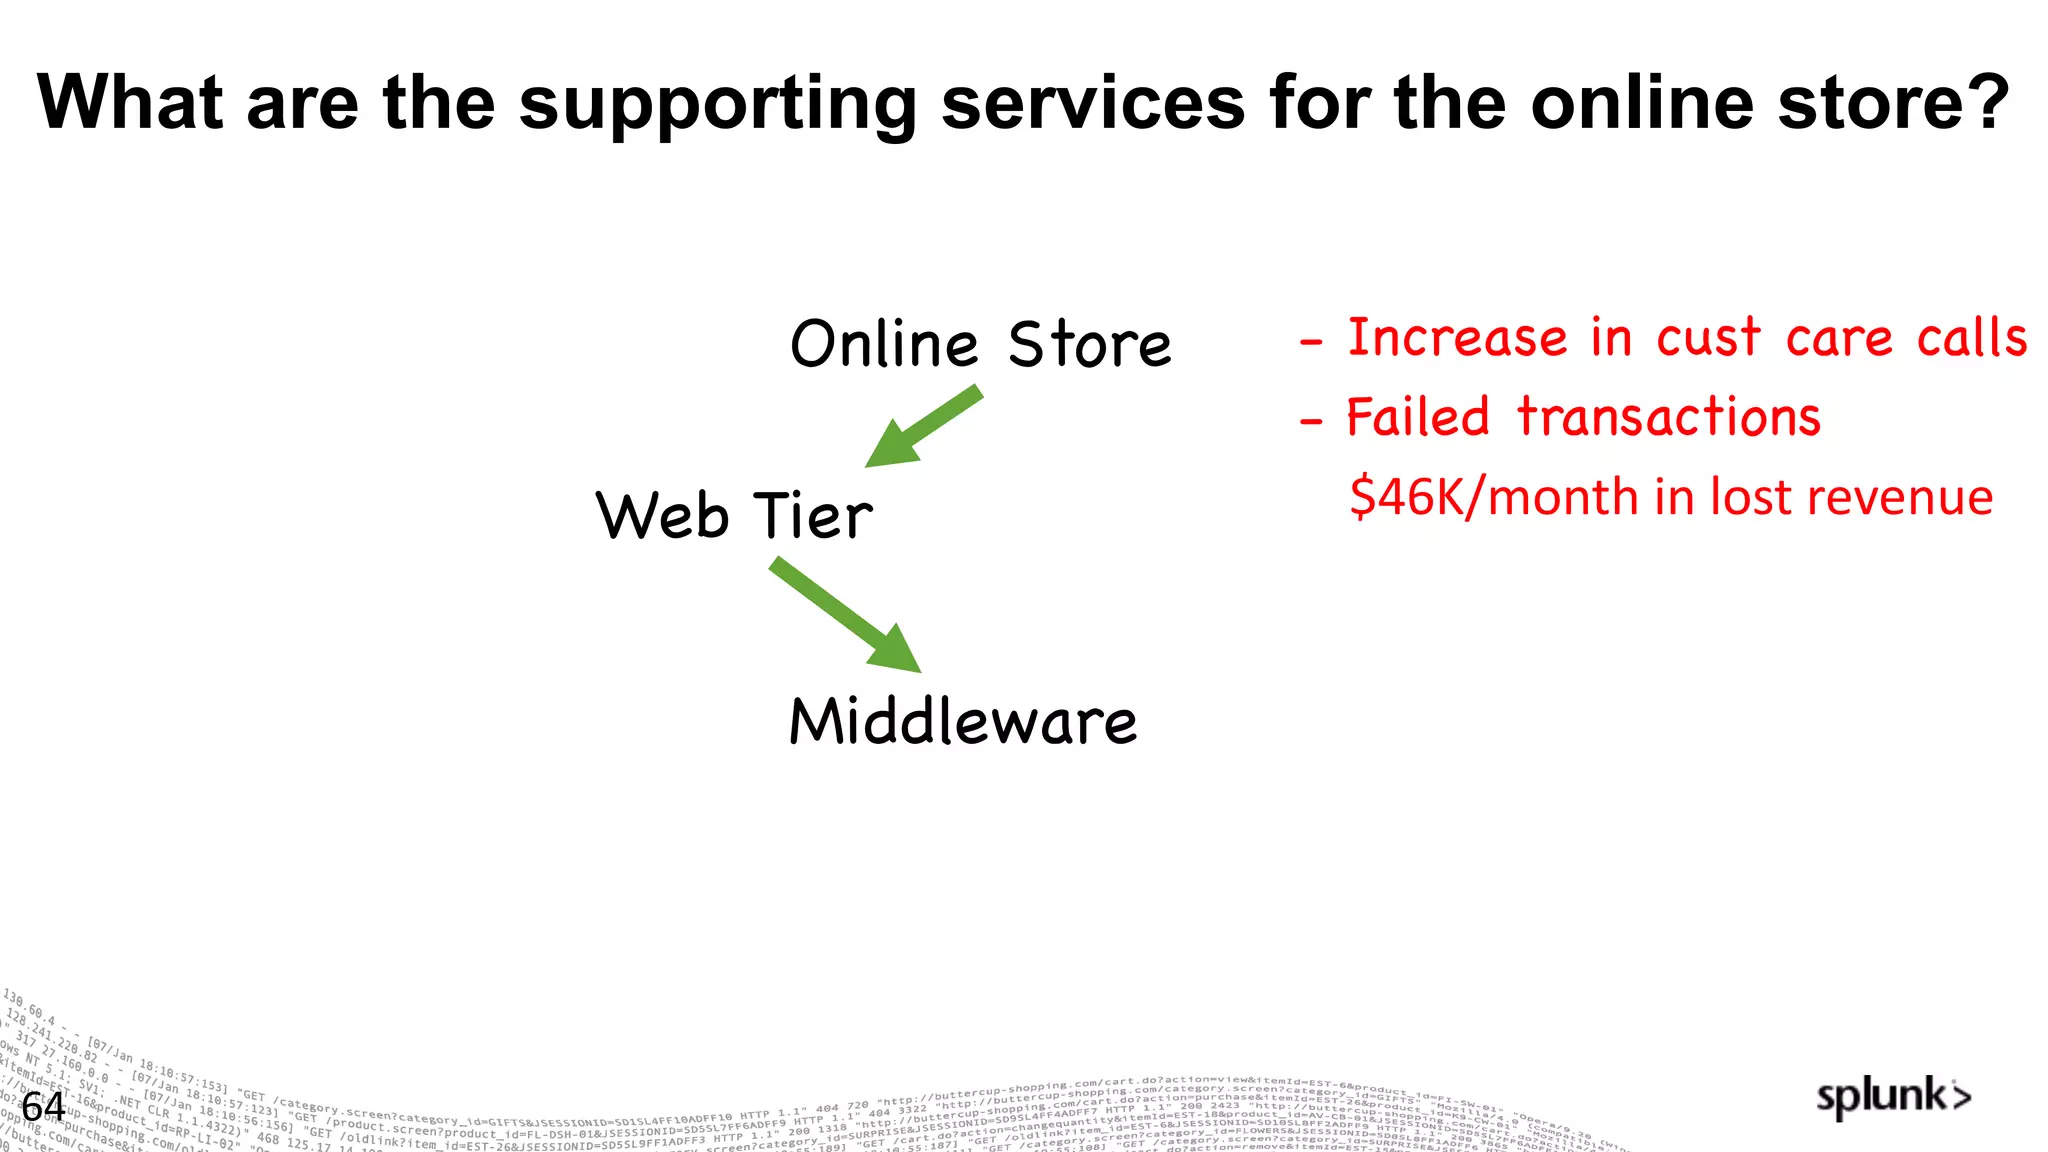
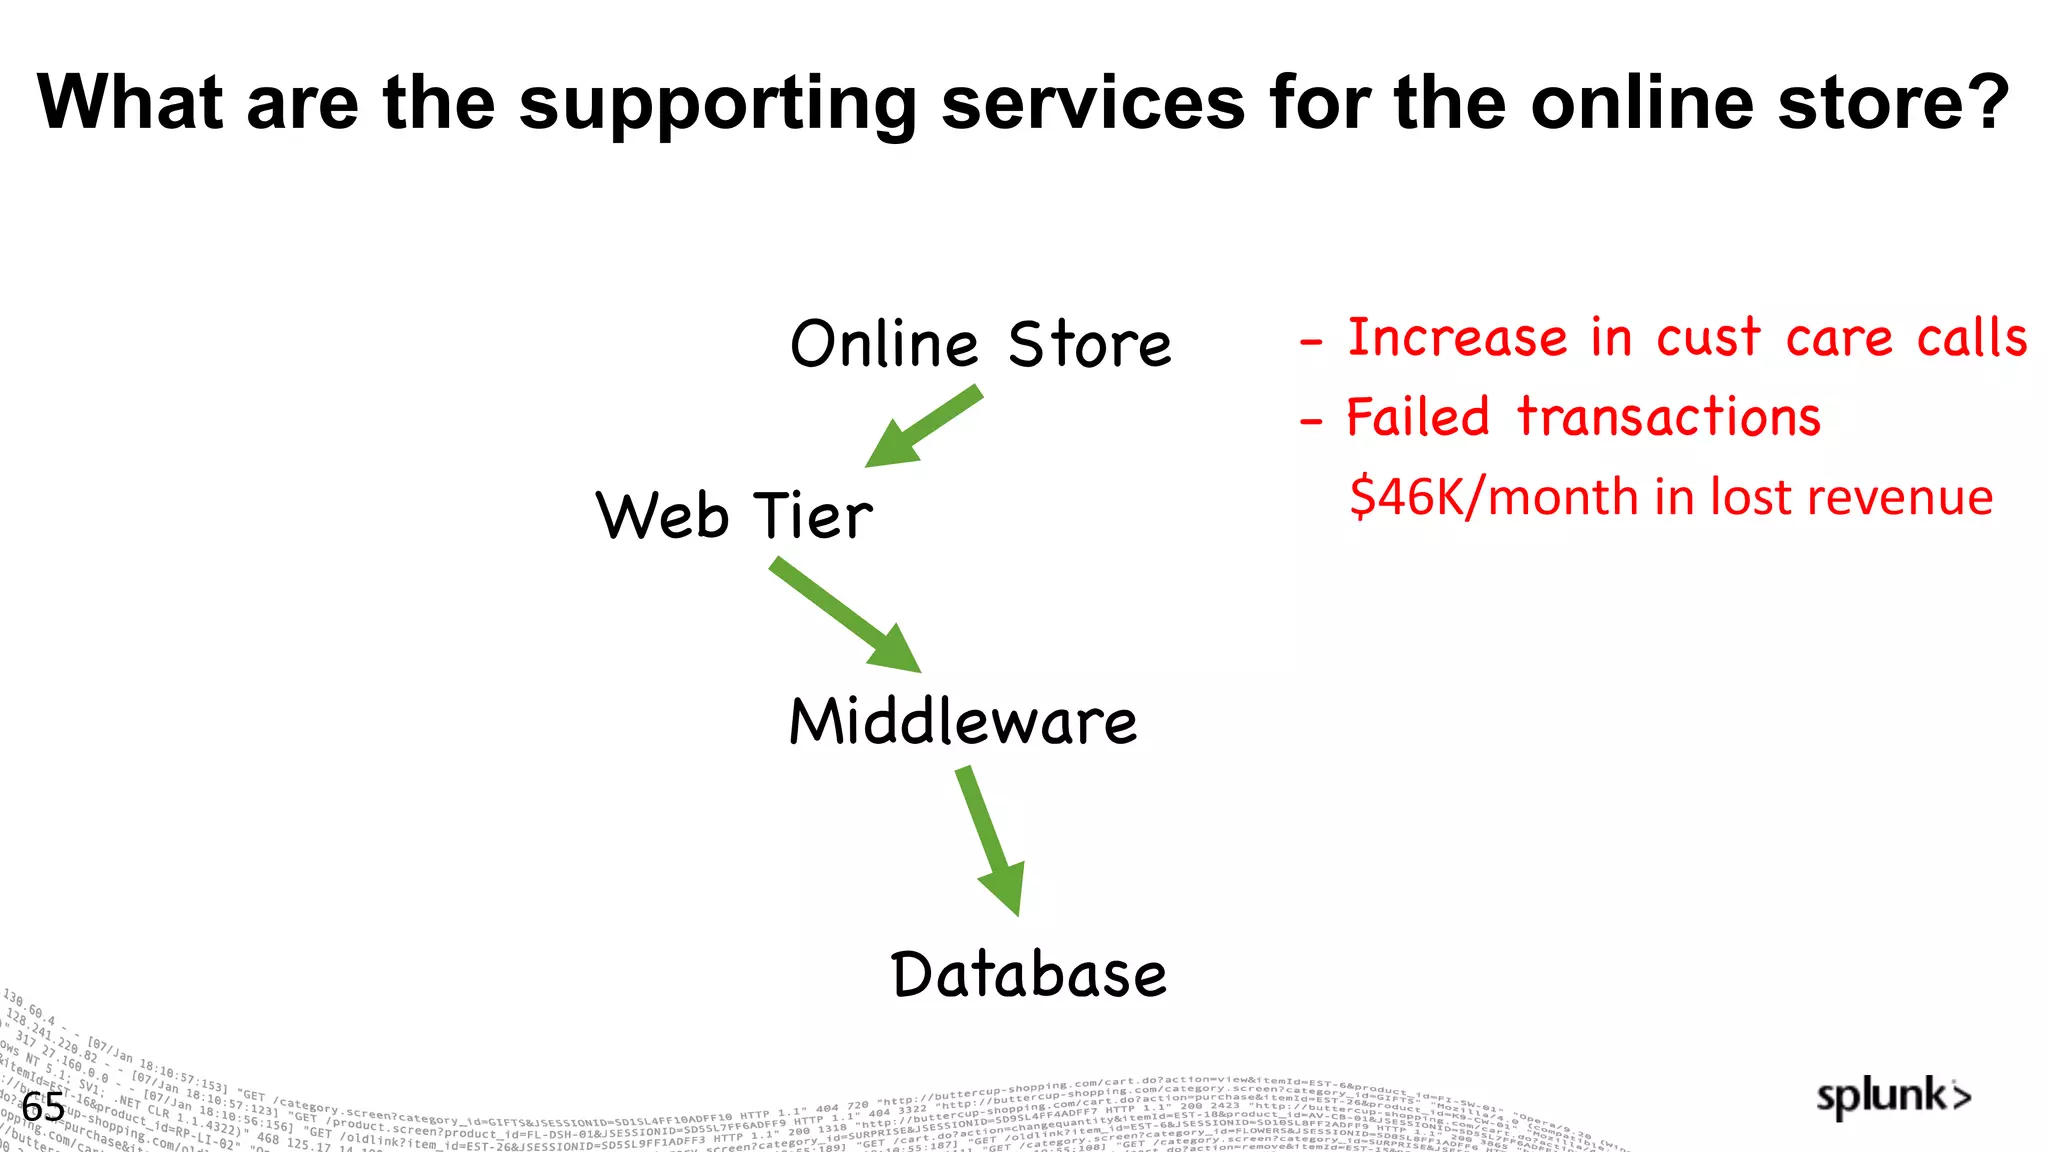
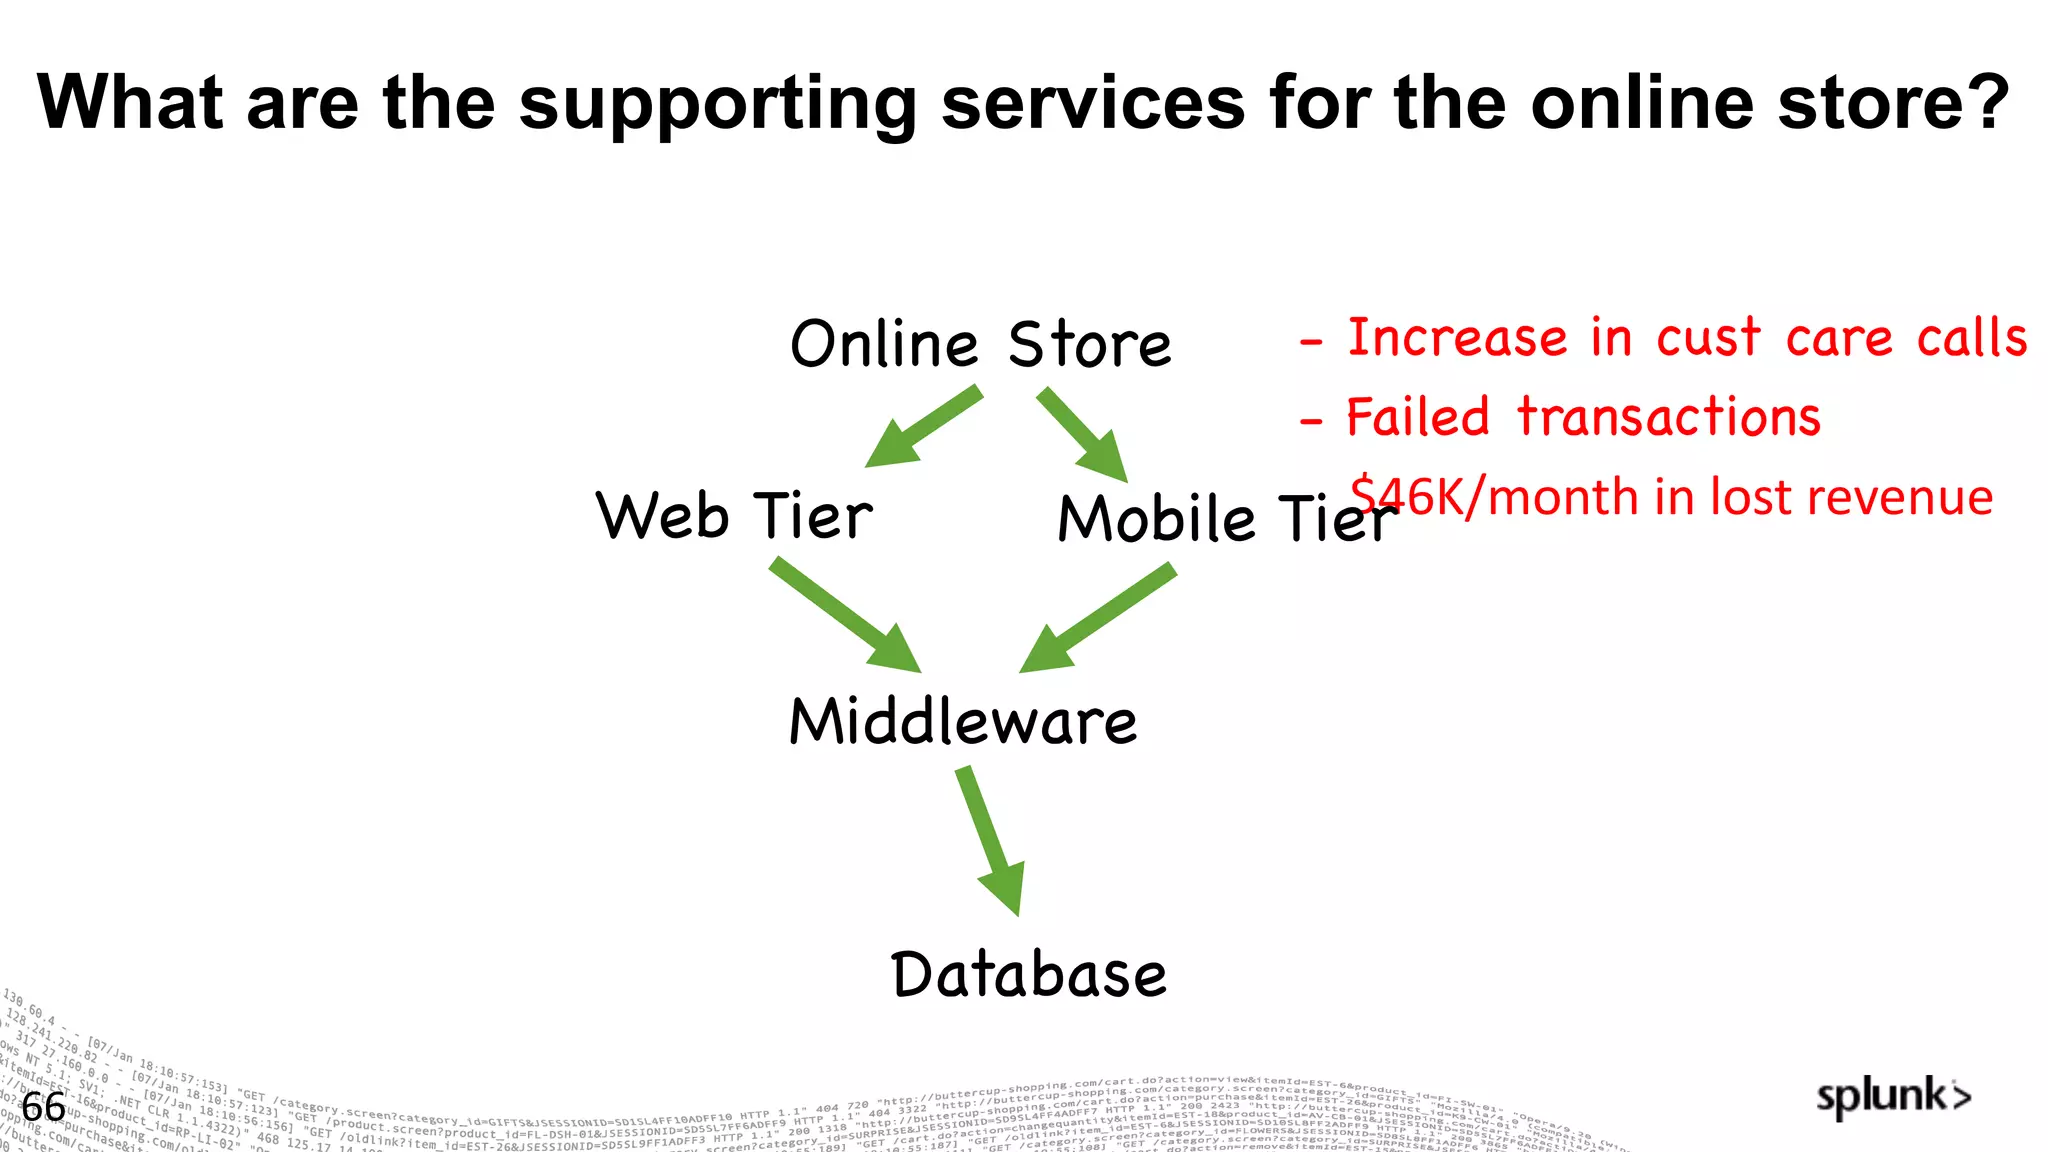
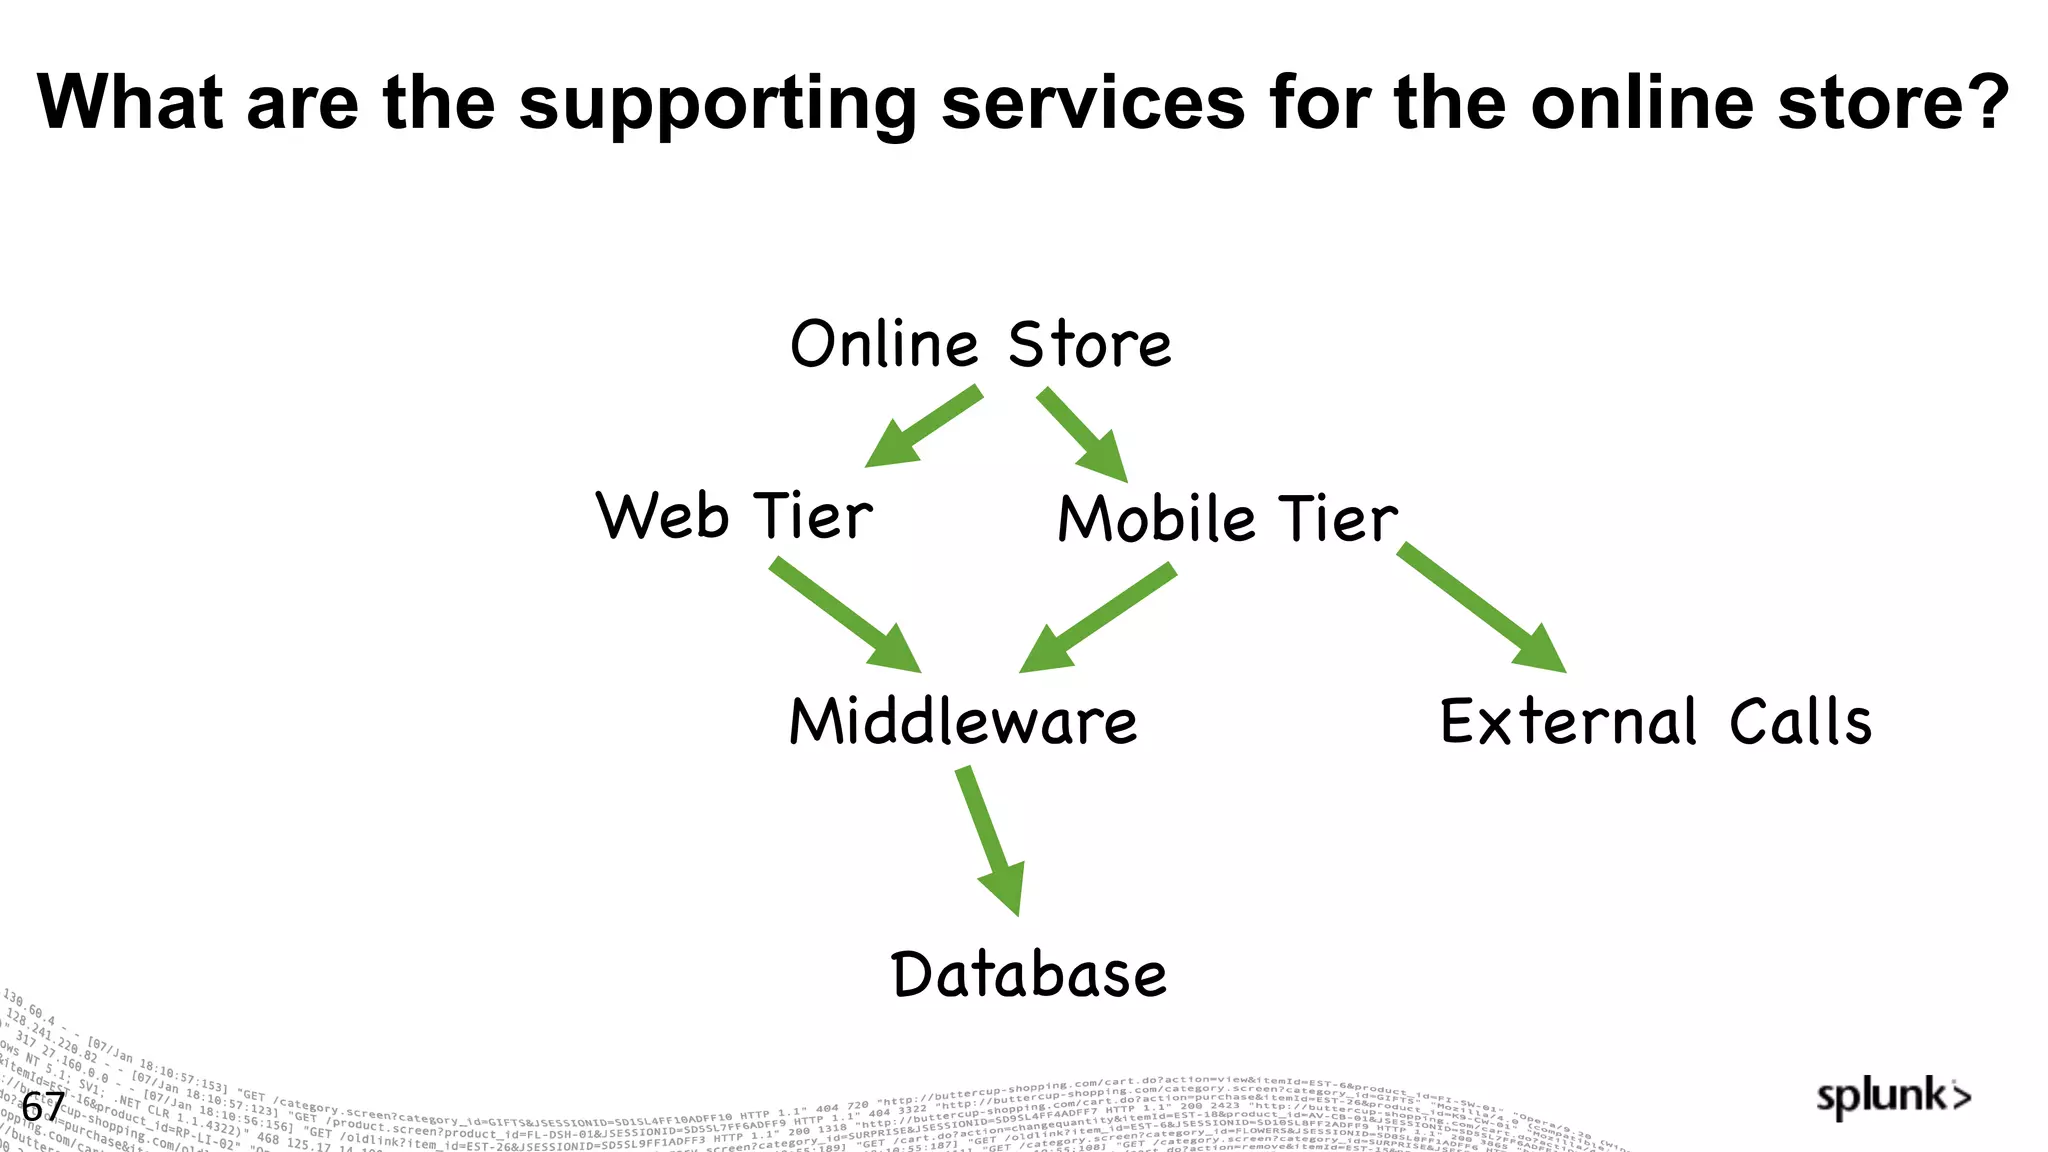
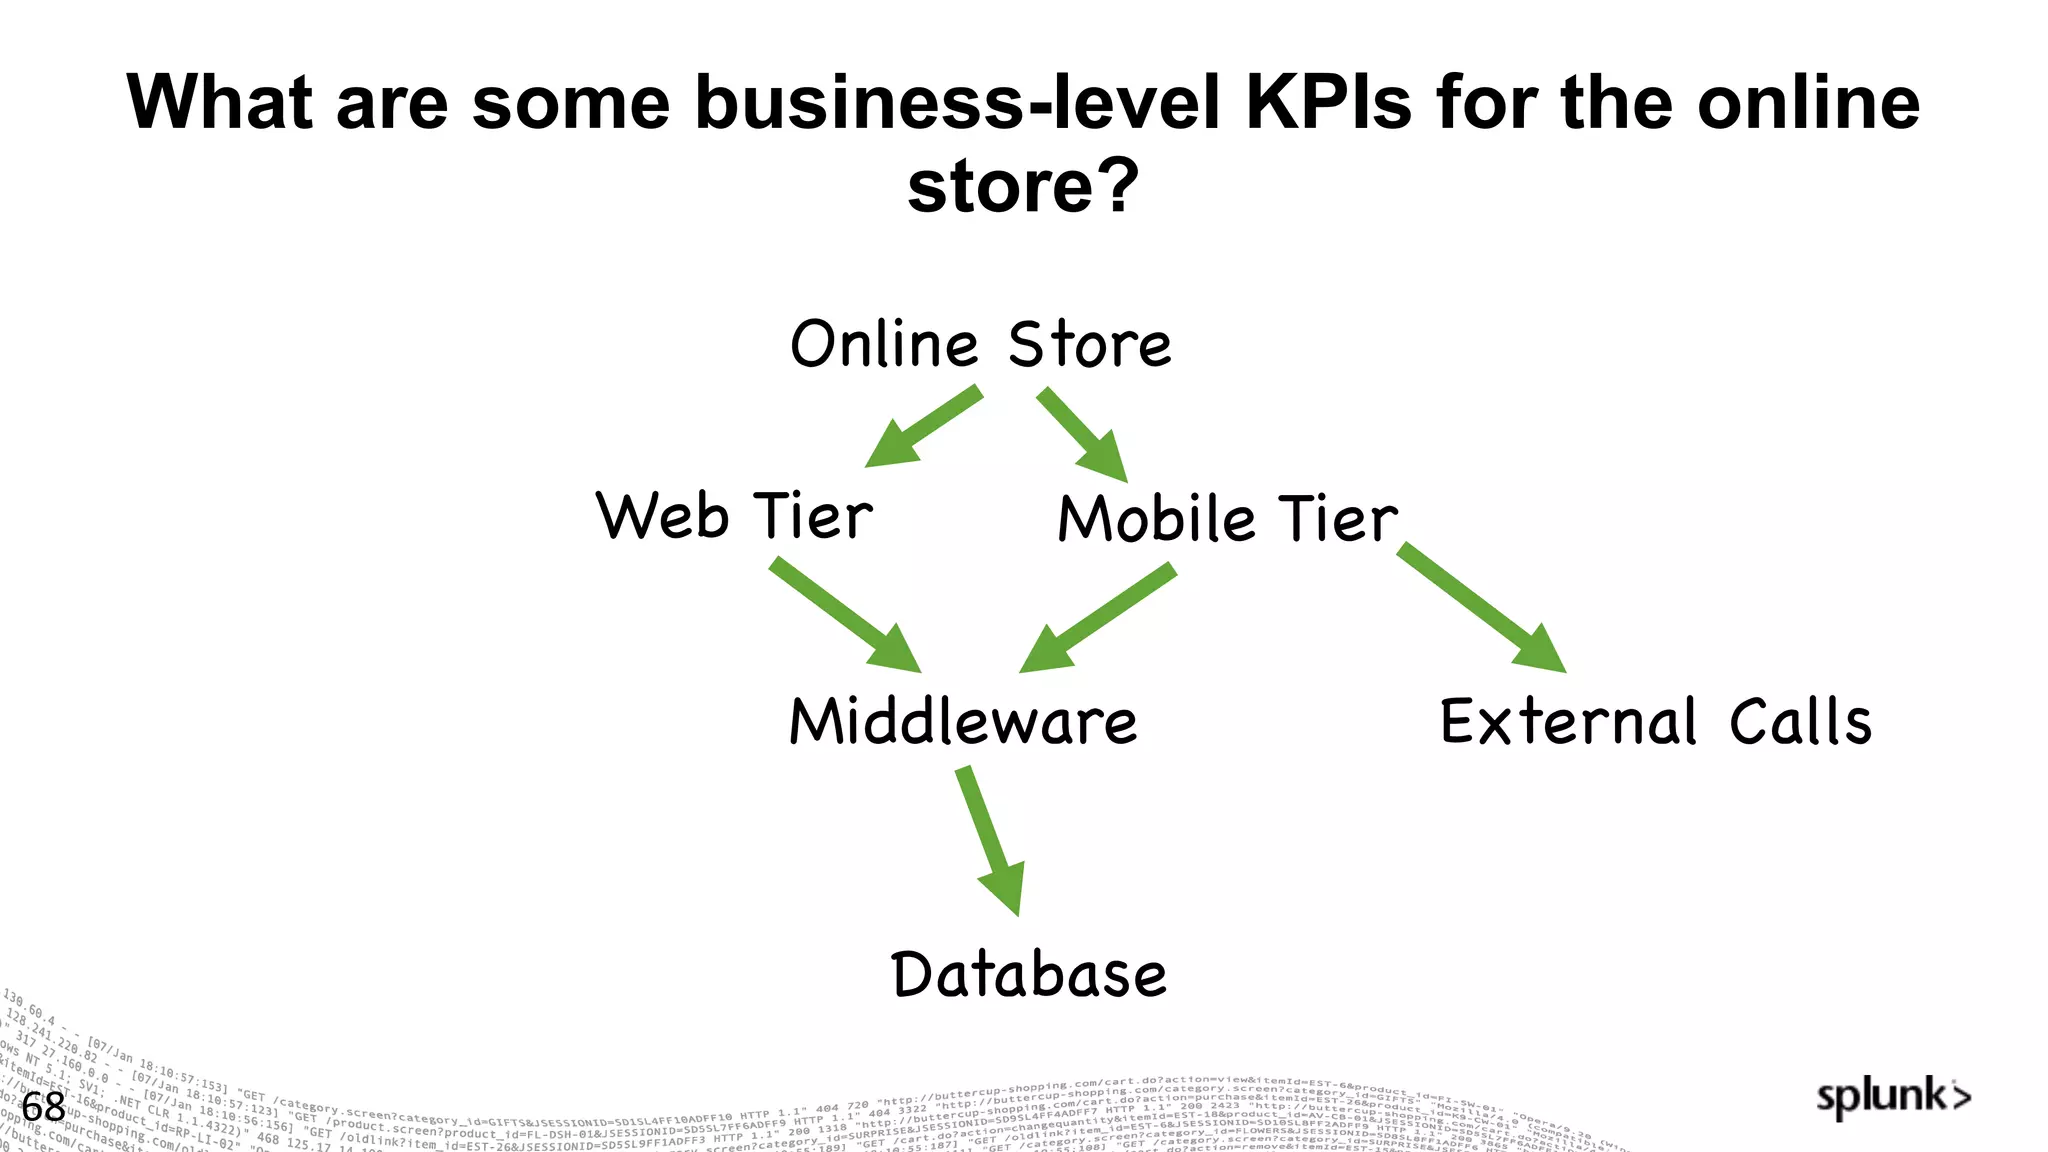
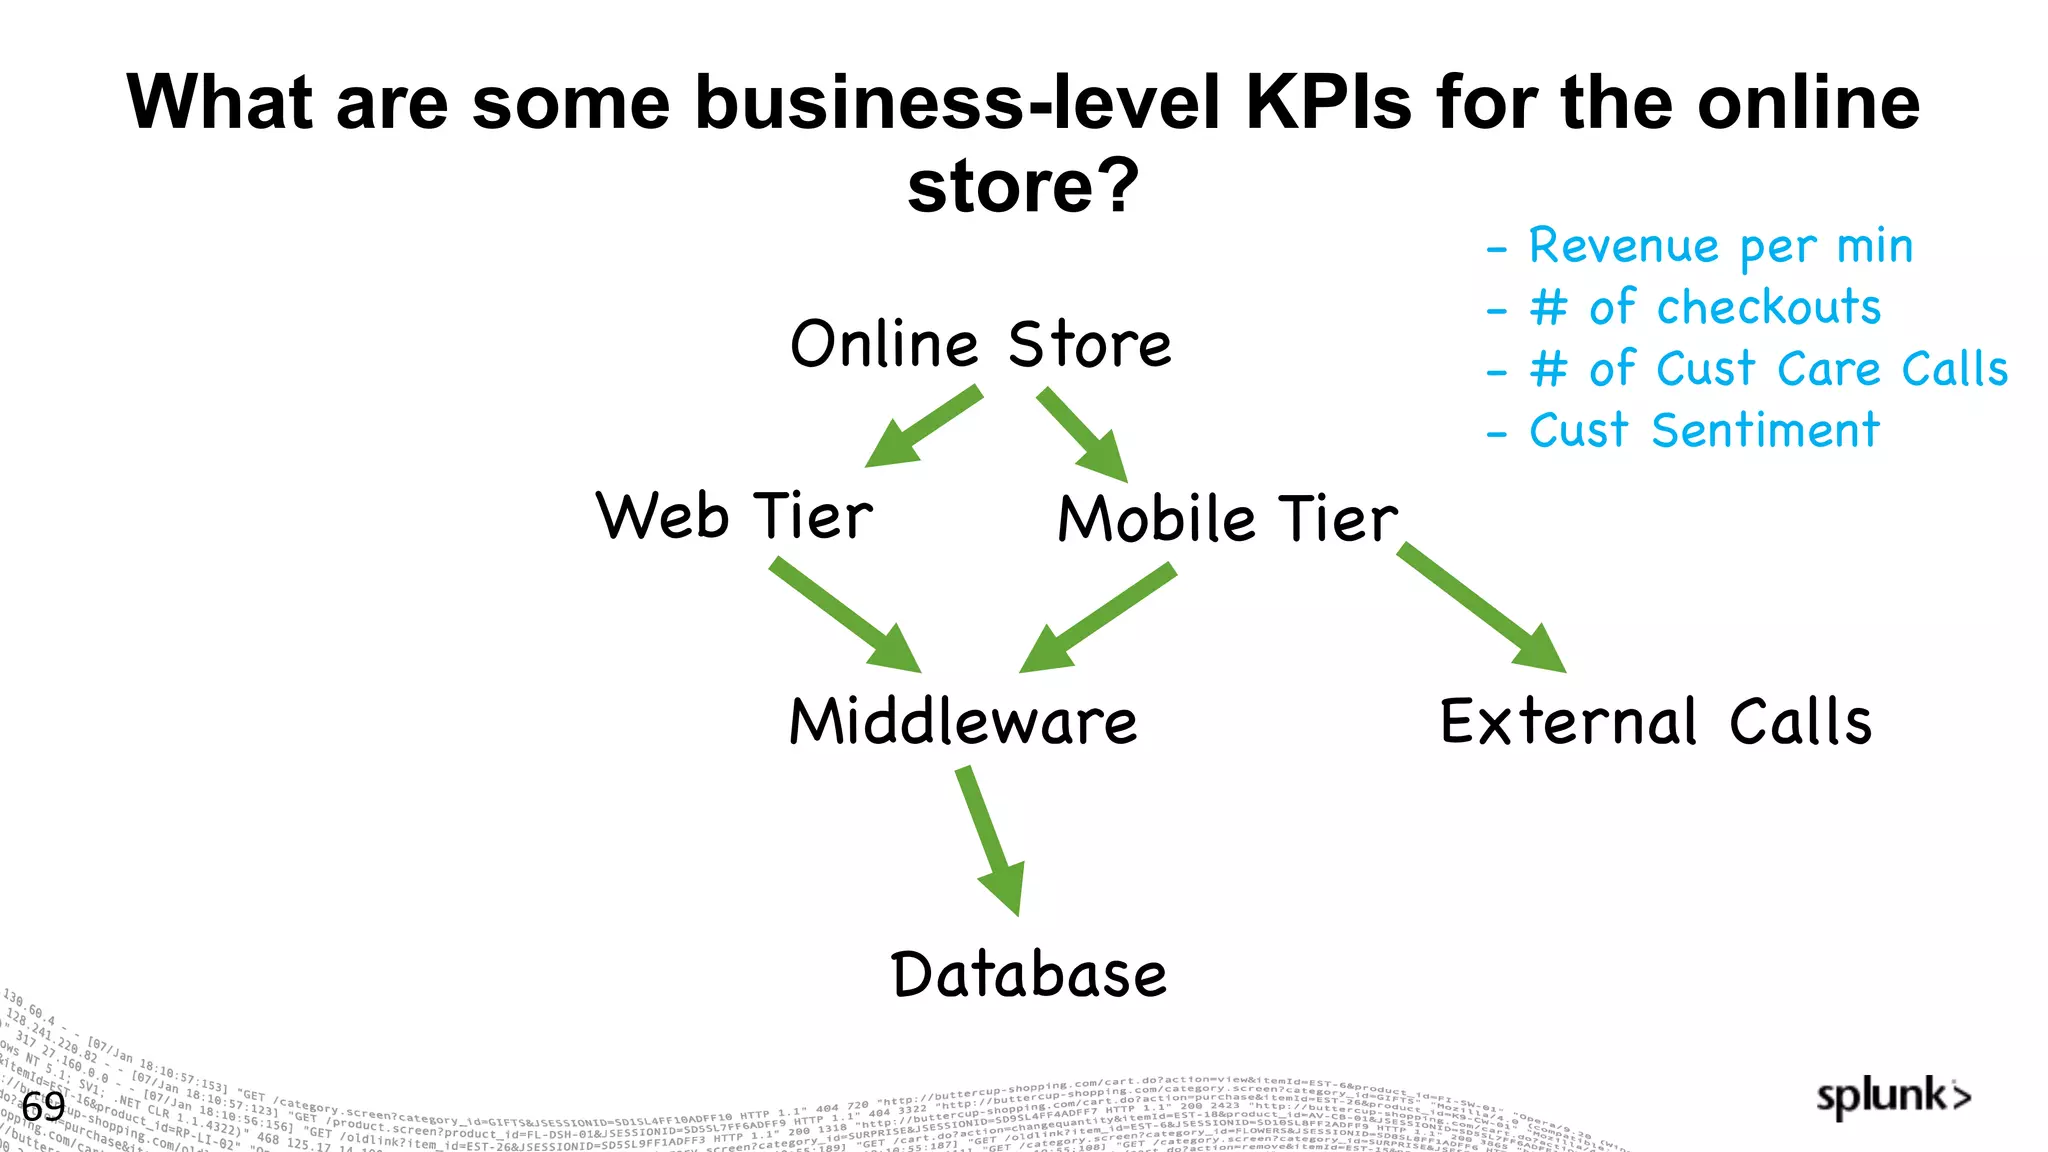
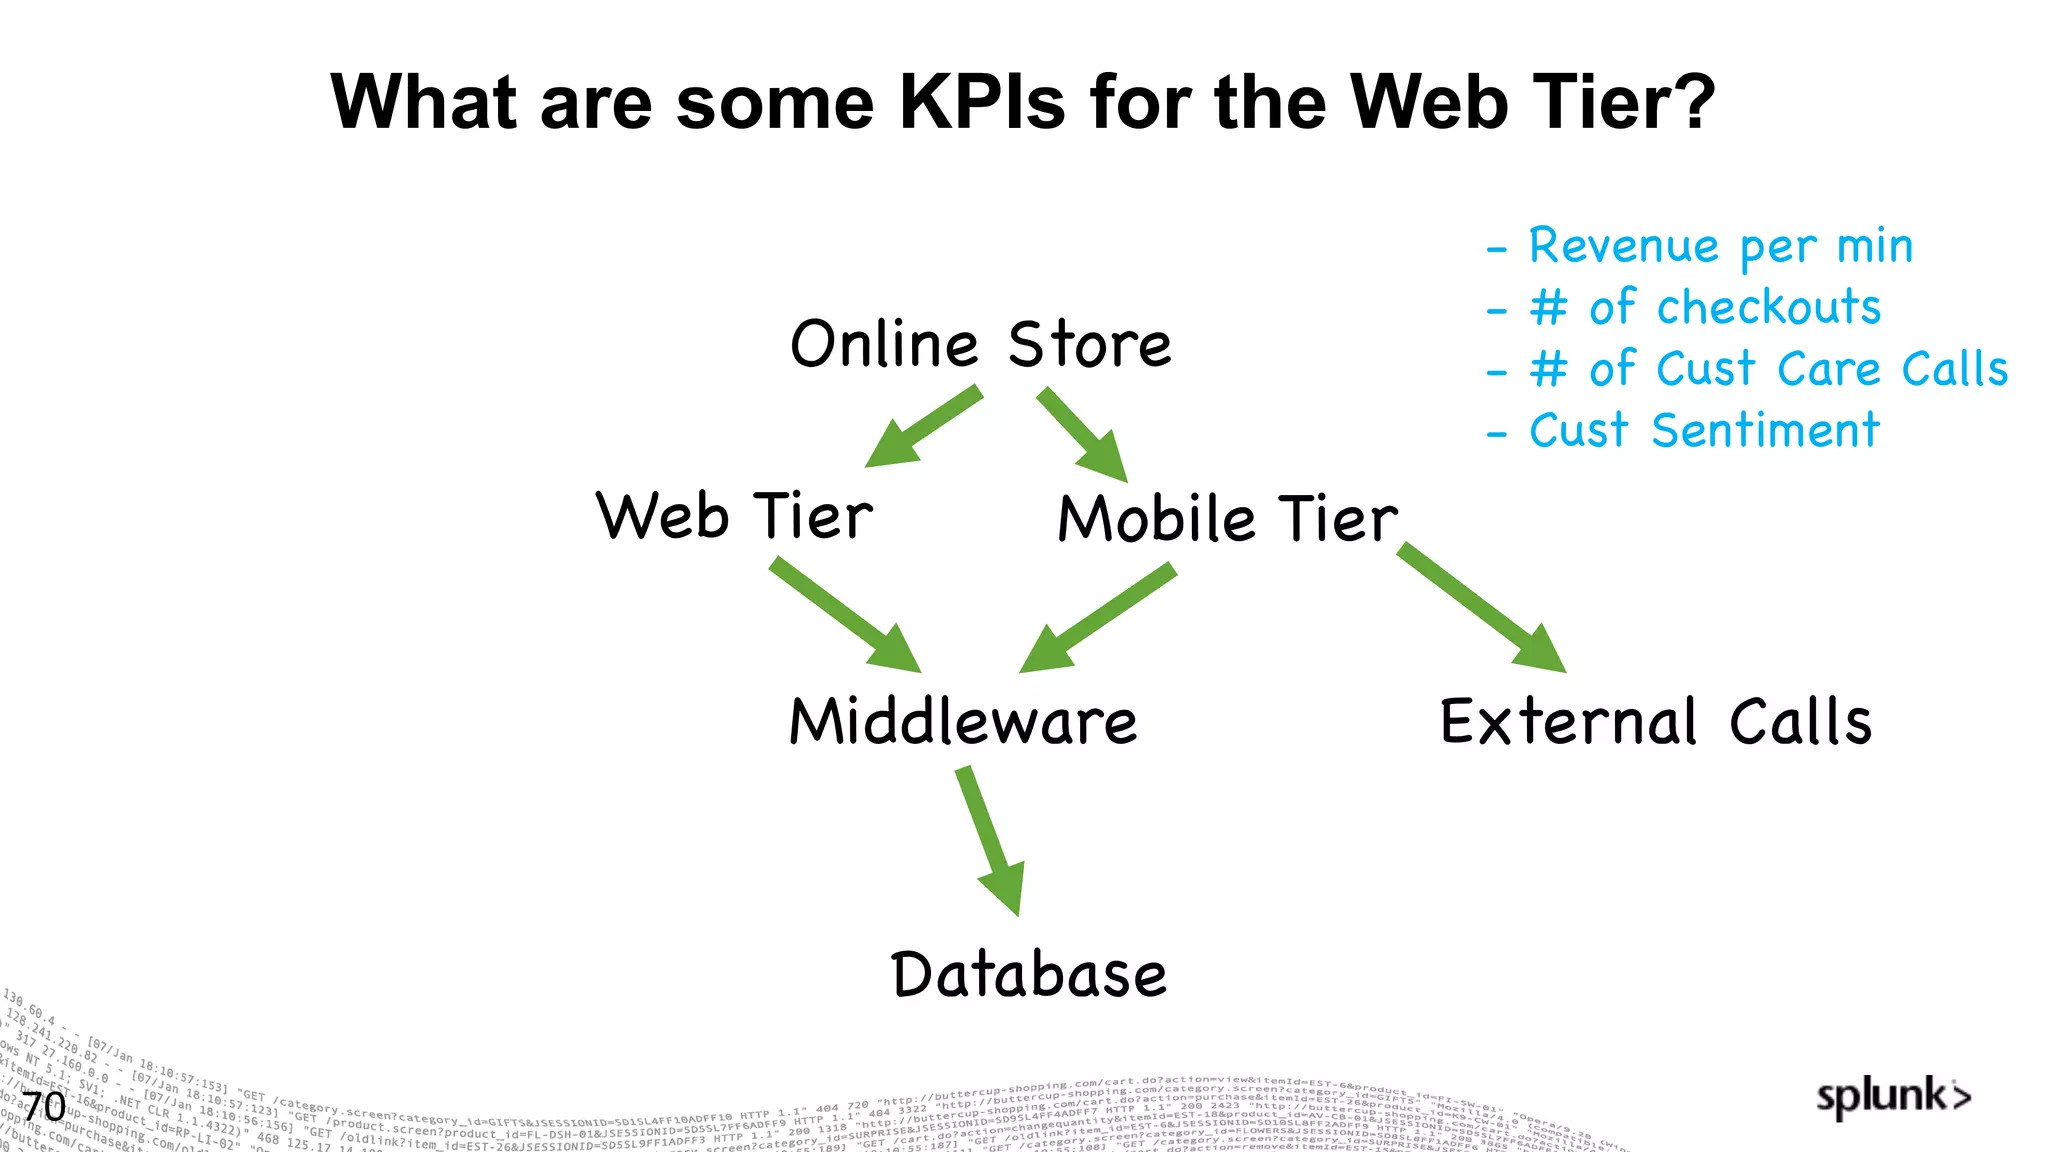
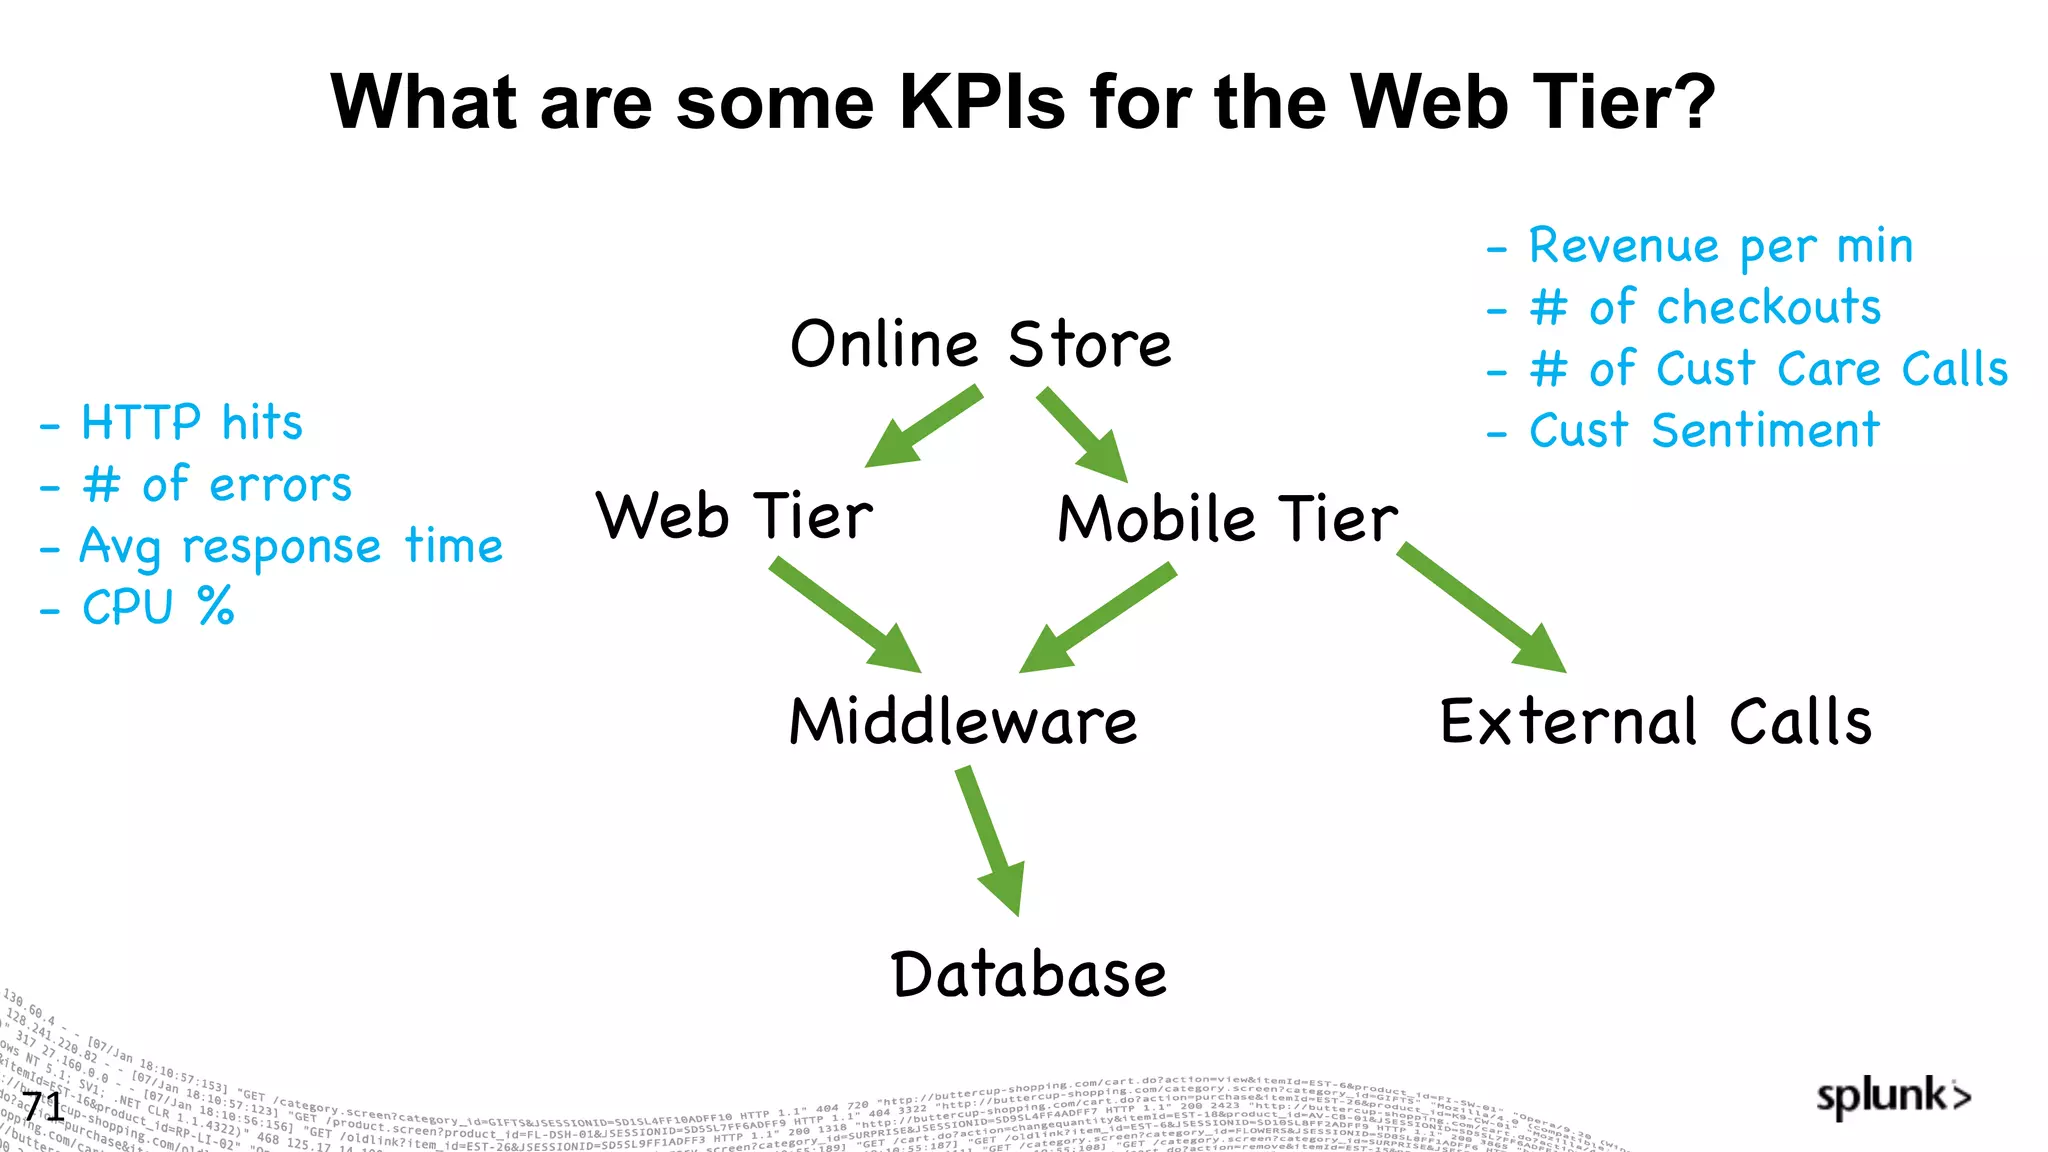
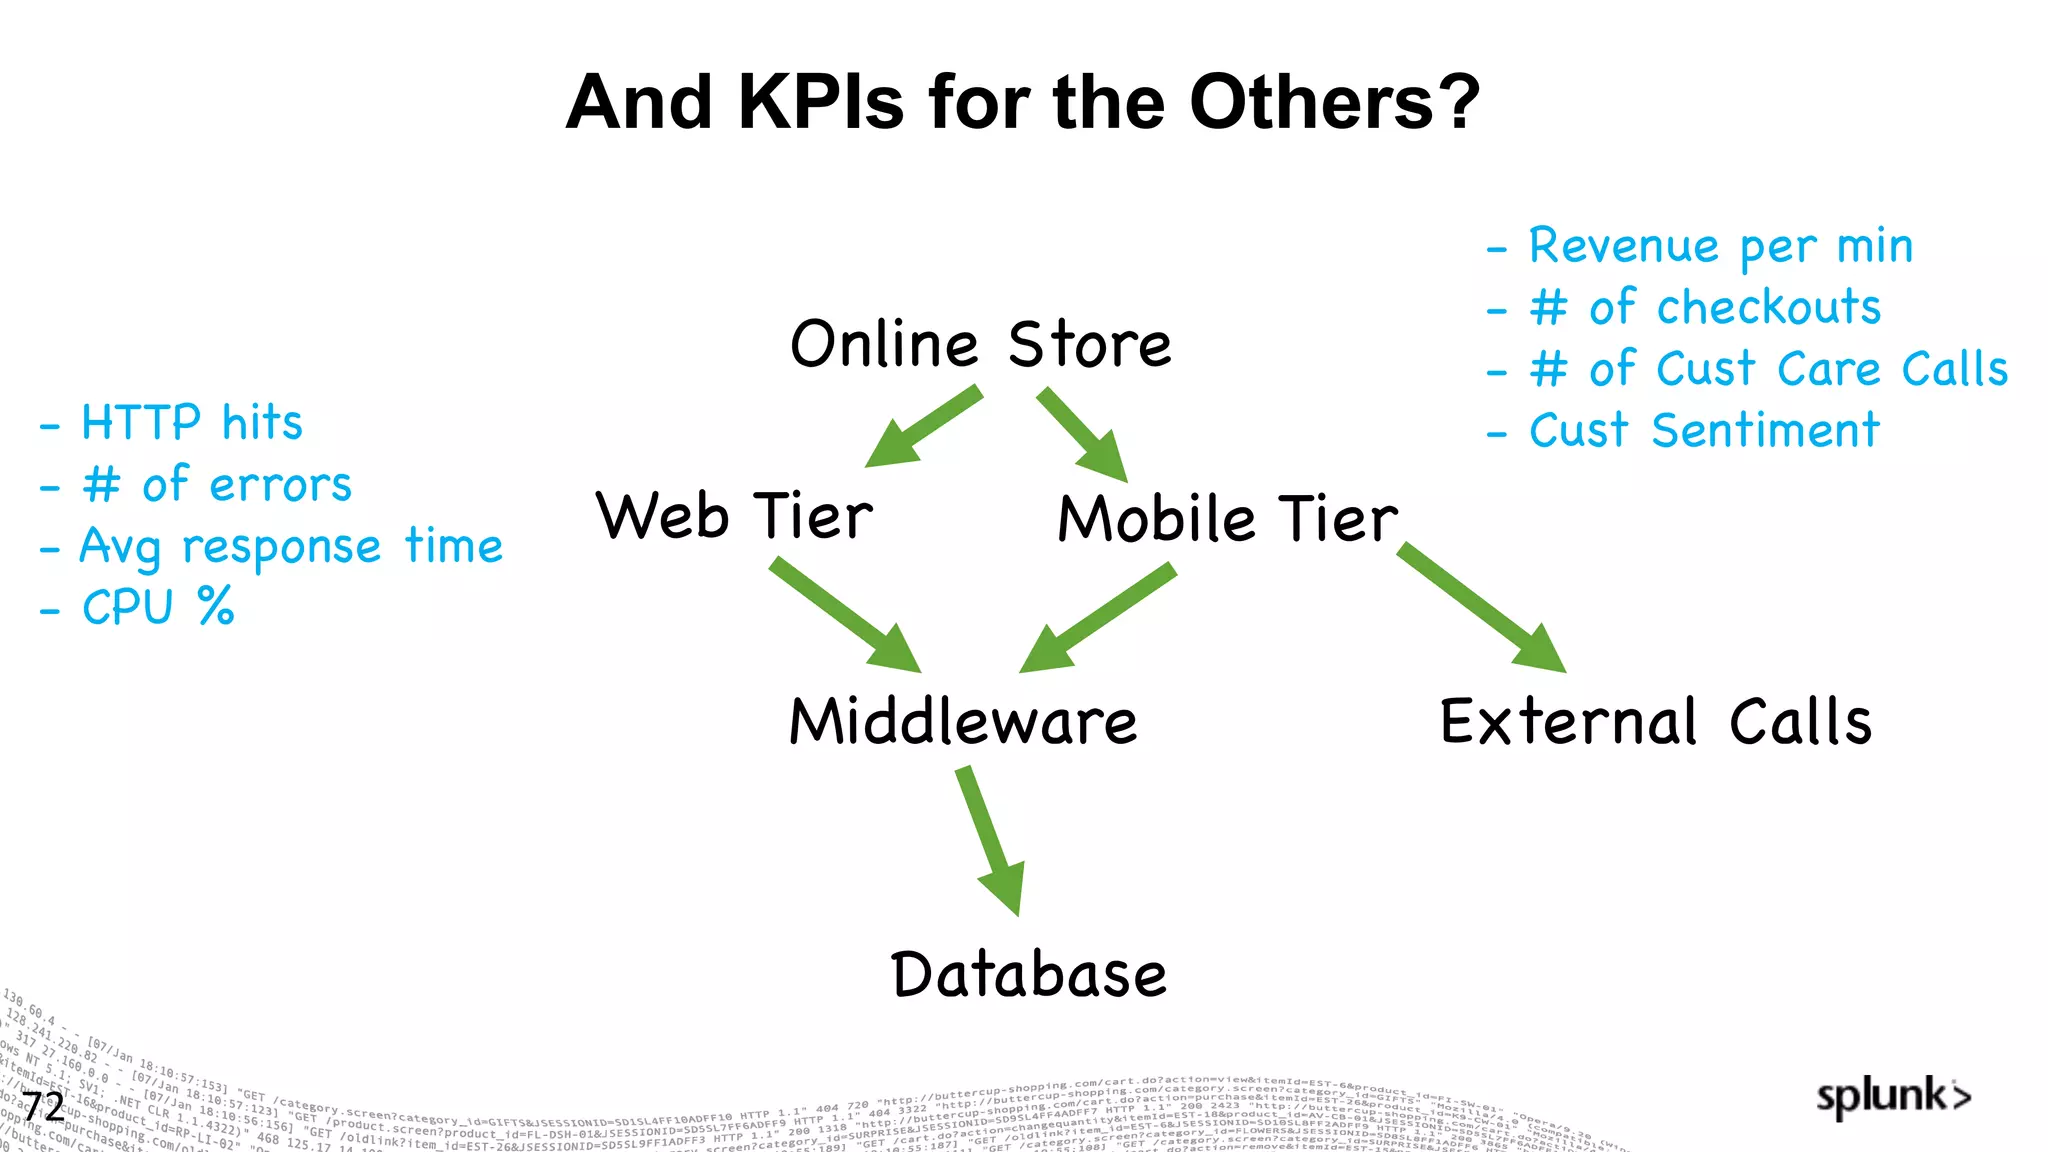
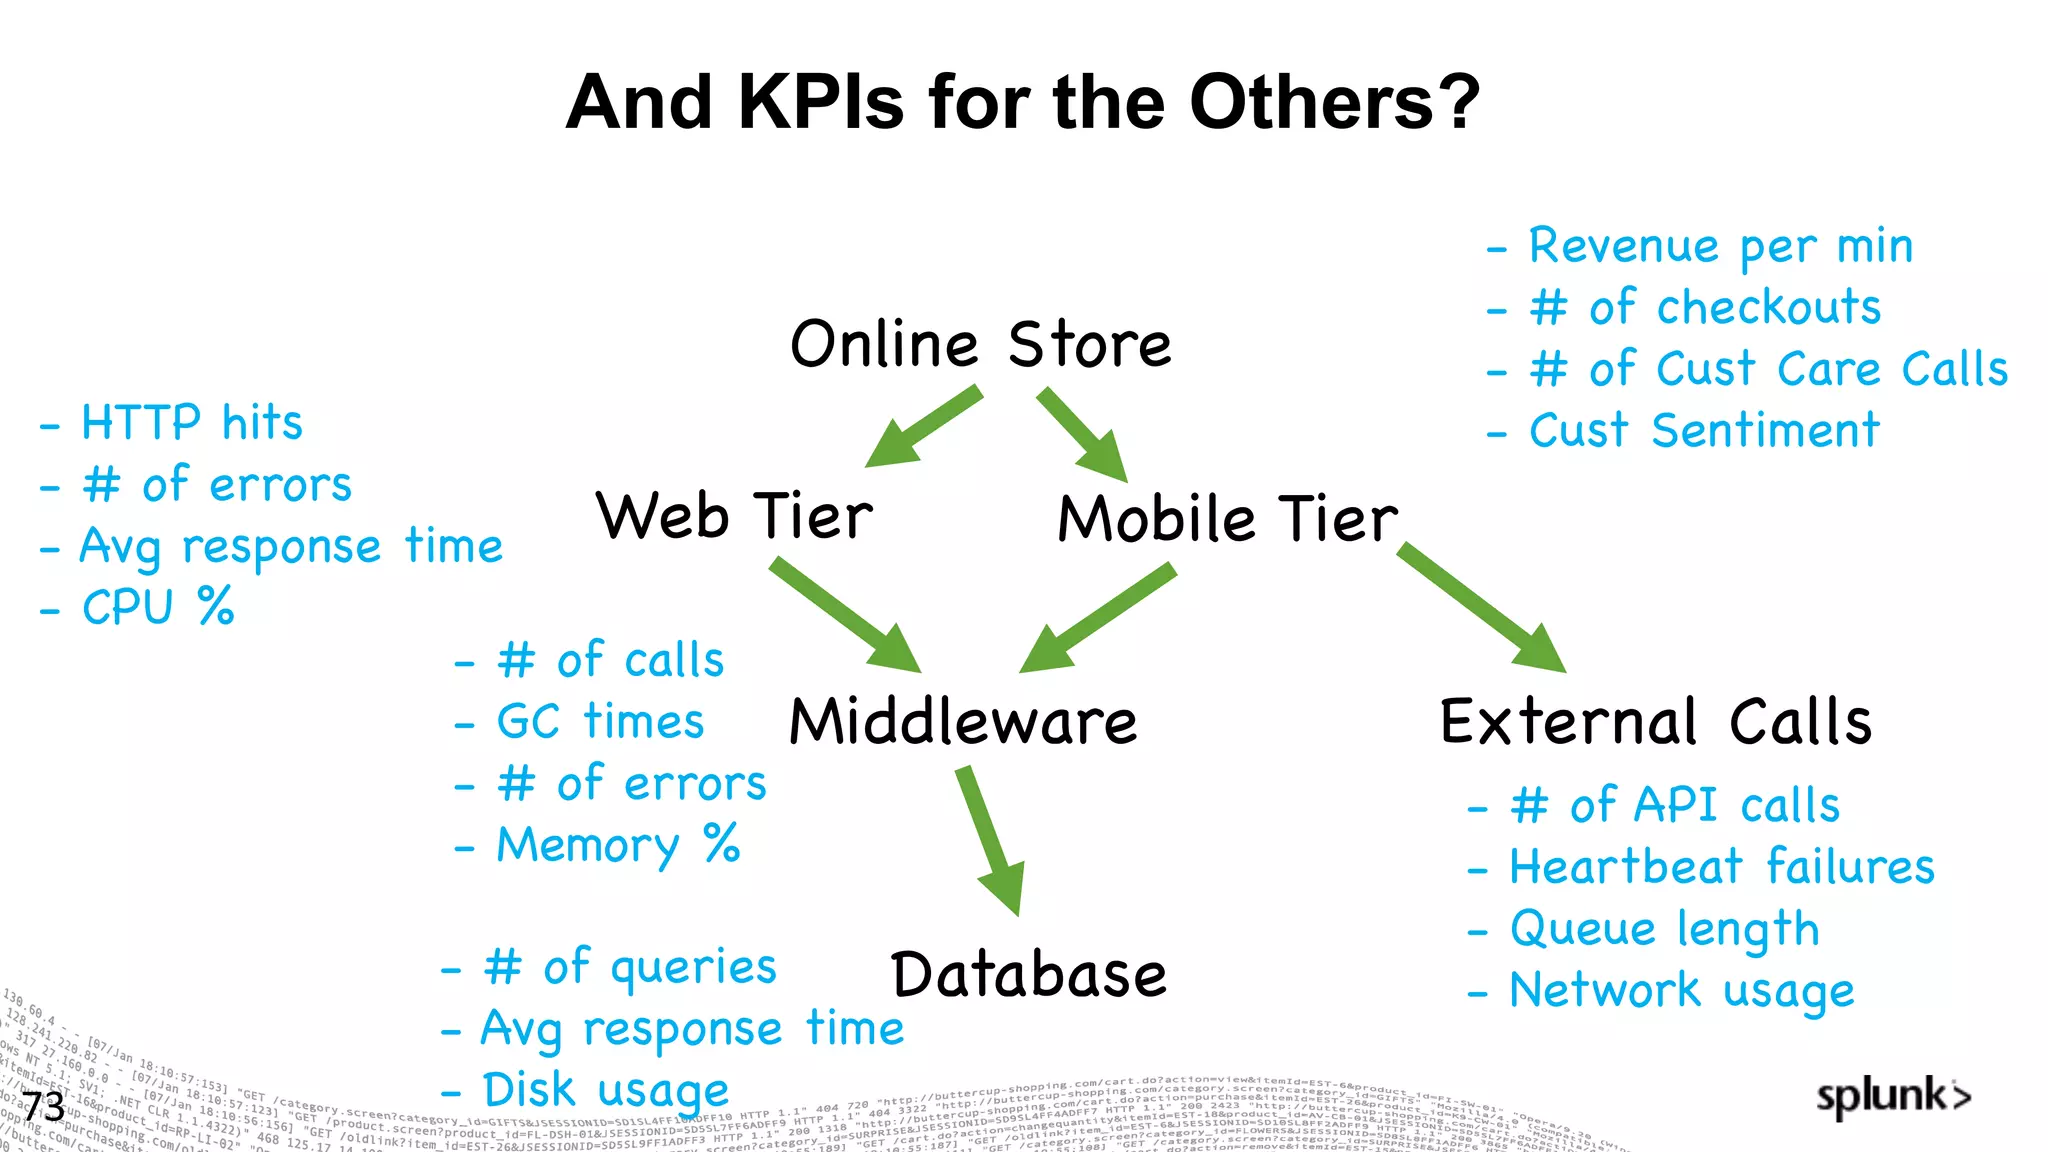
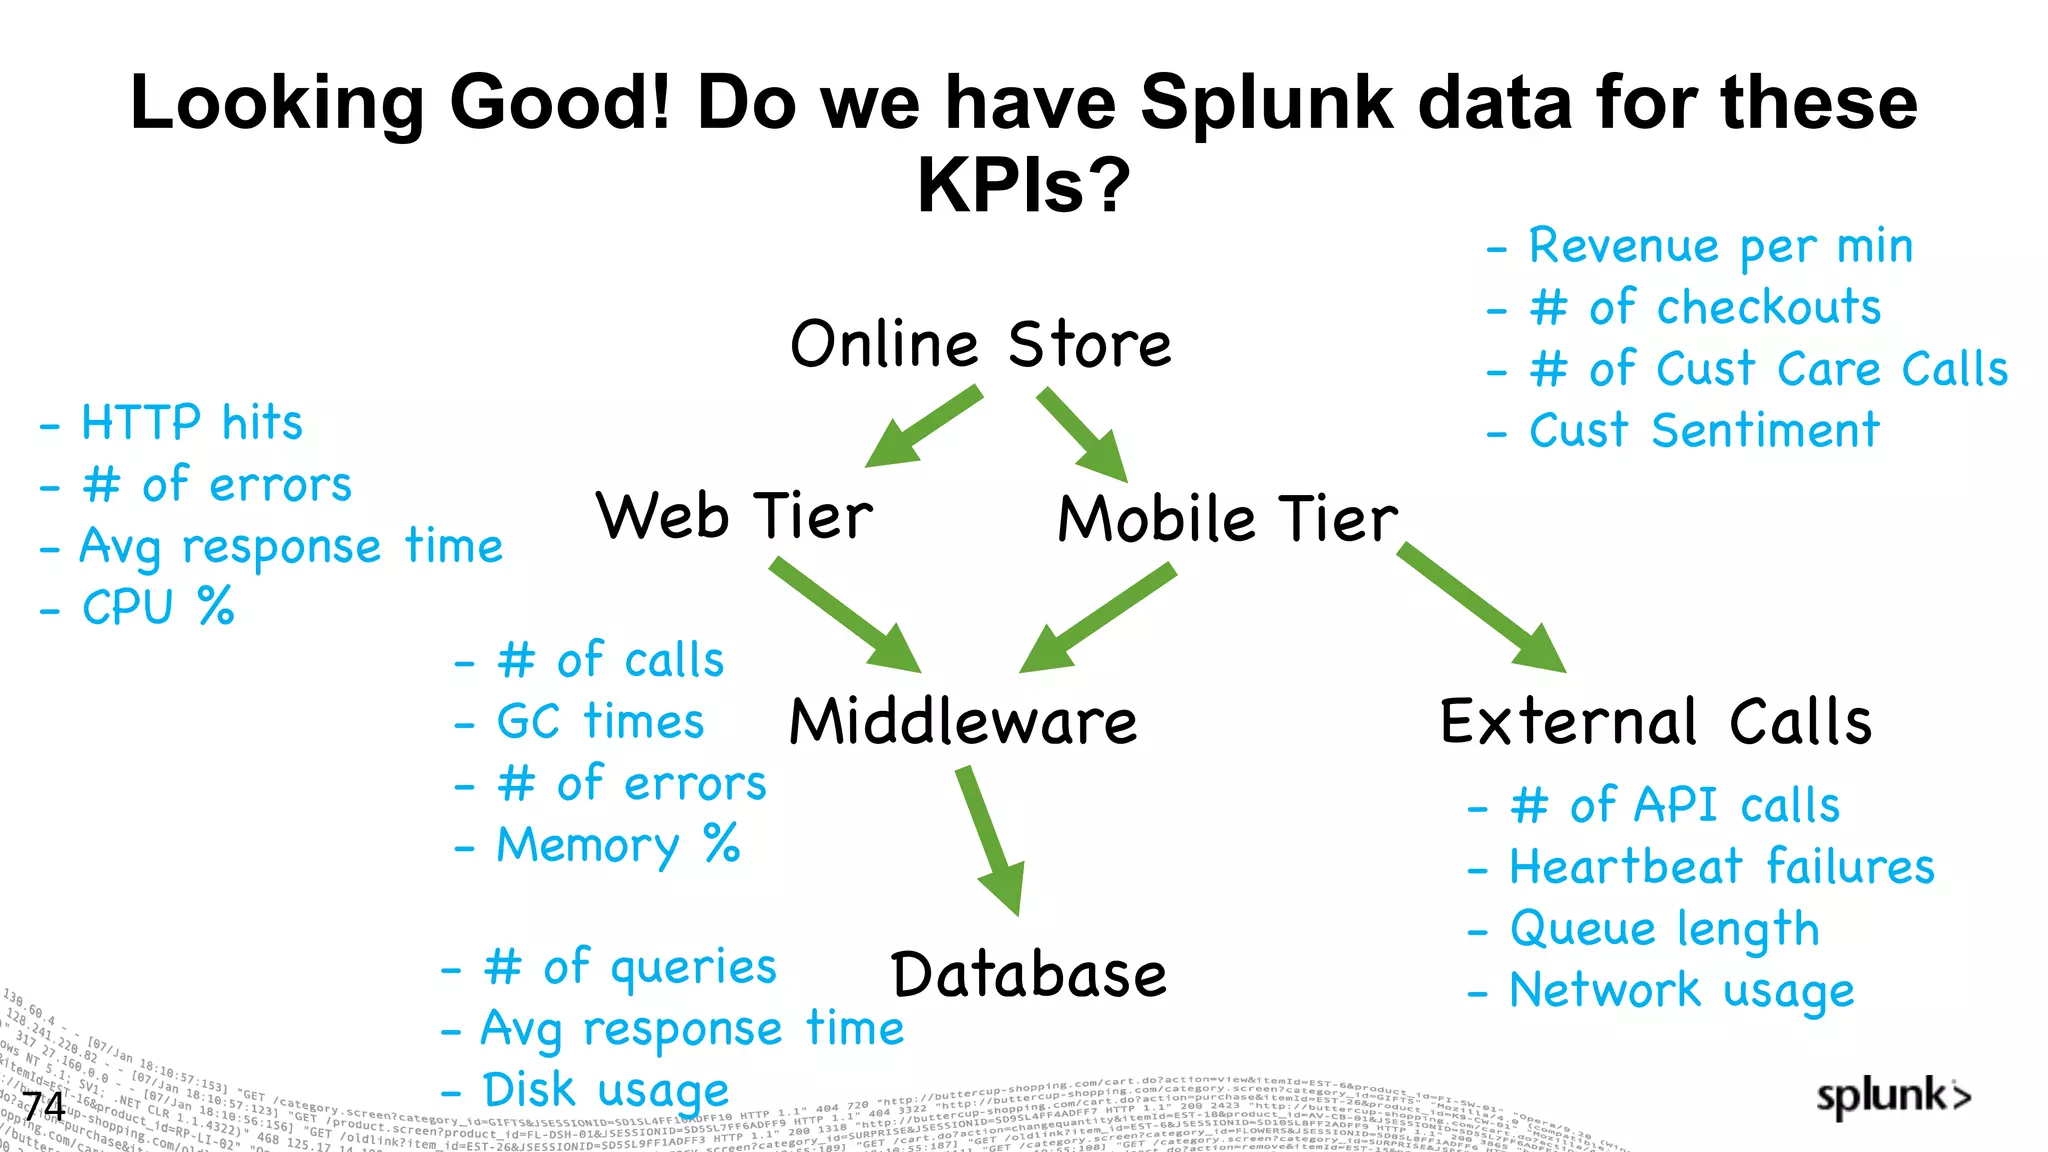
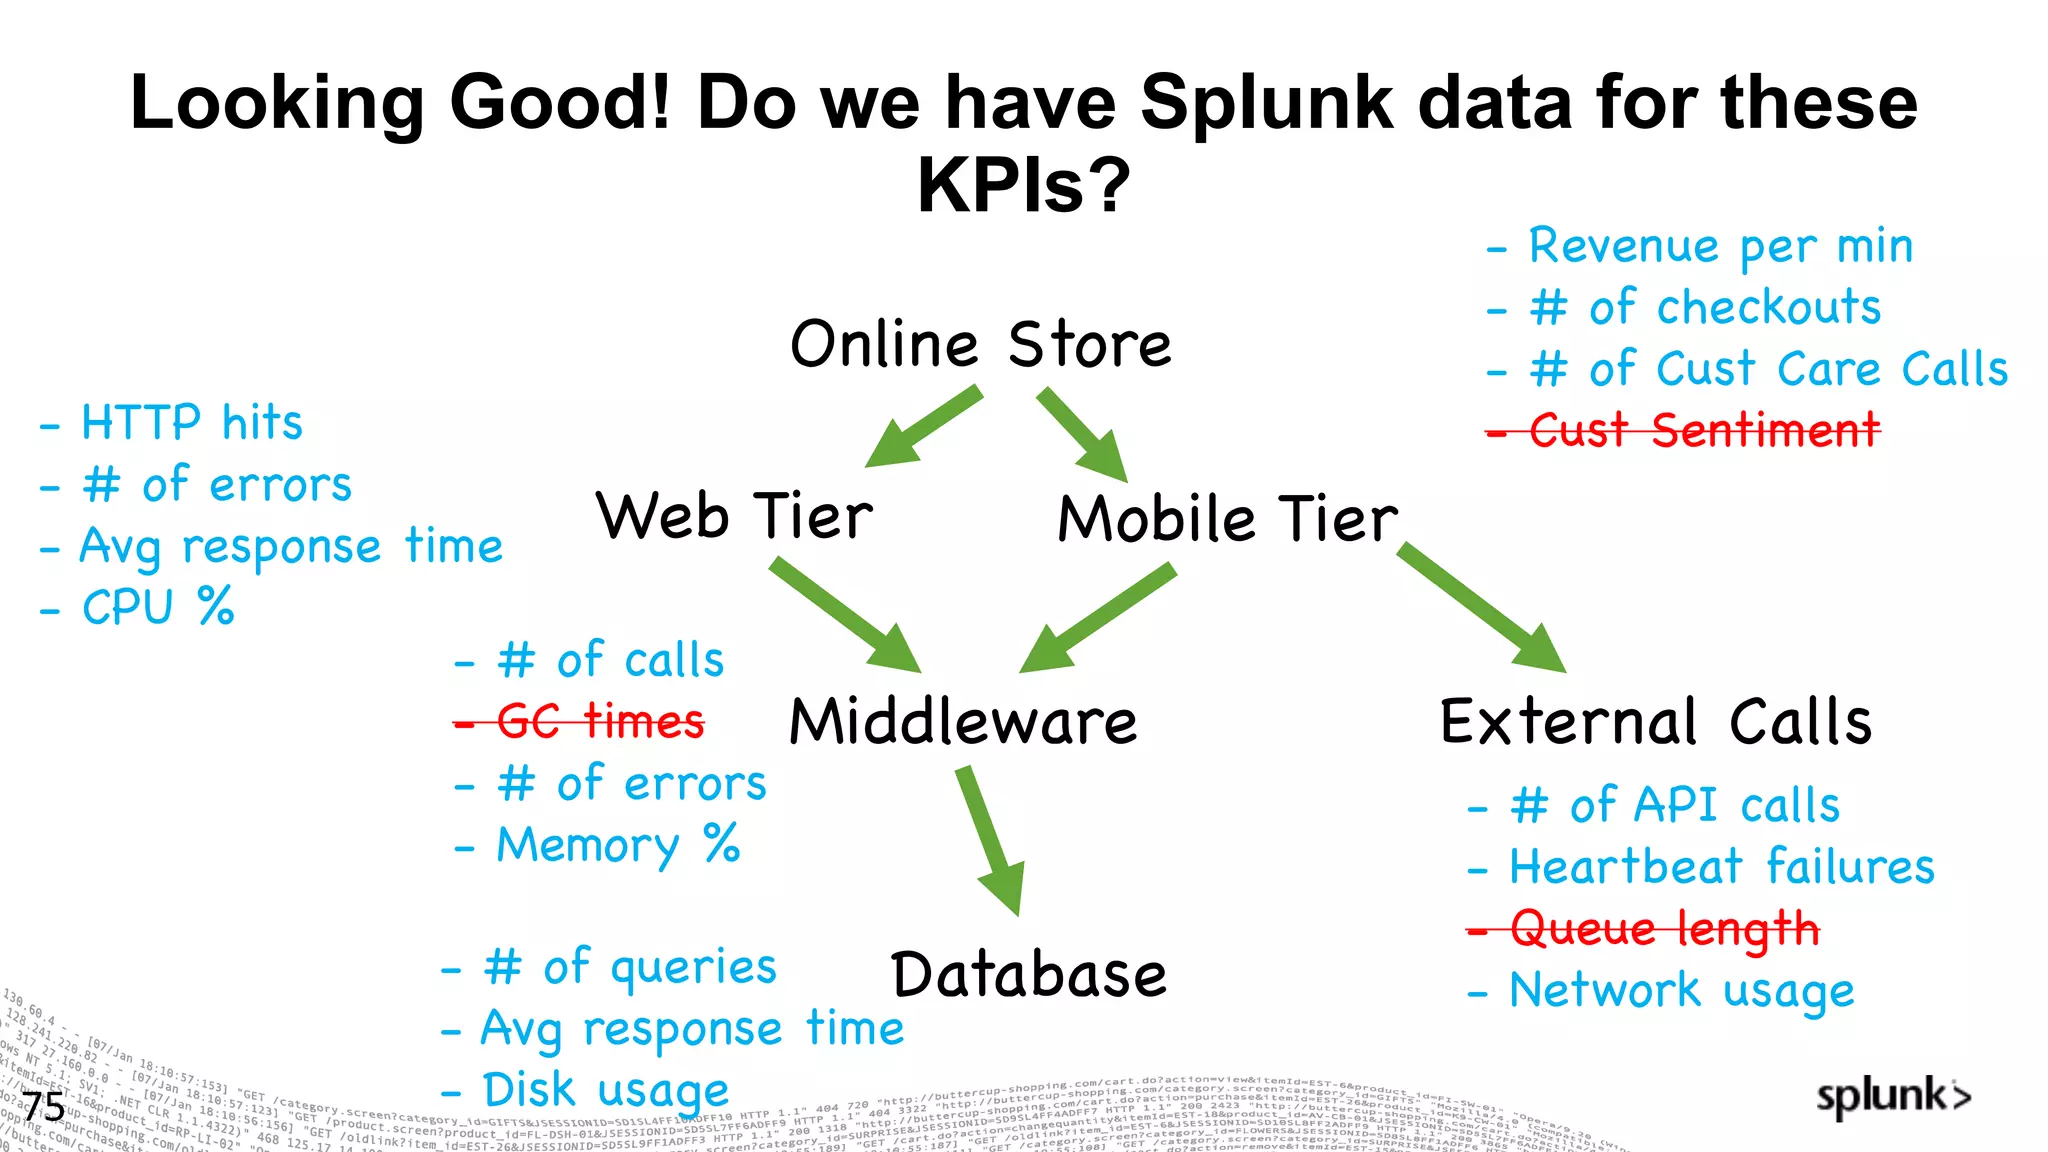
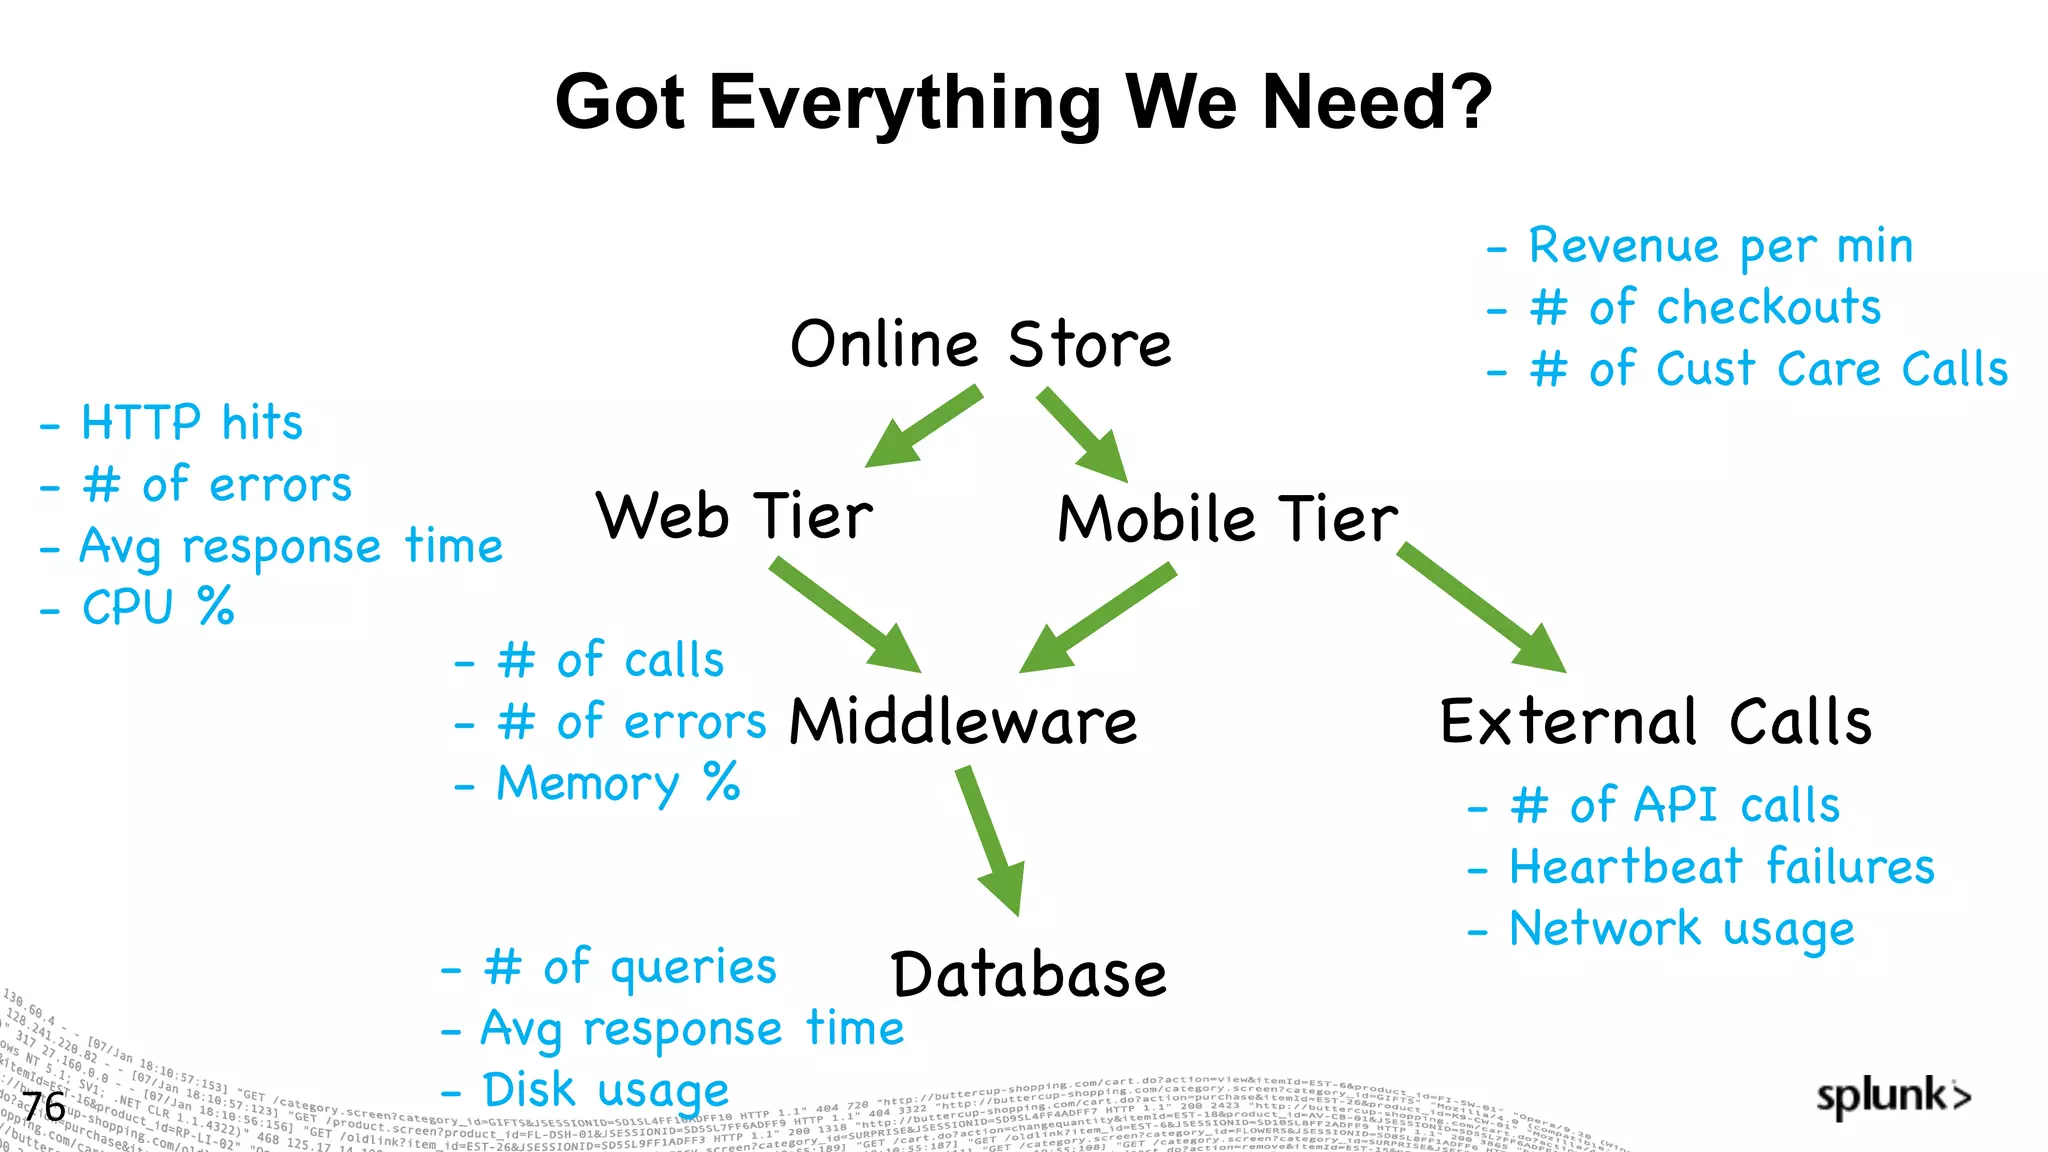
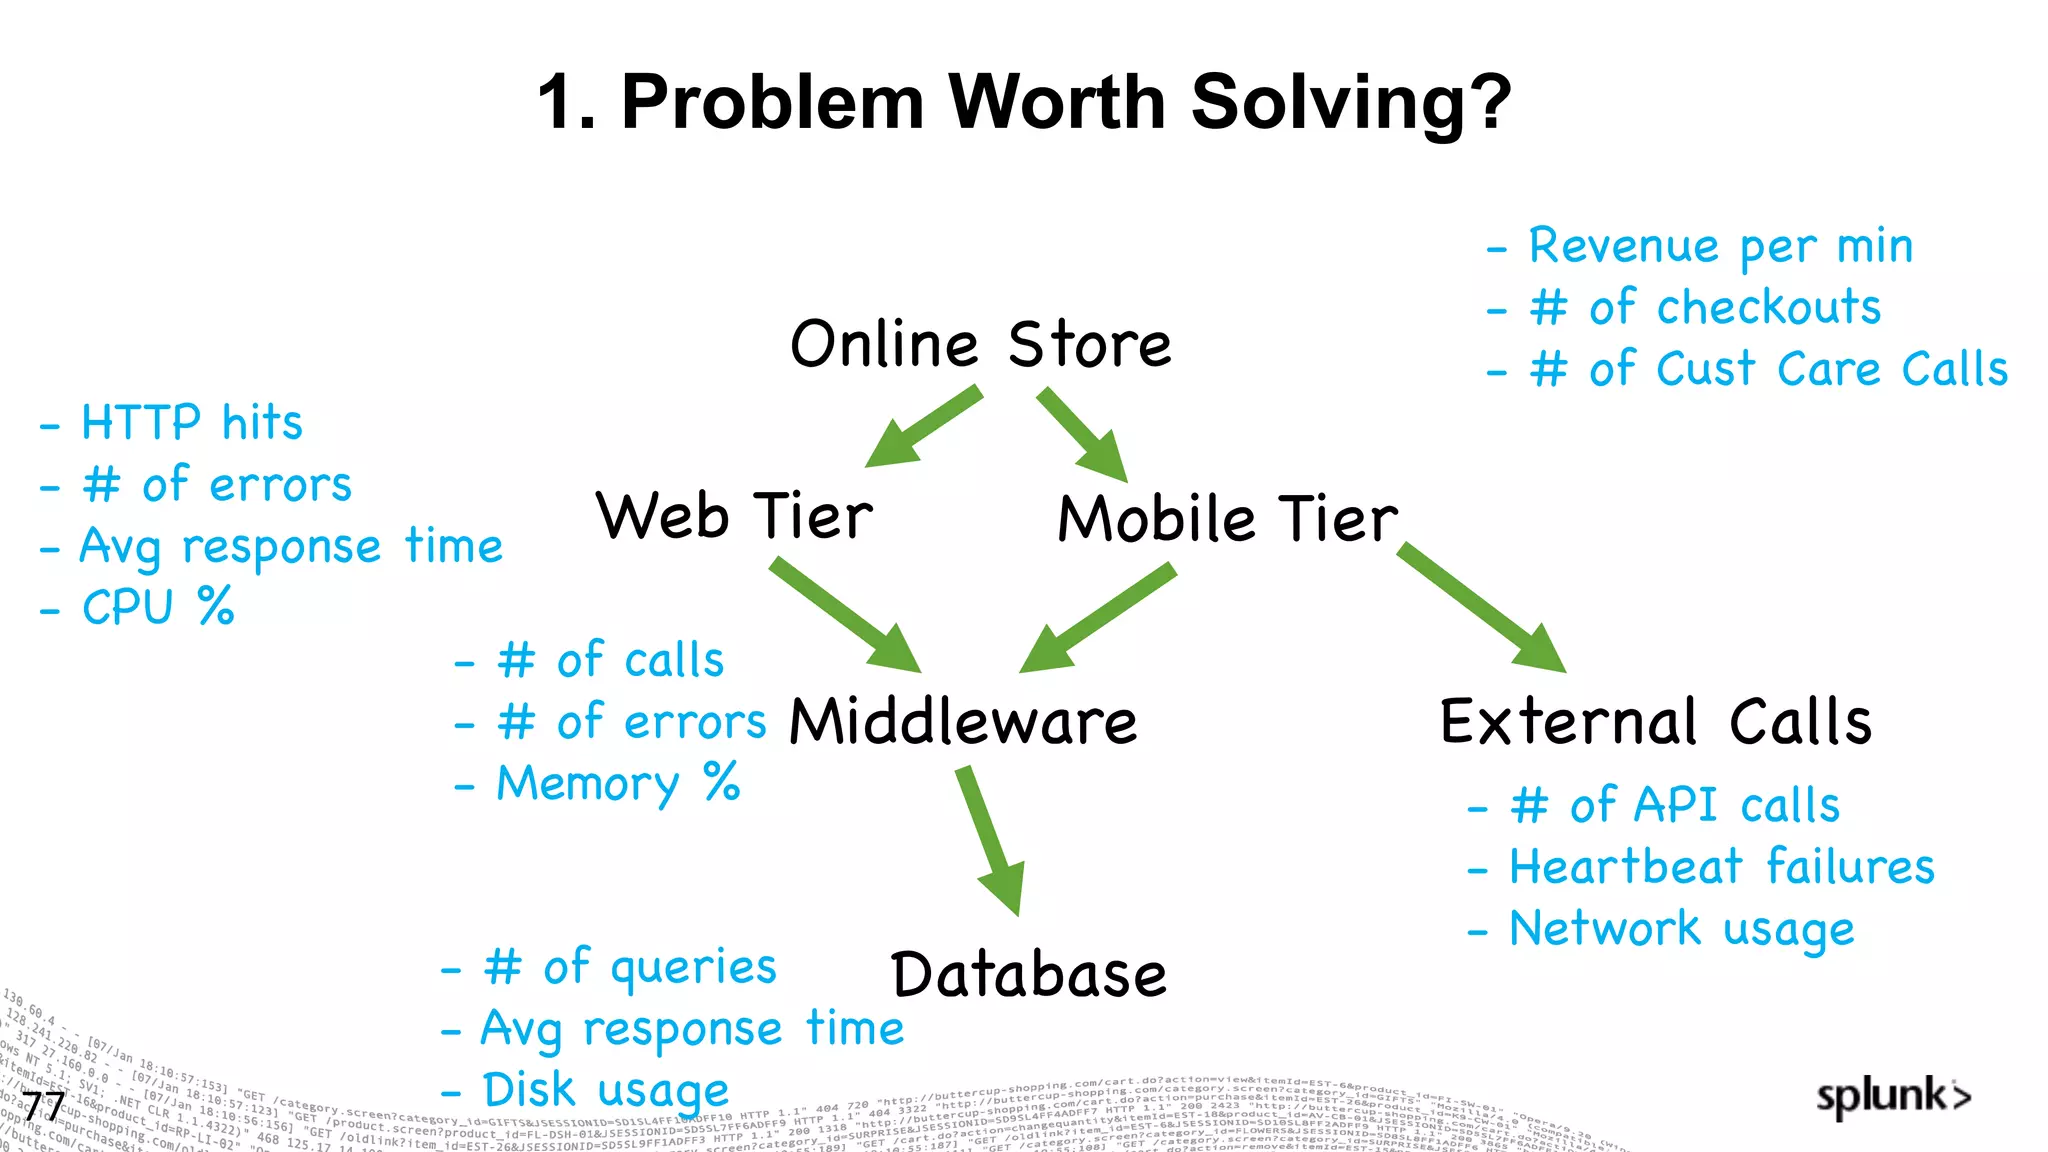
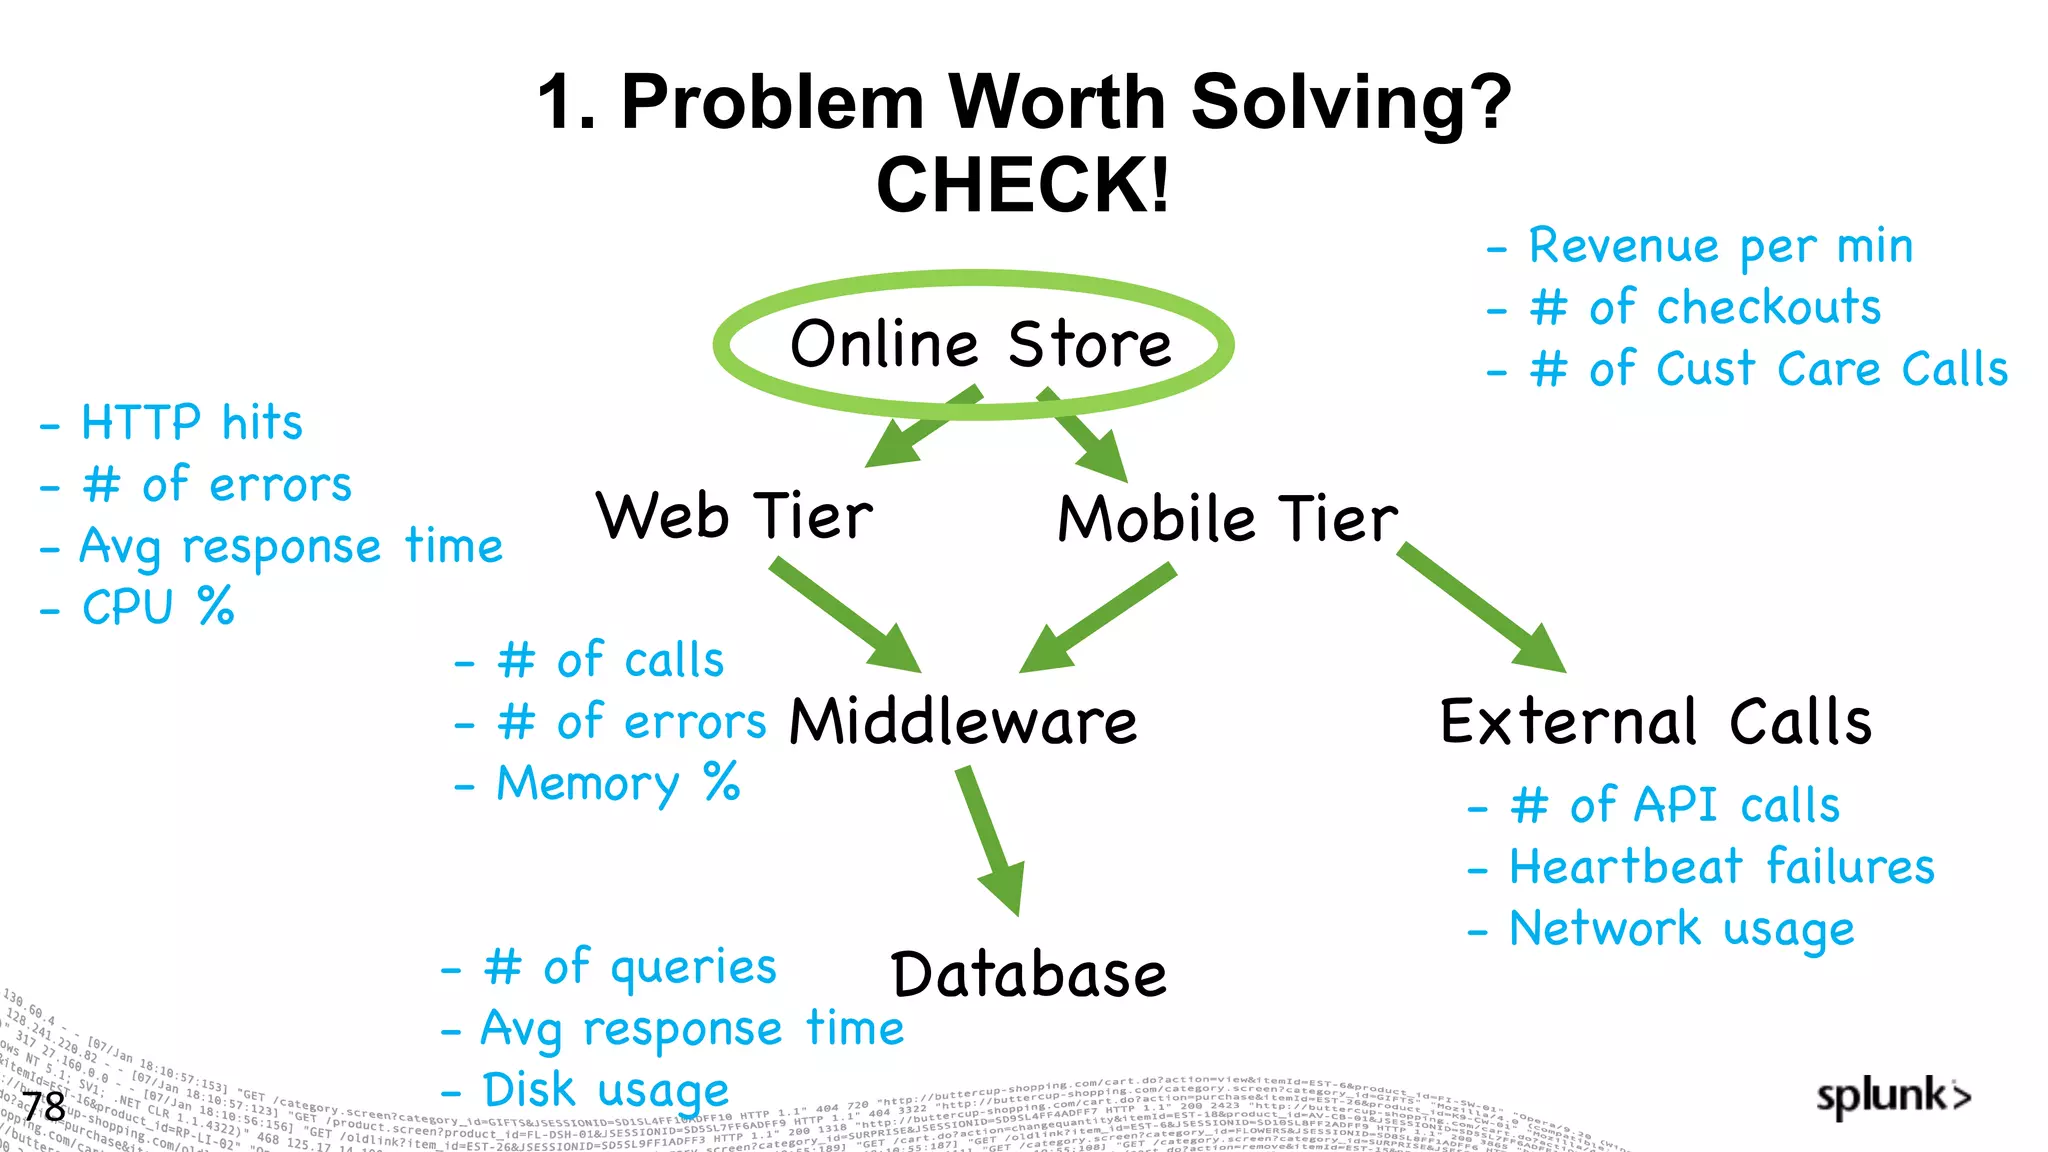
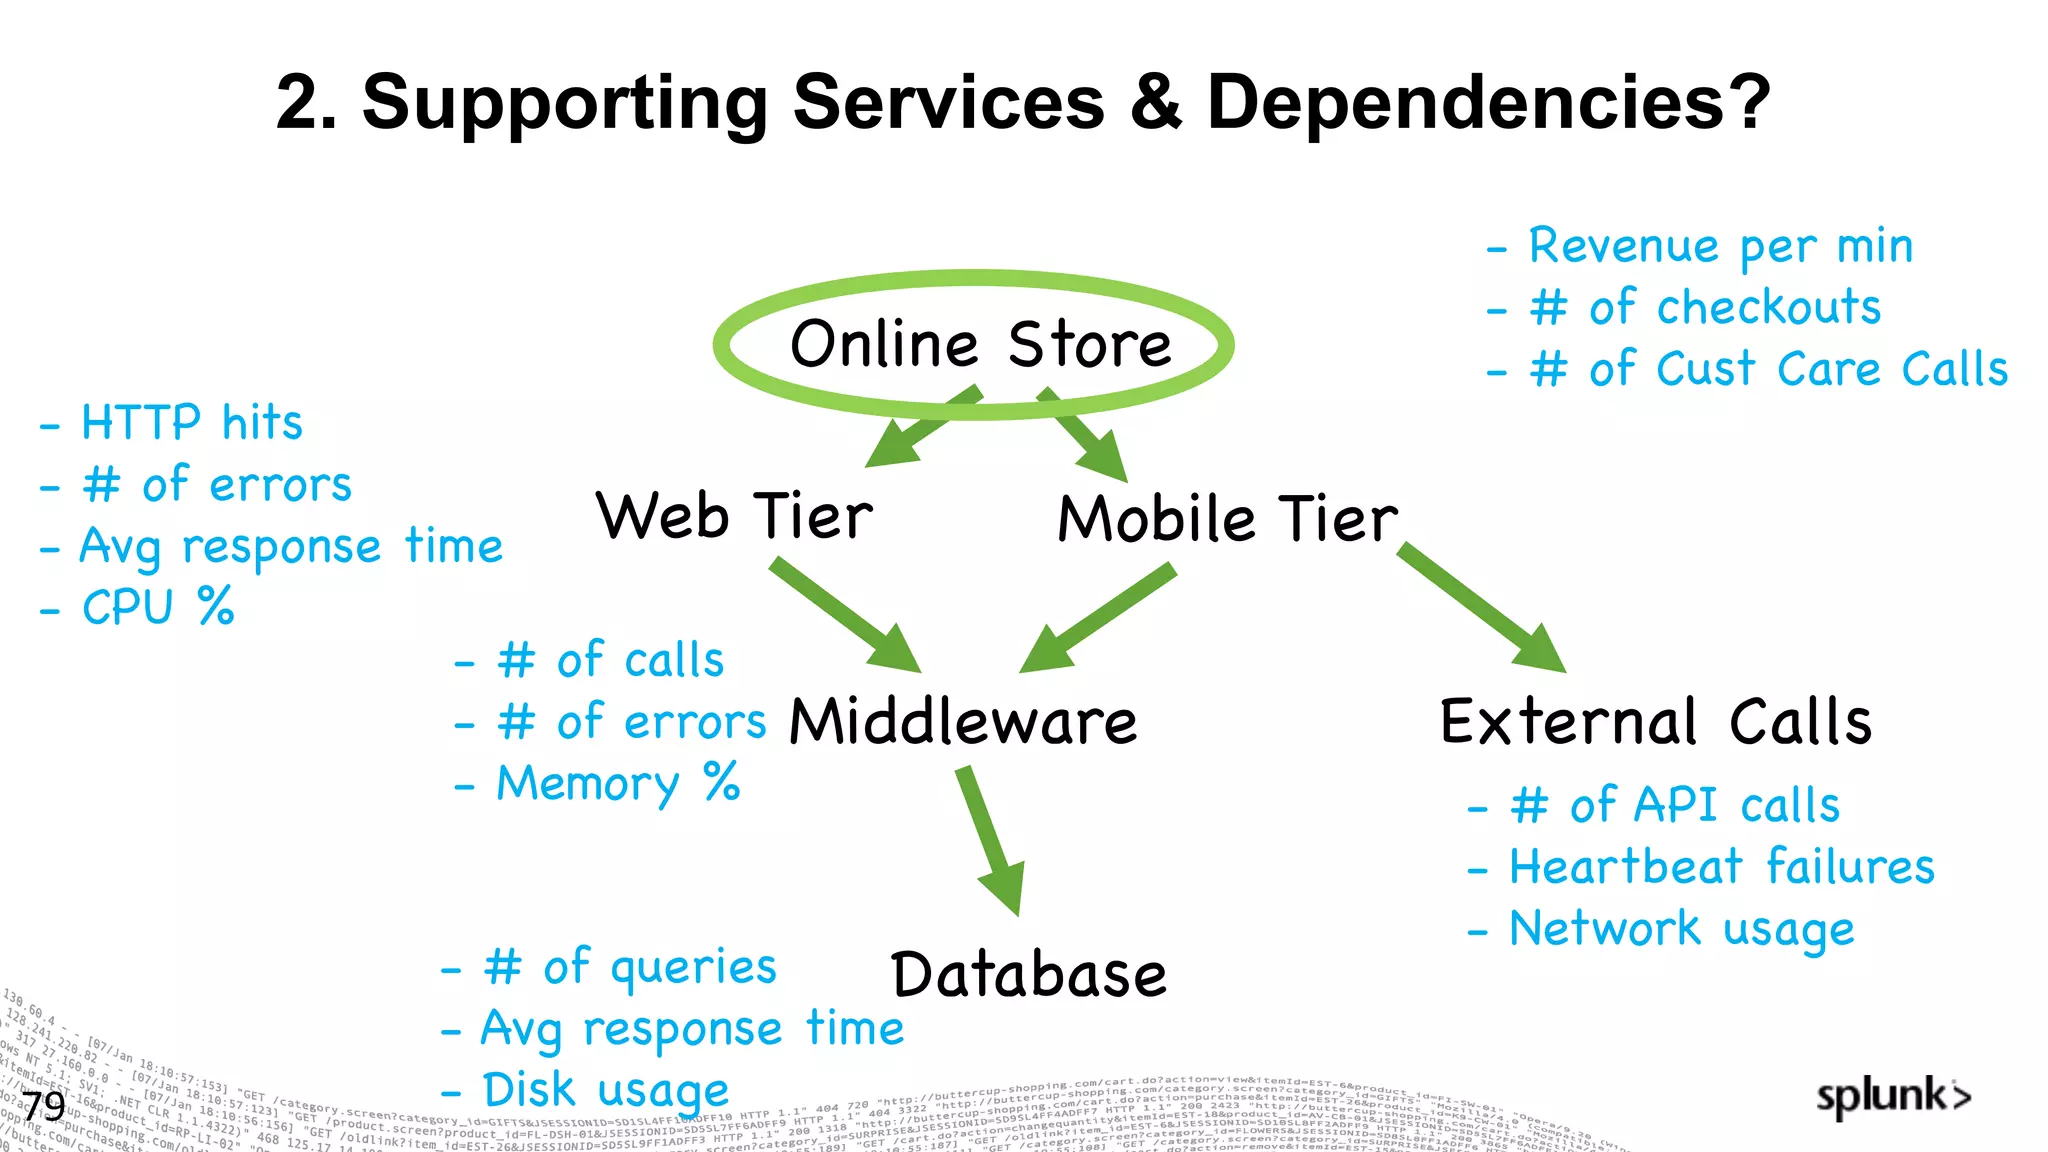
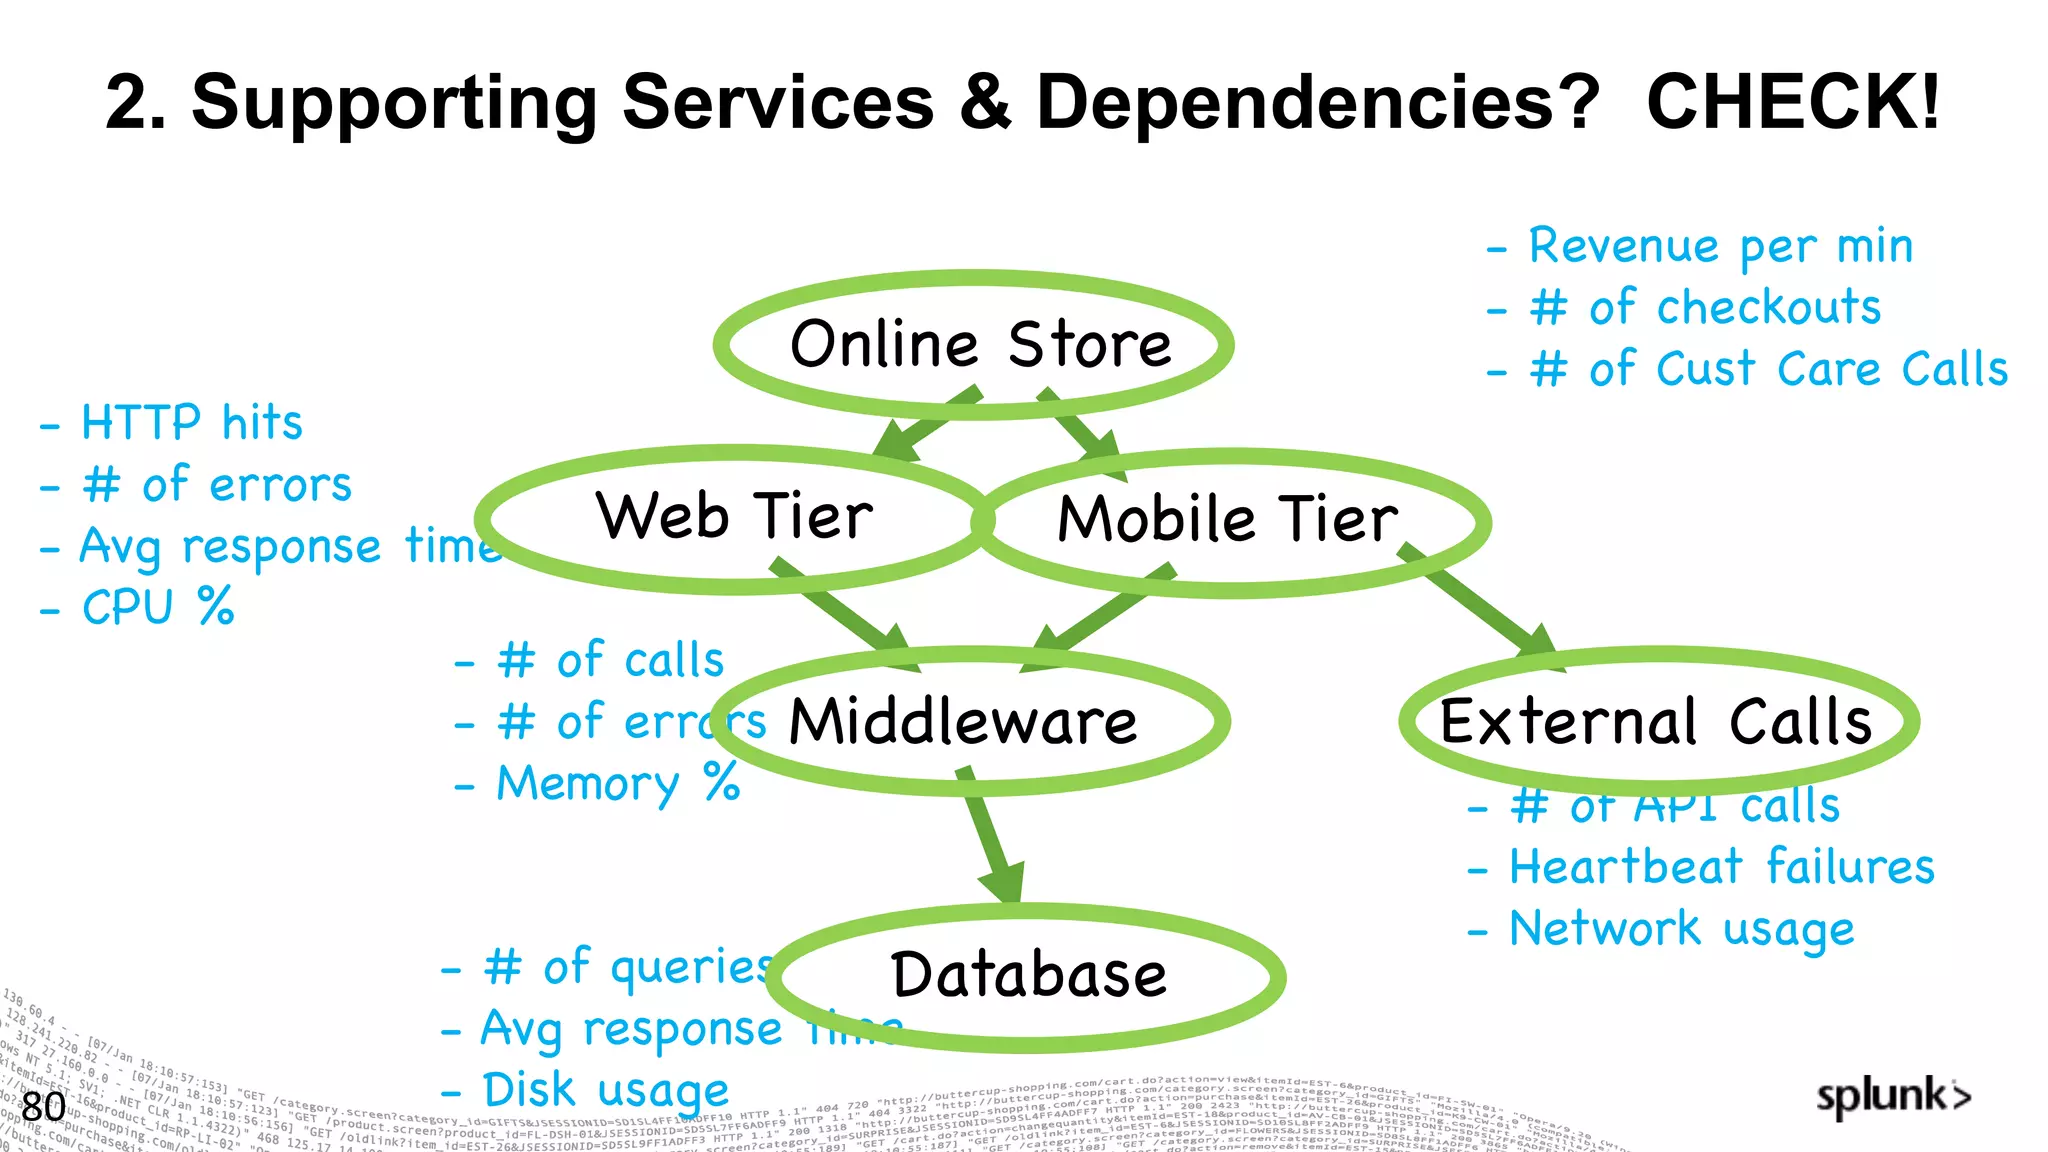
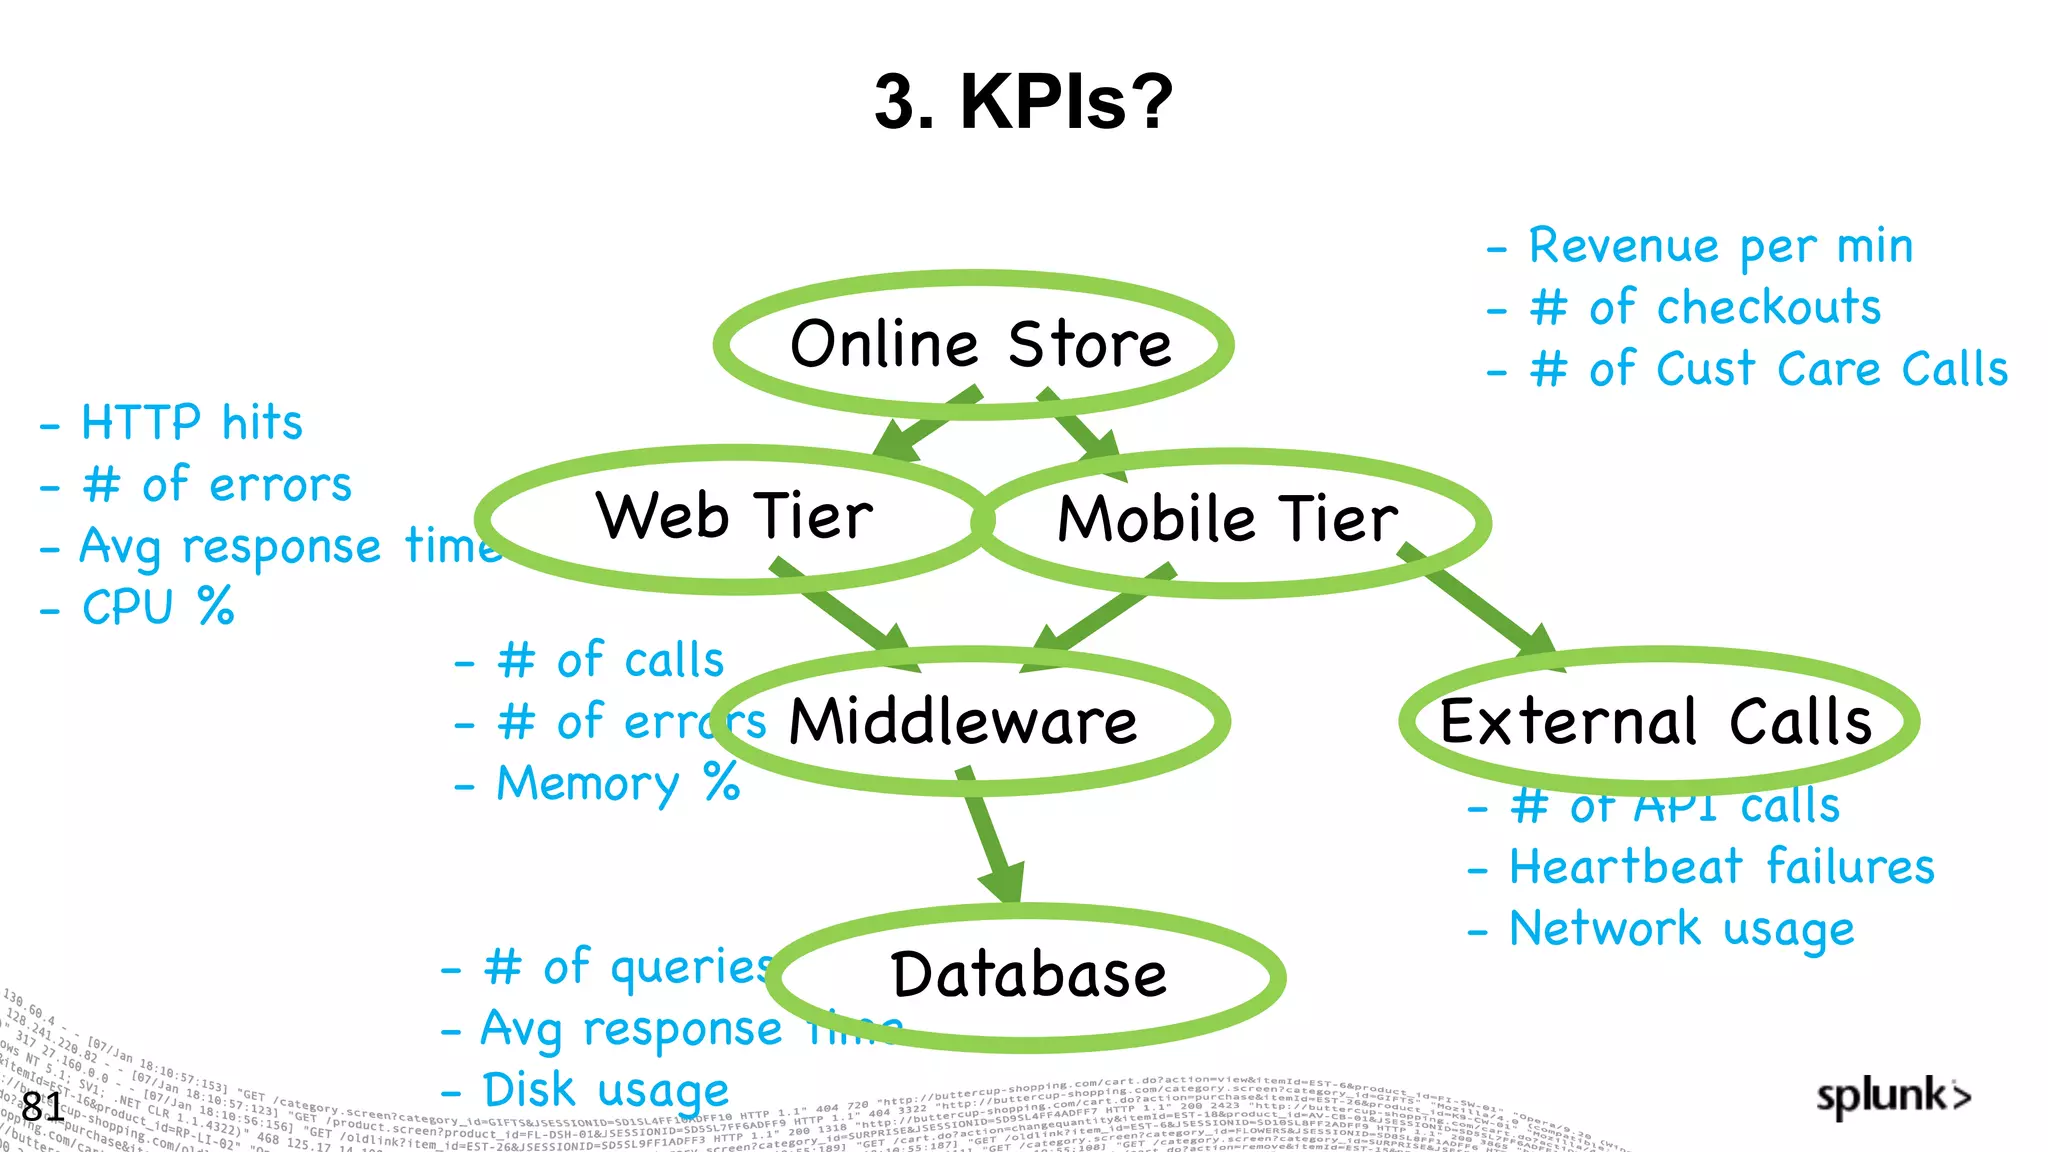
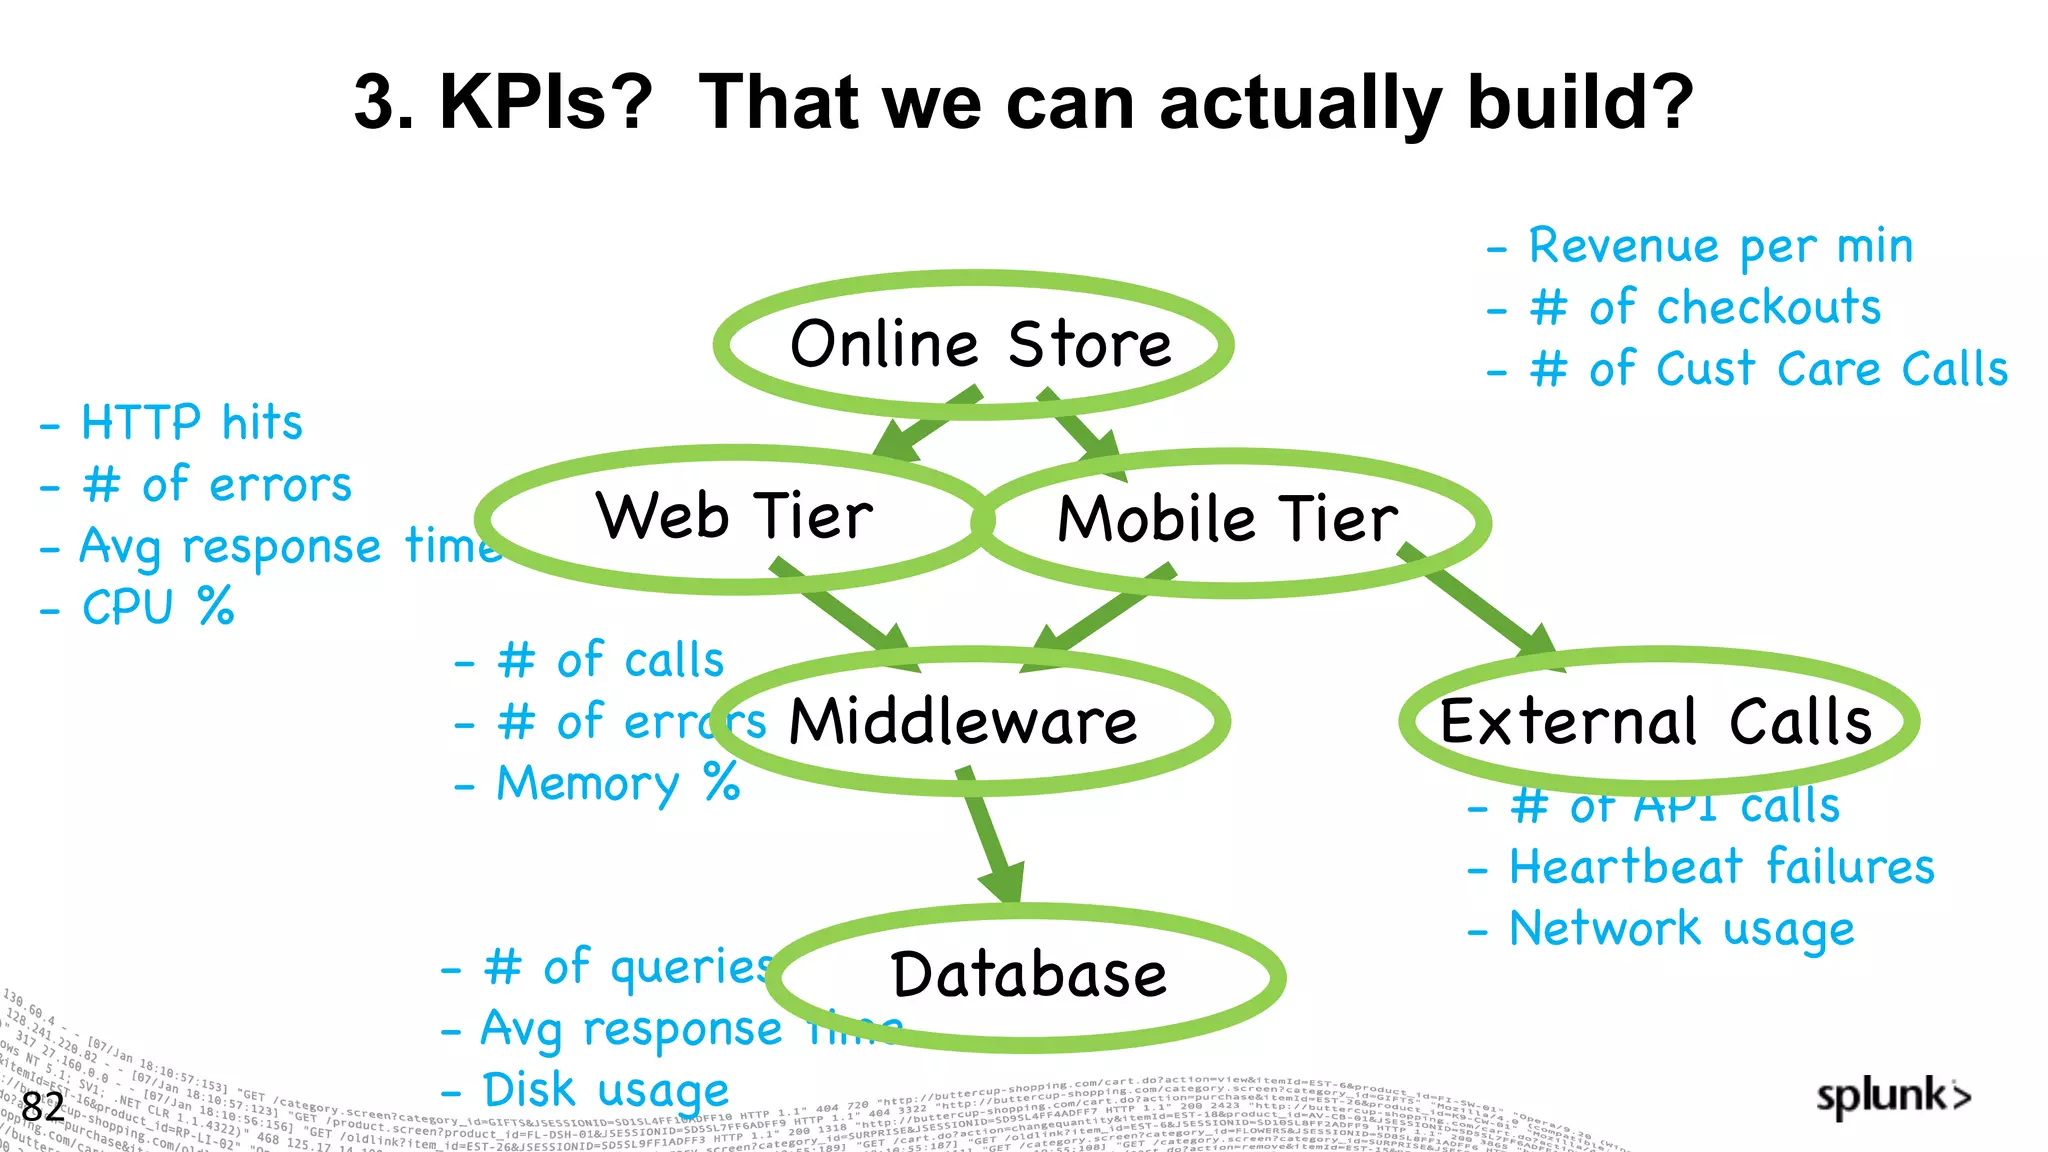
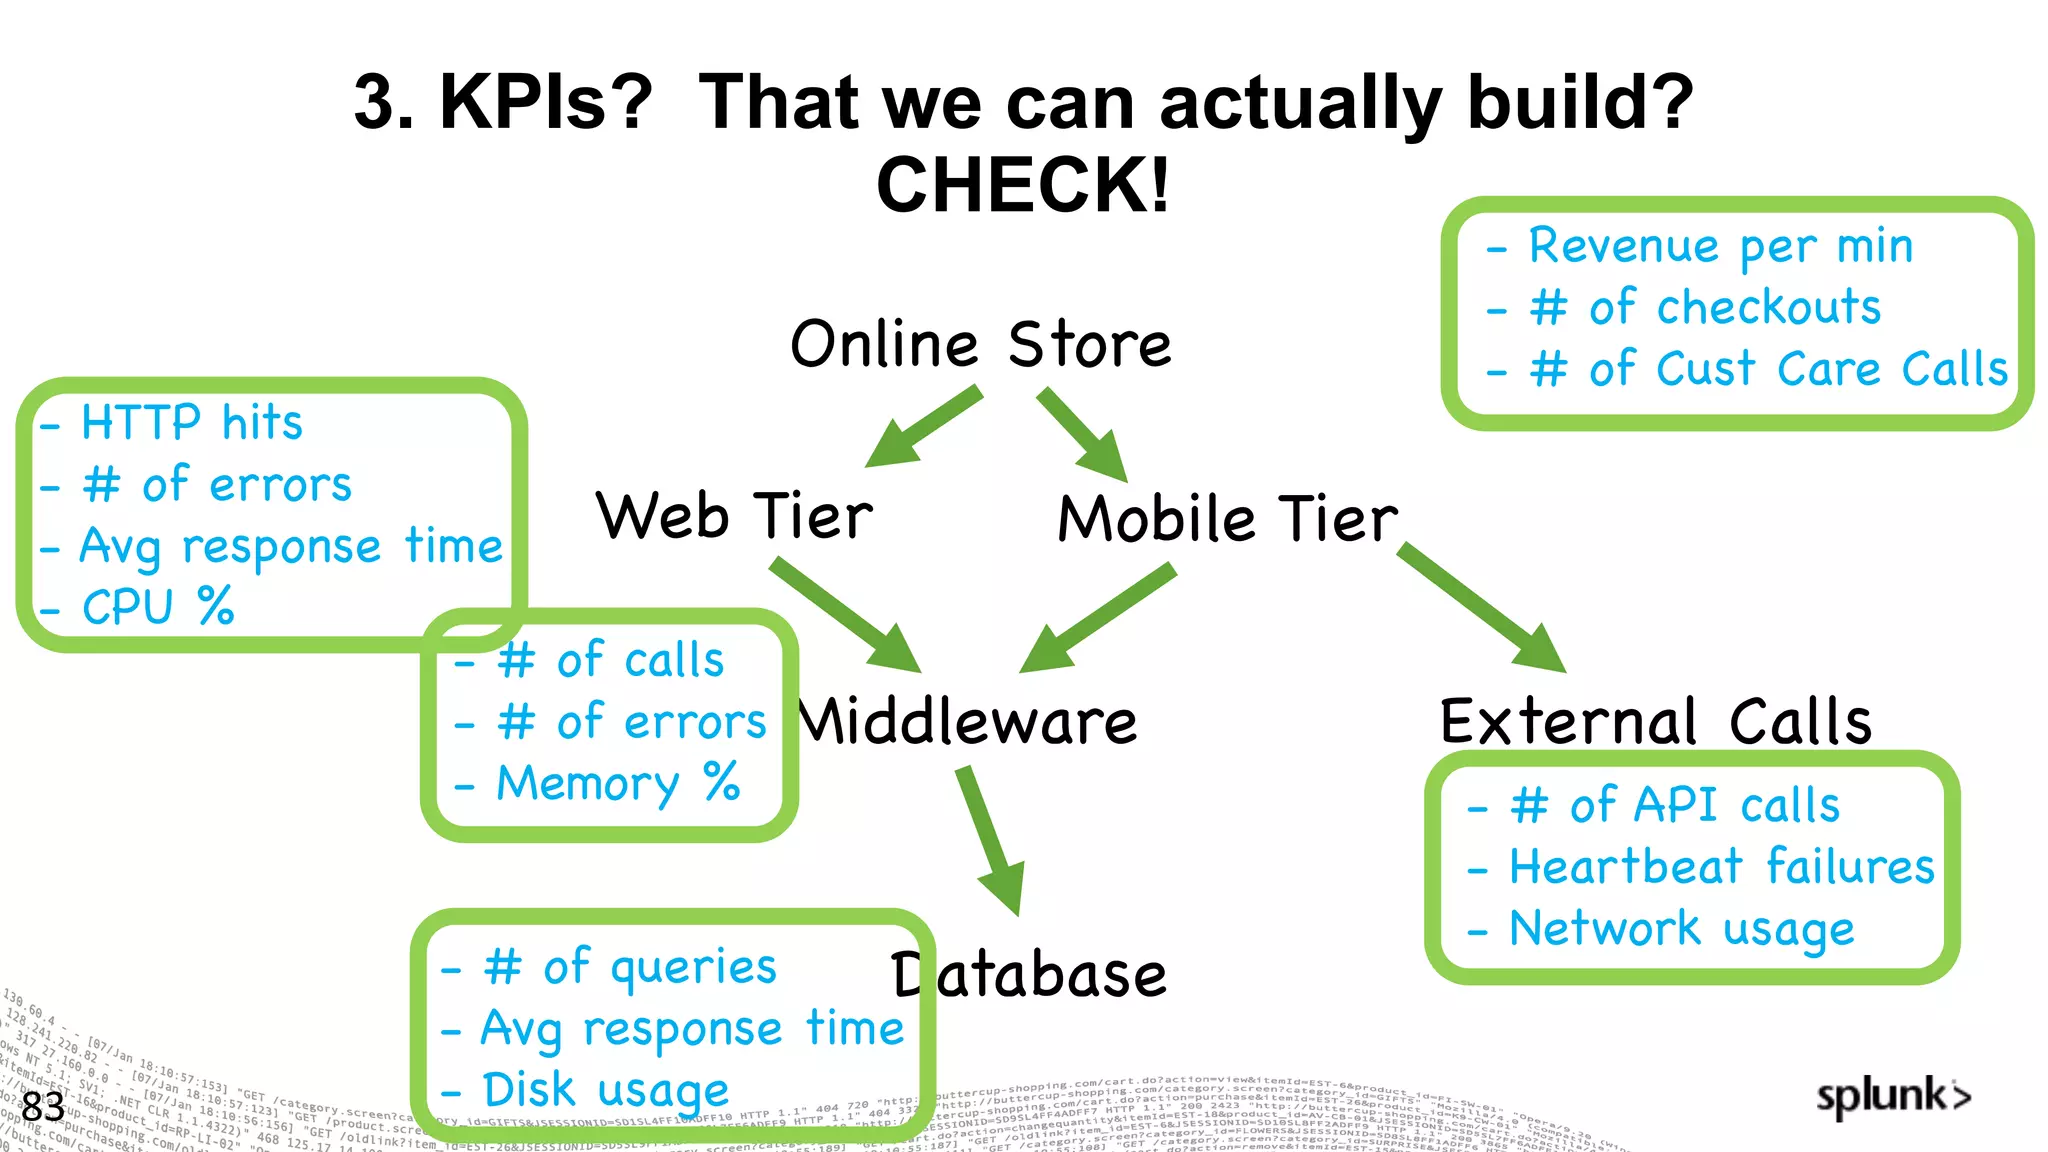


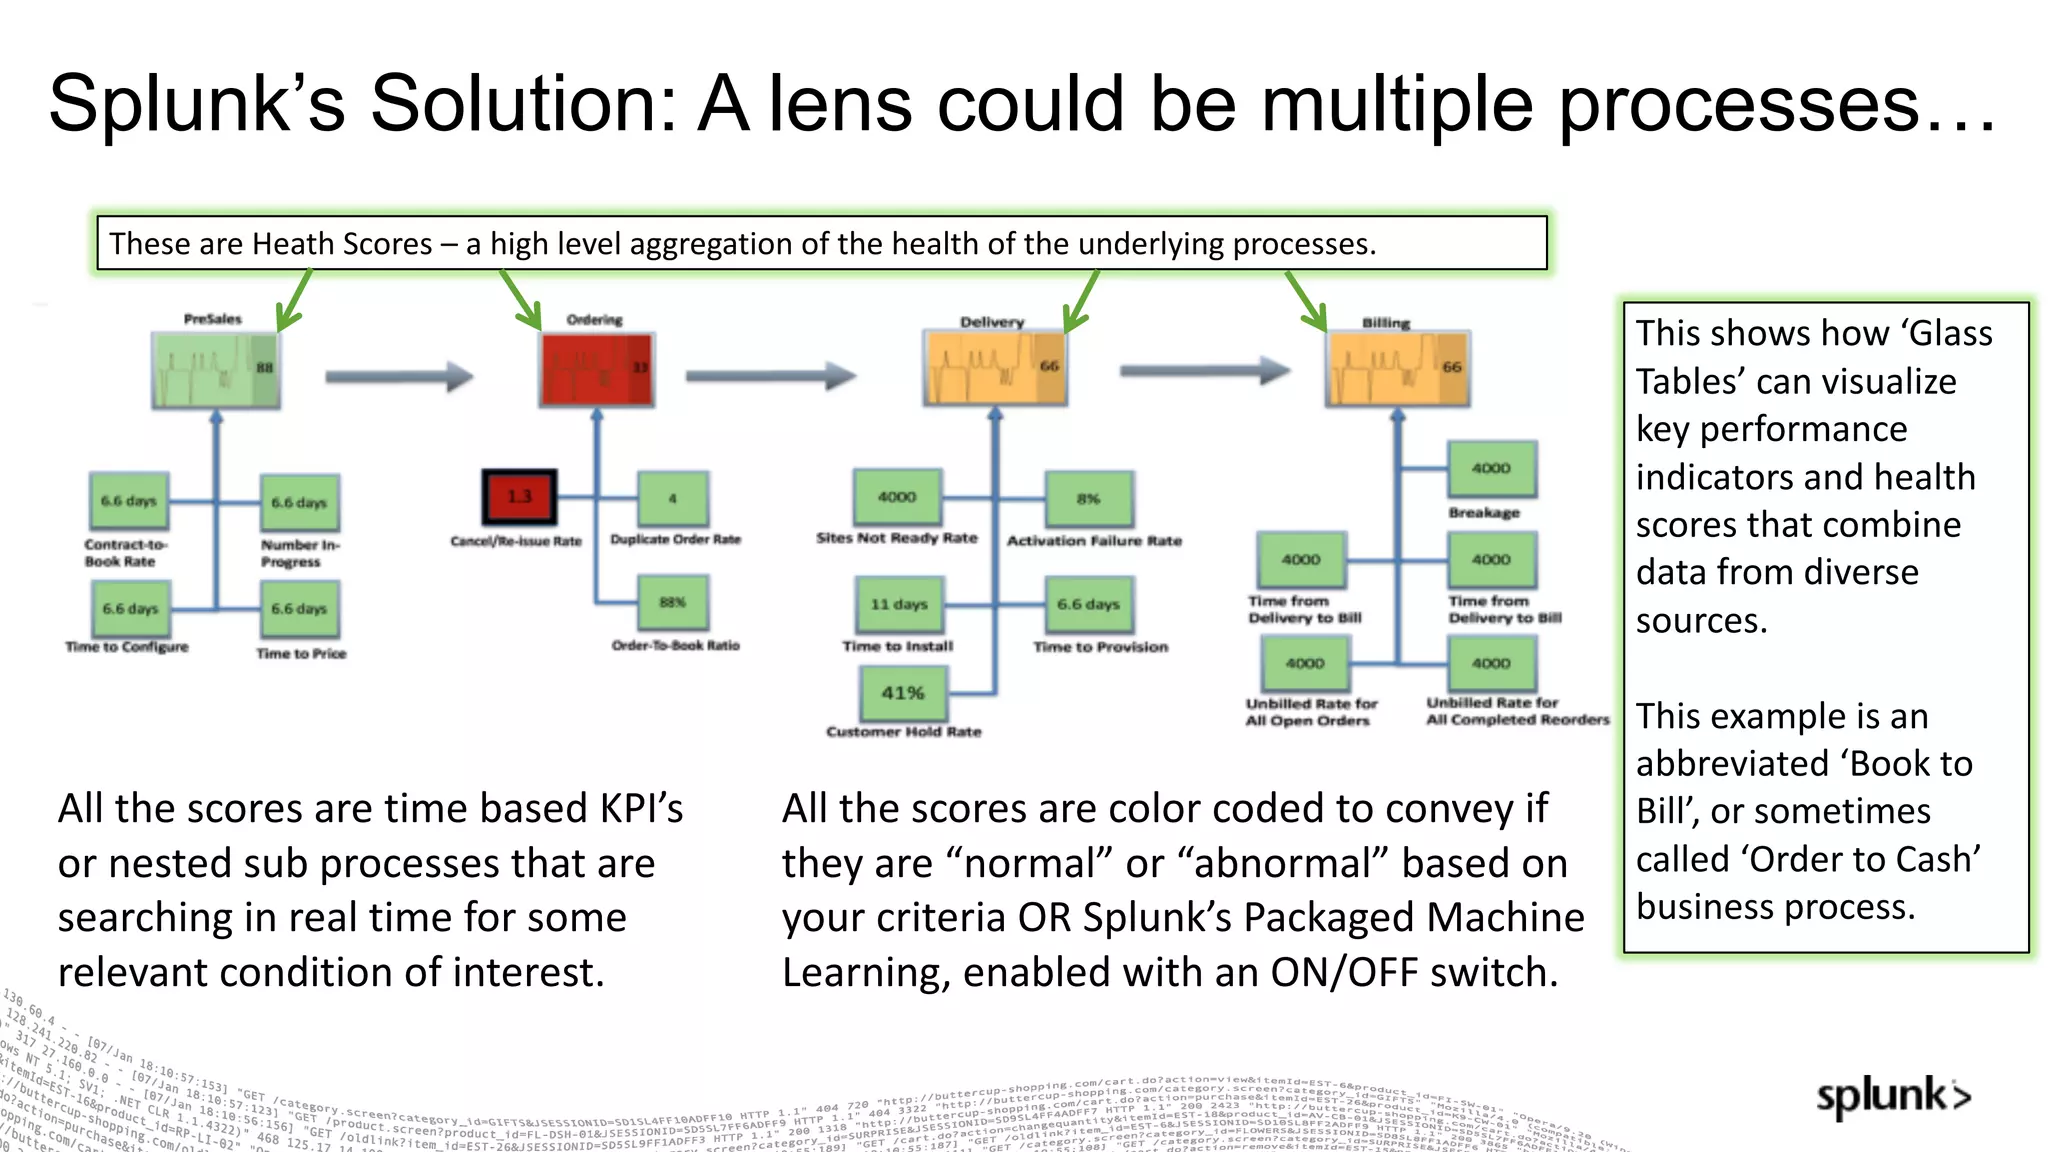
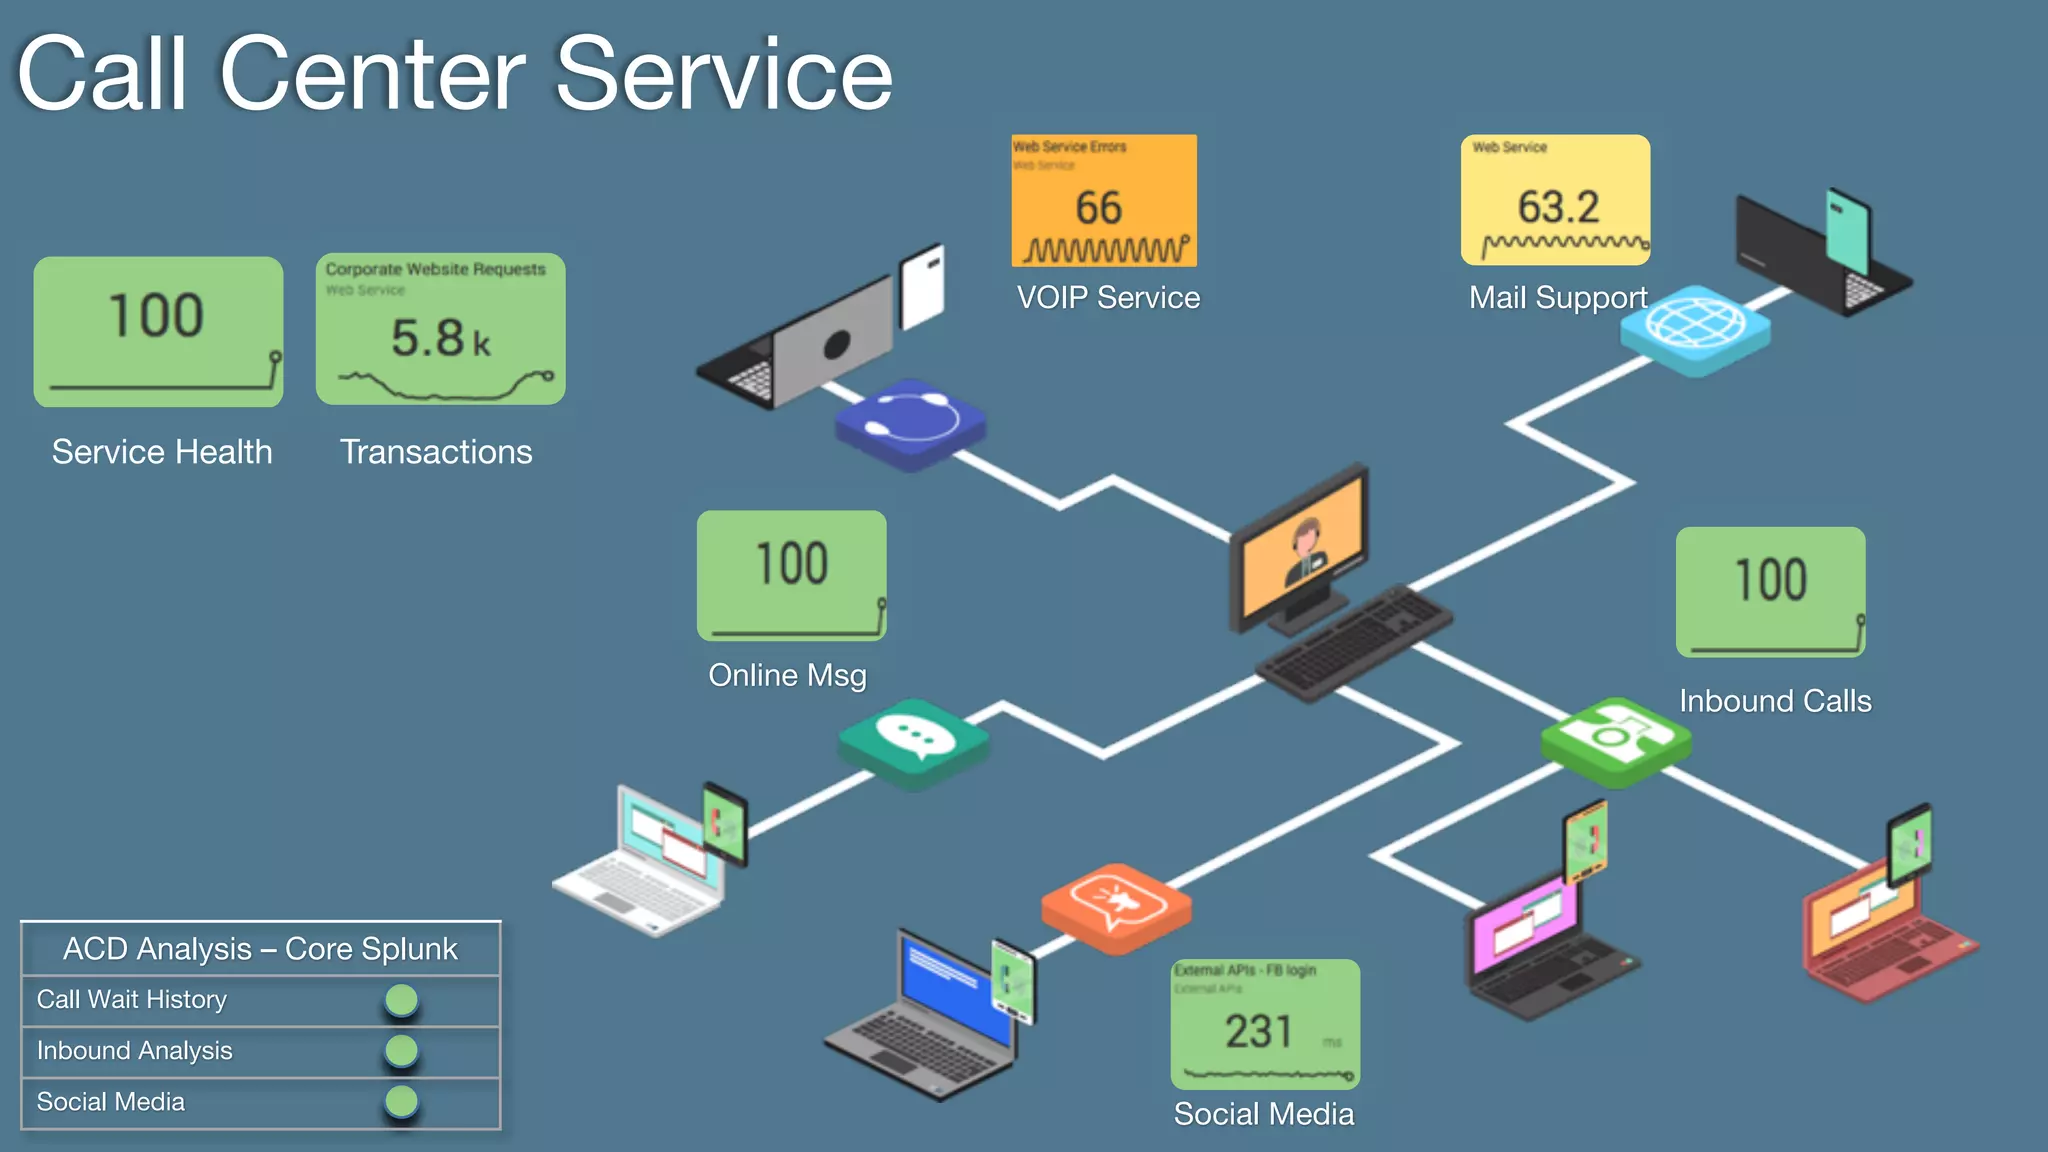
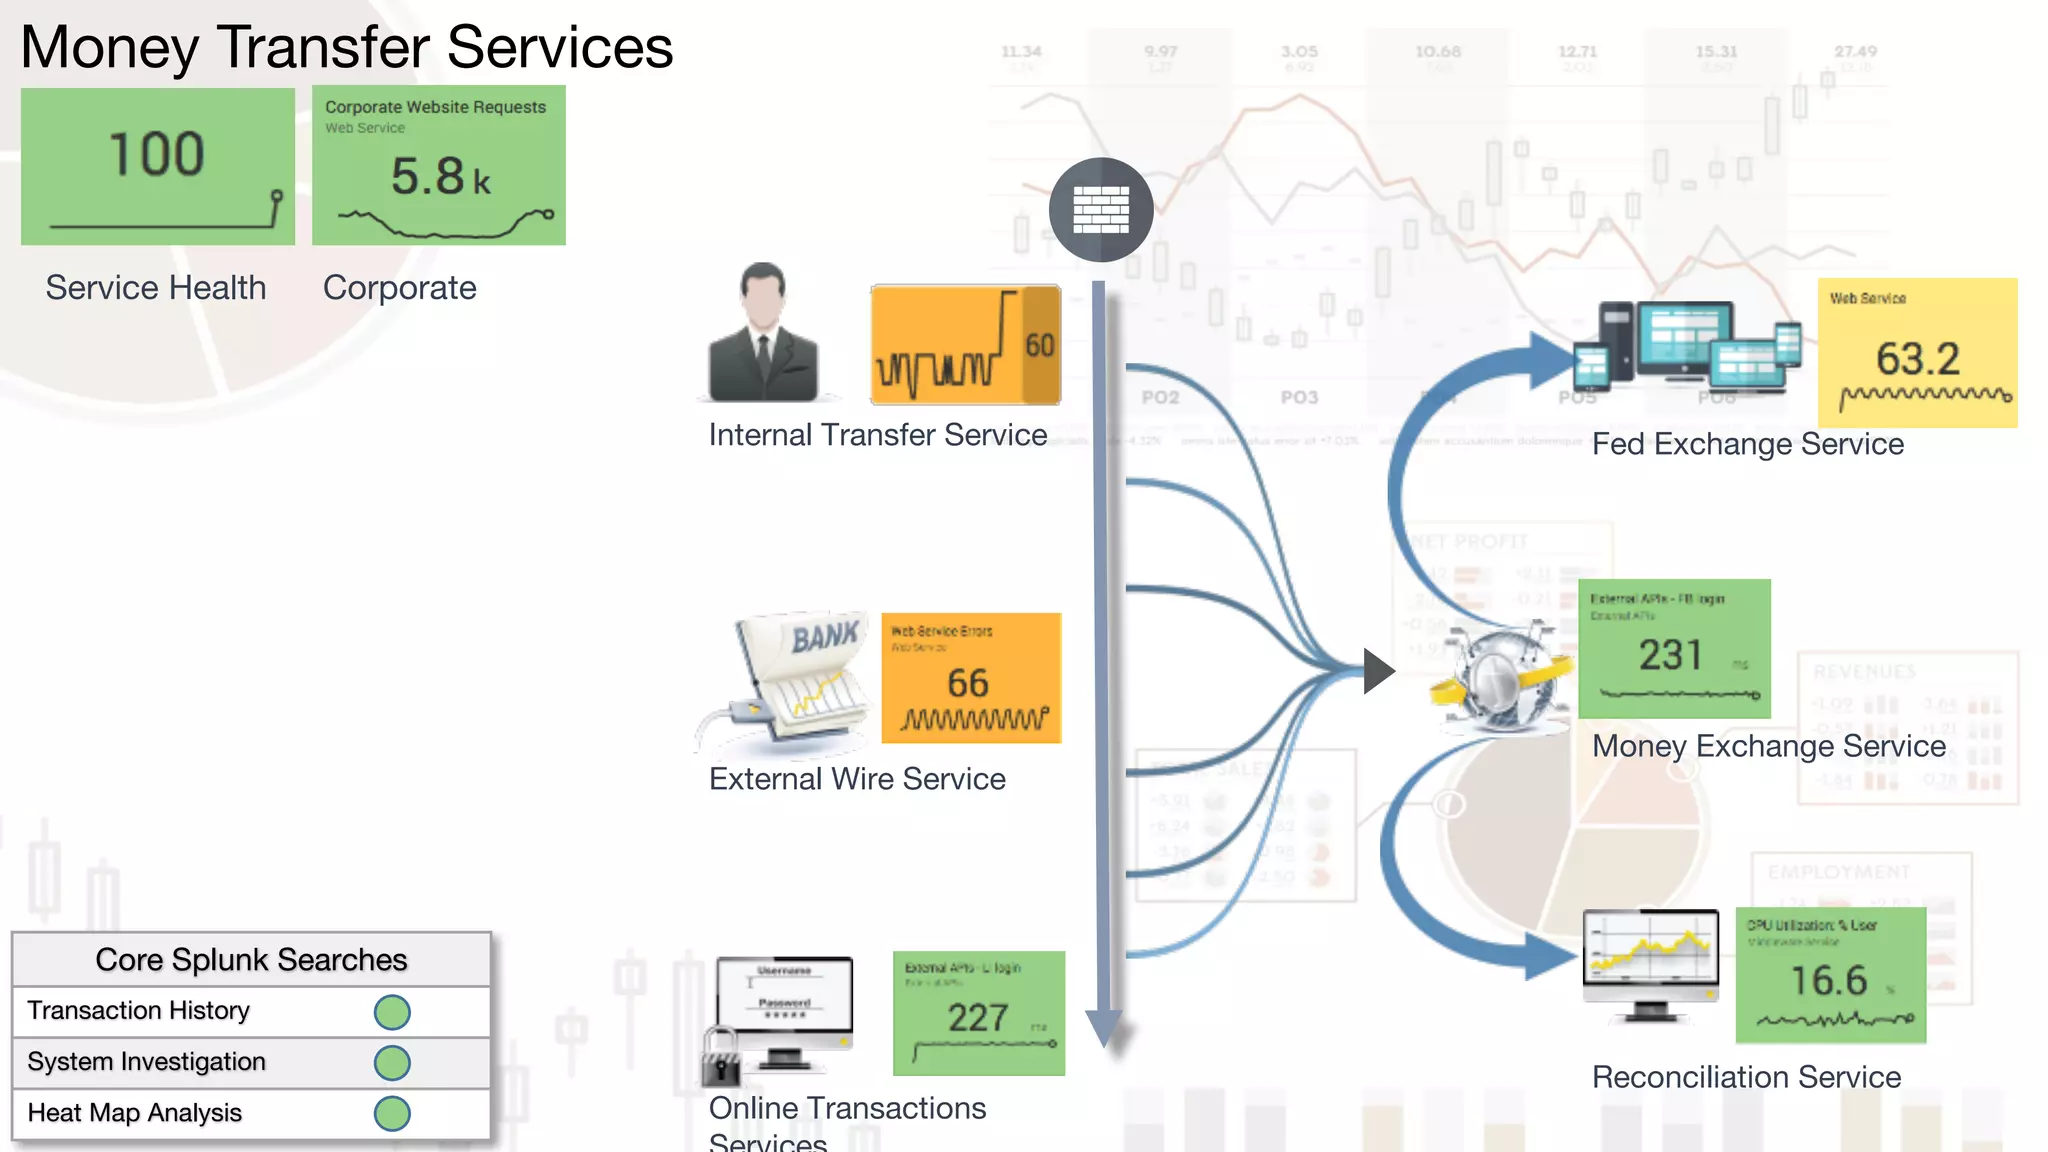
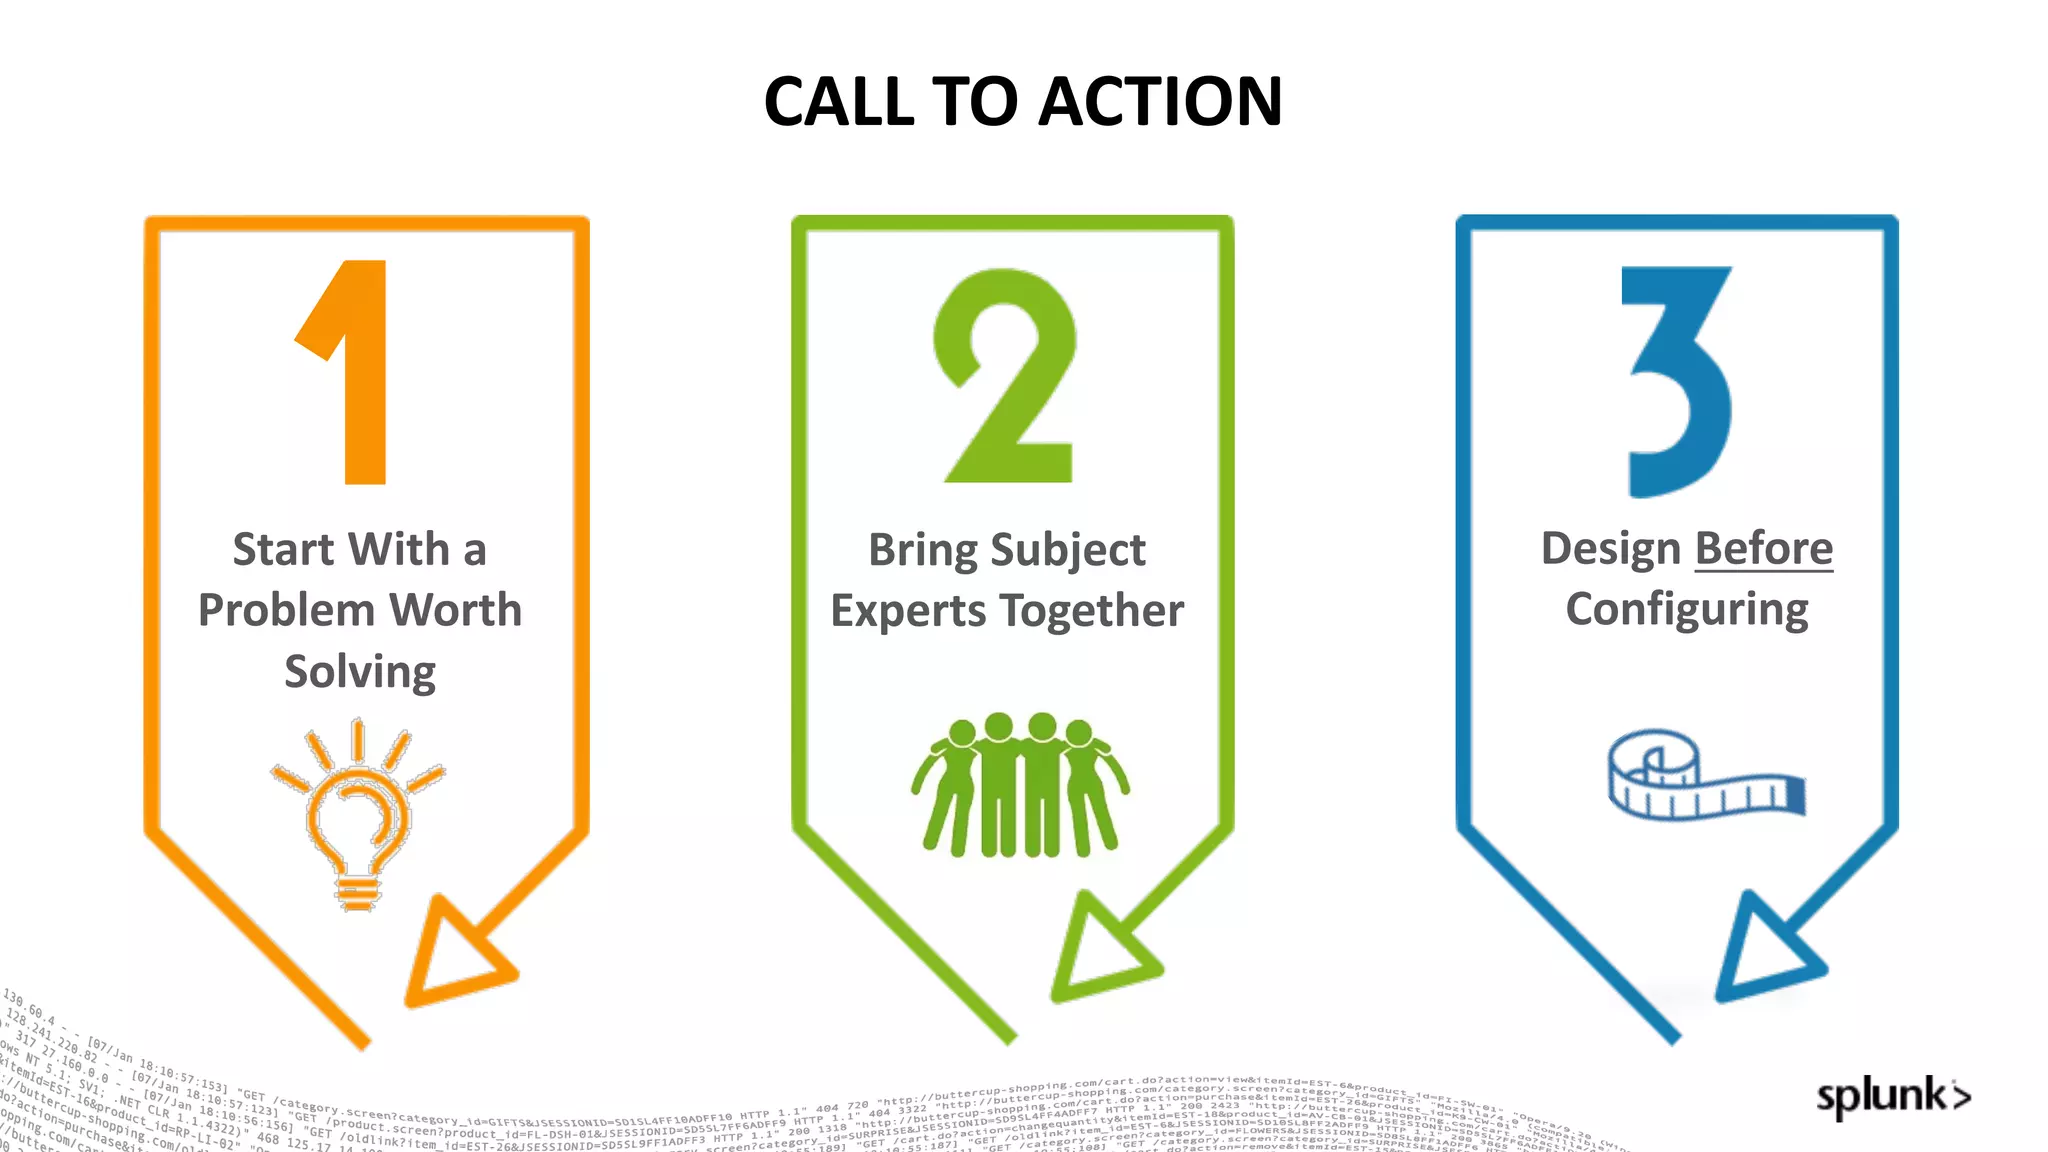


- Involve subject matter experts from relevant teams to ensure all aspects of services are understood - Design the service model before configuring in the tool to work out dependencies and relationships - Start by identifying a high-value business service you want to improve and work backwards to technical services - Map out all supporting technical services needed for the business service to operate - Determine the most important key performance indicators to monitor for each service - Create Splunk searches to populate each key performance indicator with relevant metrics


![Vibe Coding vs. Spec-Driven Development [Free Meetup]](https://cdn.slidesharecdn.com/ss_thumbnails/vibecodingvsspecdrivendevelopment-251209105622-43f455e7-thumbnail.jpg?width=640&height=640&fit=bounds)


